


ChainLink (LINK) has been moving upwards since April 18. It proceeded to reach a new all-time high (ATH) price on May 5.
LINK has nearly reached an important Fib resistance level which could cause a short-term rejection. Despite this, the trend is considered bullish as long as the token is trading above the $42.70 support area.
New LINK all-time high
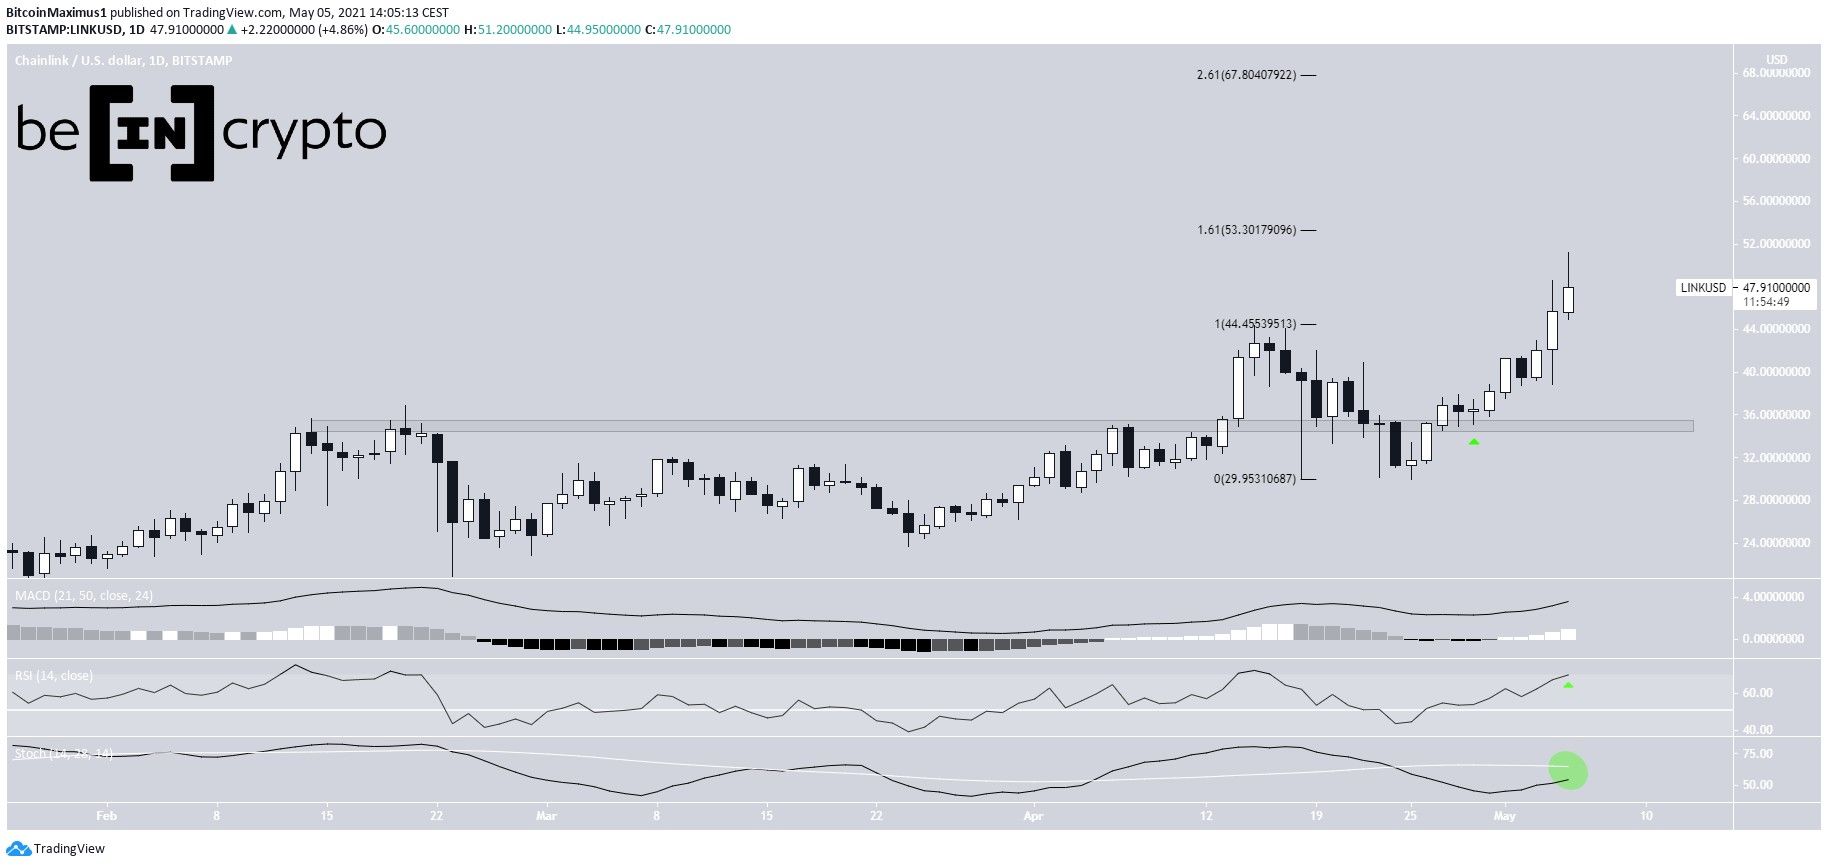
LINK has been moving upwards since April 18. On April 27, it managed to break out above the previous resistance area of $35 and validated it as support a few days later (green arrow).
The rate of increase accelerated on May 4, and LINK reached a new all-time high price of $51.20 the next day.
Technical indicators are bullish. This is especially evident by the potential bullish cross in the Stochastic Oscillator and the RSI cross above 70. In addition, the MACD is positive and increasing.
The next closest resistance areas are found at $53.30 and $67.80. These are the 1.61 and 2.61 external Fib retracements of the most recent drop.
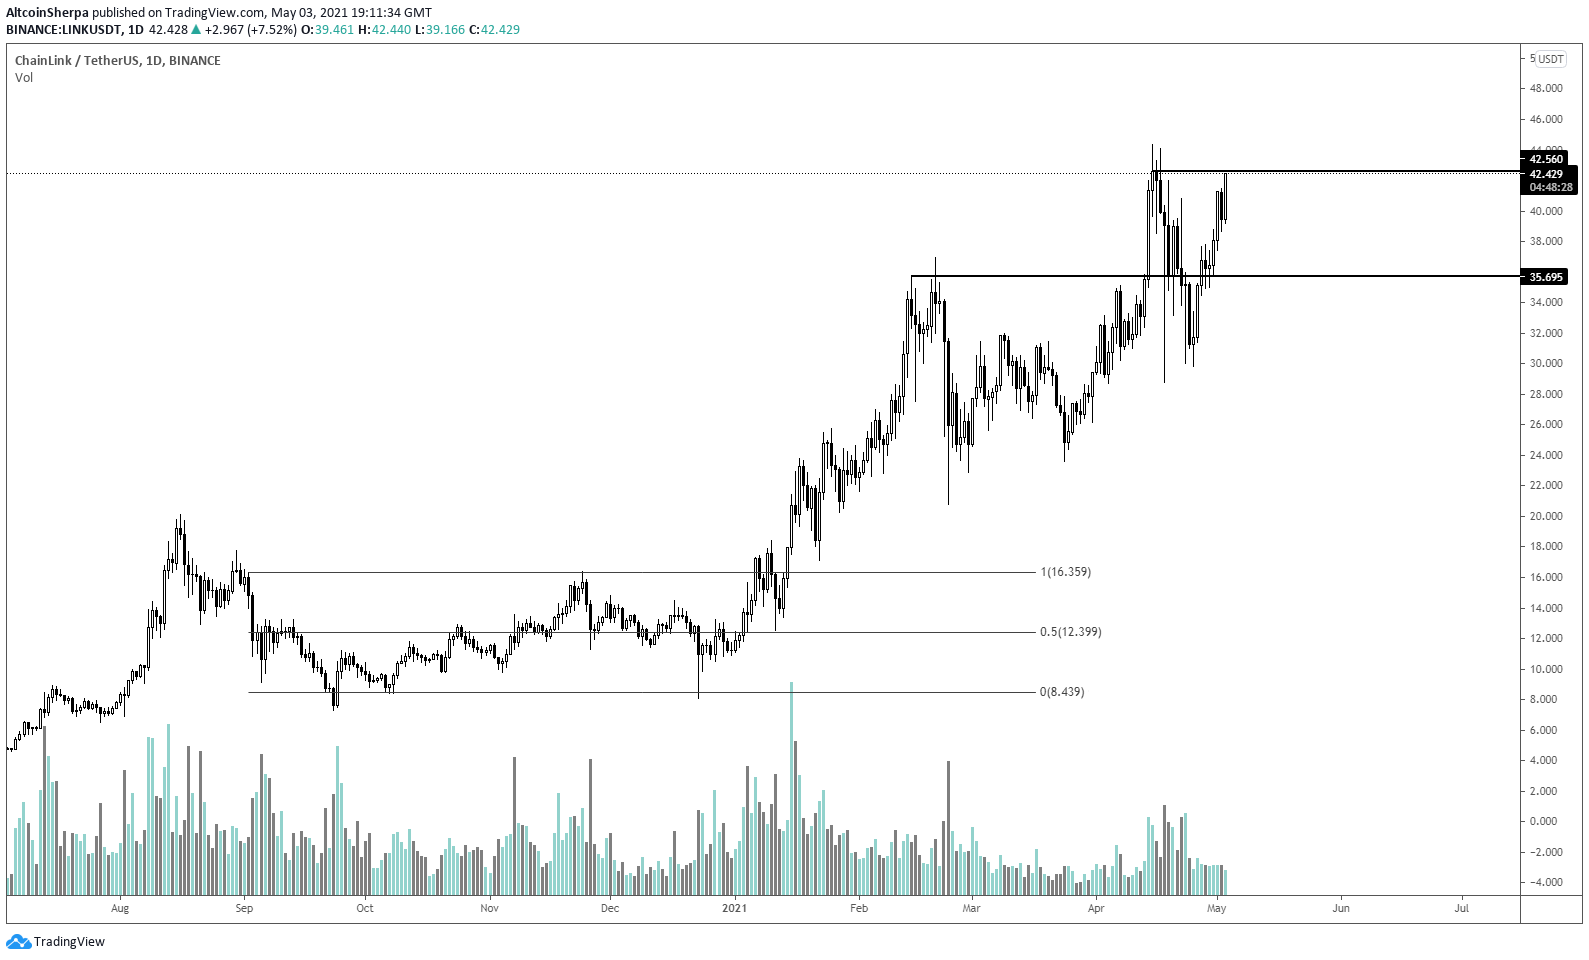
Cryptocurrency trader @Altcoinsherpa outlined a LINK chart, which shows a potential double top near the $42 resistance area. Since the tweet, the price has moved above this level, proceeding to reach a new all-time high.
Short-term movement
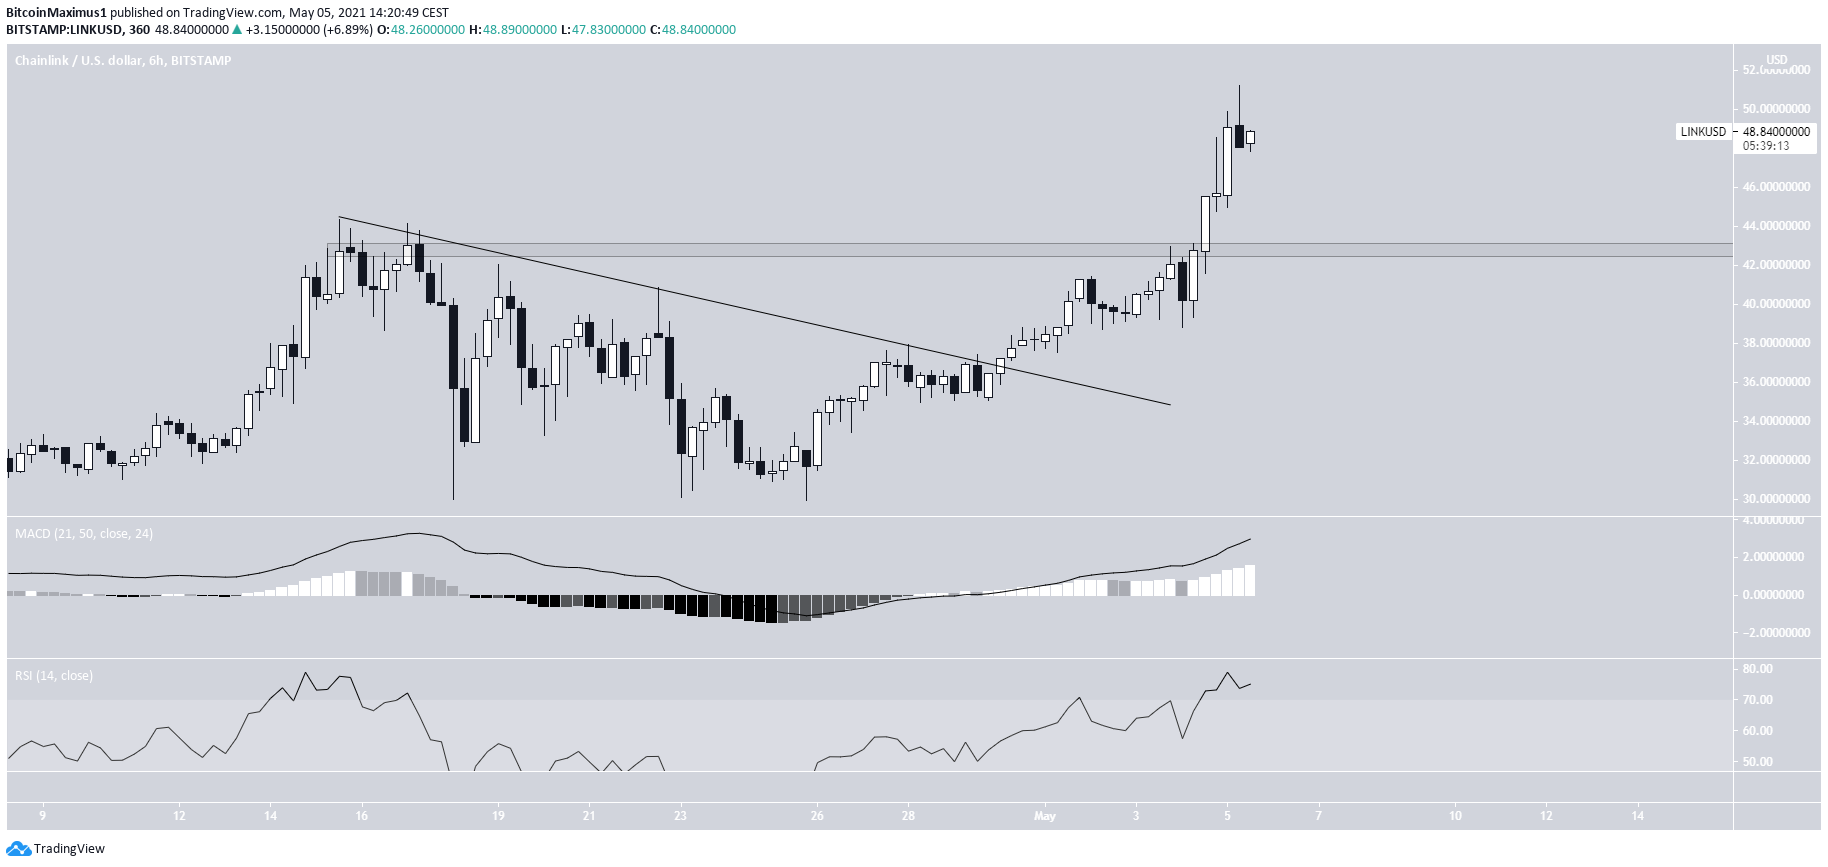
The shorter-term six-hour chart shows a breakout from a descending resistance line which led to the current all-time high price.
Neither the MACD nor RSI show any signs of weakness, despite the latter being overbought.
If LINK retraces in the short-term, the $42.70 area is expected to act as support. This is the previous all-time high level. The trend is considered bullish as long as the token is trading above this level.
LINK/BTC
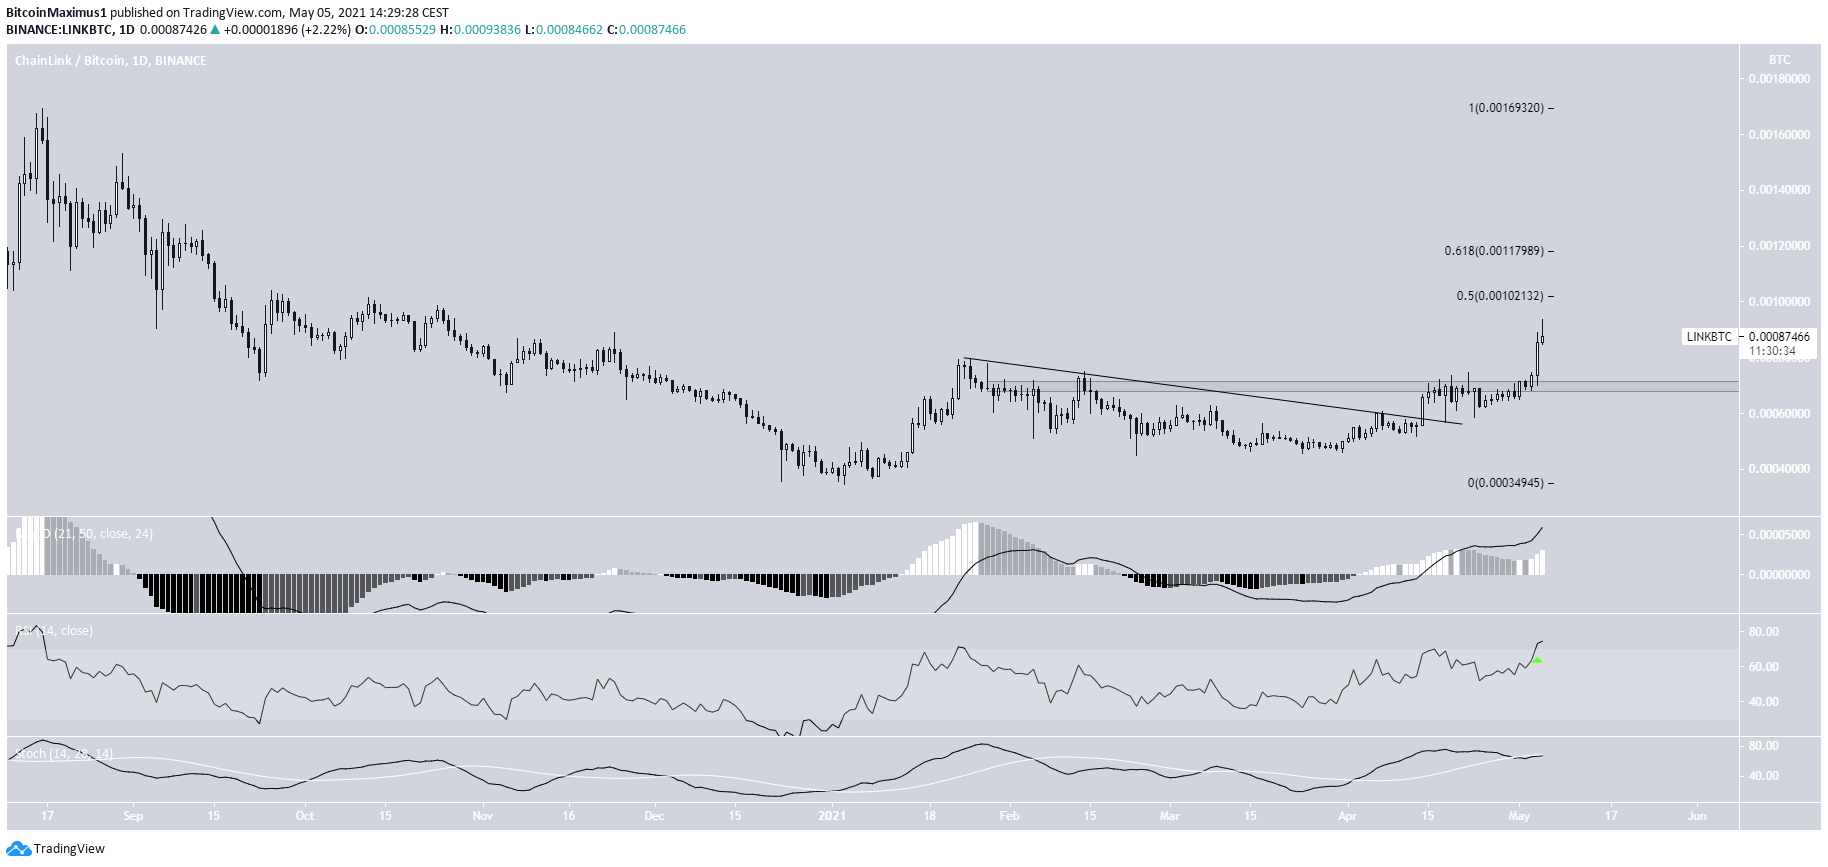
Similarly to the USD pair, LINK/BTC has broken out from a descending resistance line. However, it is nowhere close to reaching a new all-time high. In fact, it is just approaching the 0.5-0.618 Fib resistance levels at 102,000-118,000 satoshis.
Despite technical indicators being bullish, a rejection could occur at this level, prior to trend continuation. If so, the closest support area is found at 70,000 satoshis.
To conclude, LINK is expected to continue increasing towards a new all-time high. While a short-term rejection could occur, the token is not likely to decrease below the $42.70 area.
For BeInCrypto’s latest bitcoin (BTC) analysis, click here.



