


Bitcoin kick-started the global adoption of blockchain technology, peer-to-peer transactions, and almost everything in between. Yet, in 2026, history isn’t the most interesting aspect of the original cryptocurrency. This guide covers the concept of Bitcoin dominance, it’s usefulness as a trading indicator, and what to know about the Bitcoin Dominance Chart.
KEY TAKEAWAYS
➤ Bitcoin dominance is a metric used to measure the relative market share or dominance of BTC in the overall crypto market.
➤ When BTC dominance is high, it generally implies that investors are more confident in Bitcoin relative to other crypto assets.
➤ While Bitcoin dominance can provide some insights, it’s not a definitive guide to investment strategy. The crypto market is volatile and can be influenced by a number of complex factors, with BTC dominance just one element traders should consider.
- What is the Bitcoin Dominance Chart?
- What does Bitcoin dominance mean?
- Factors impacting Bitcoin dominance
- Benefits of the Bitcoin Dominance Chart
- Disadvantages of the Bitcoin Dominance Chart
- Is the Bitcoin Bominance chart a reliable indicator?
- Bitcoin Dominance is a handy trend analysis tool
- Frequently asked questions
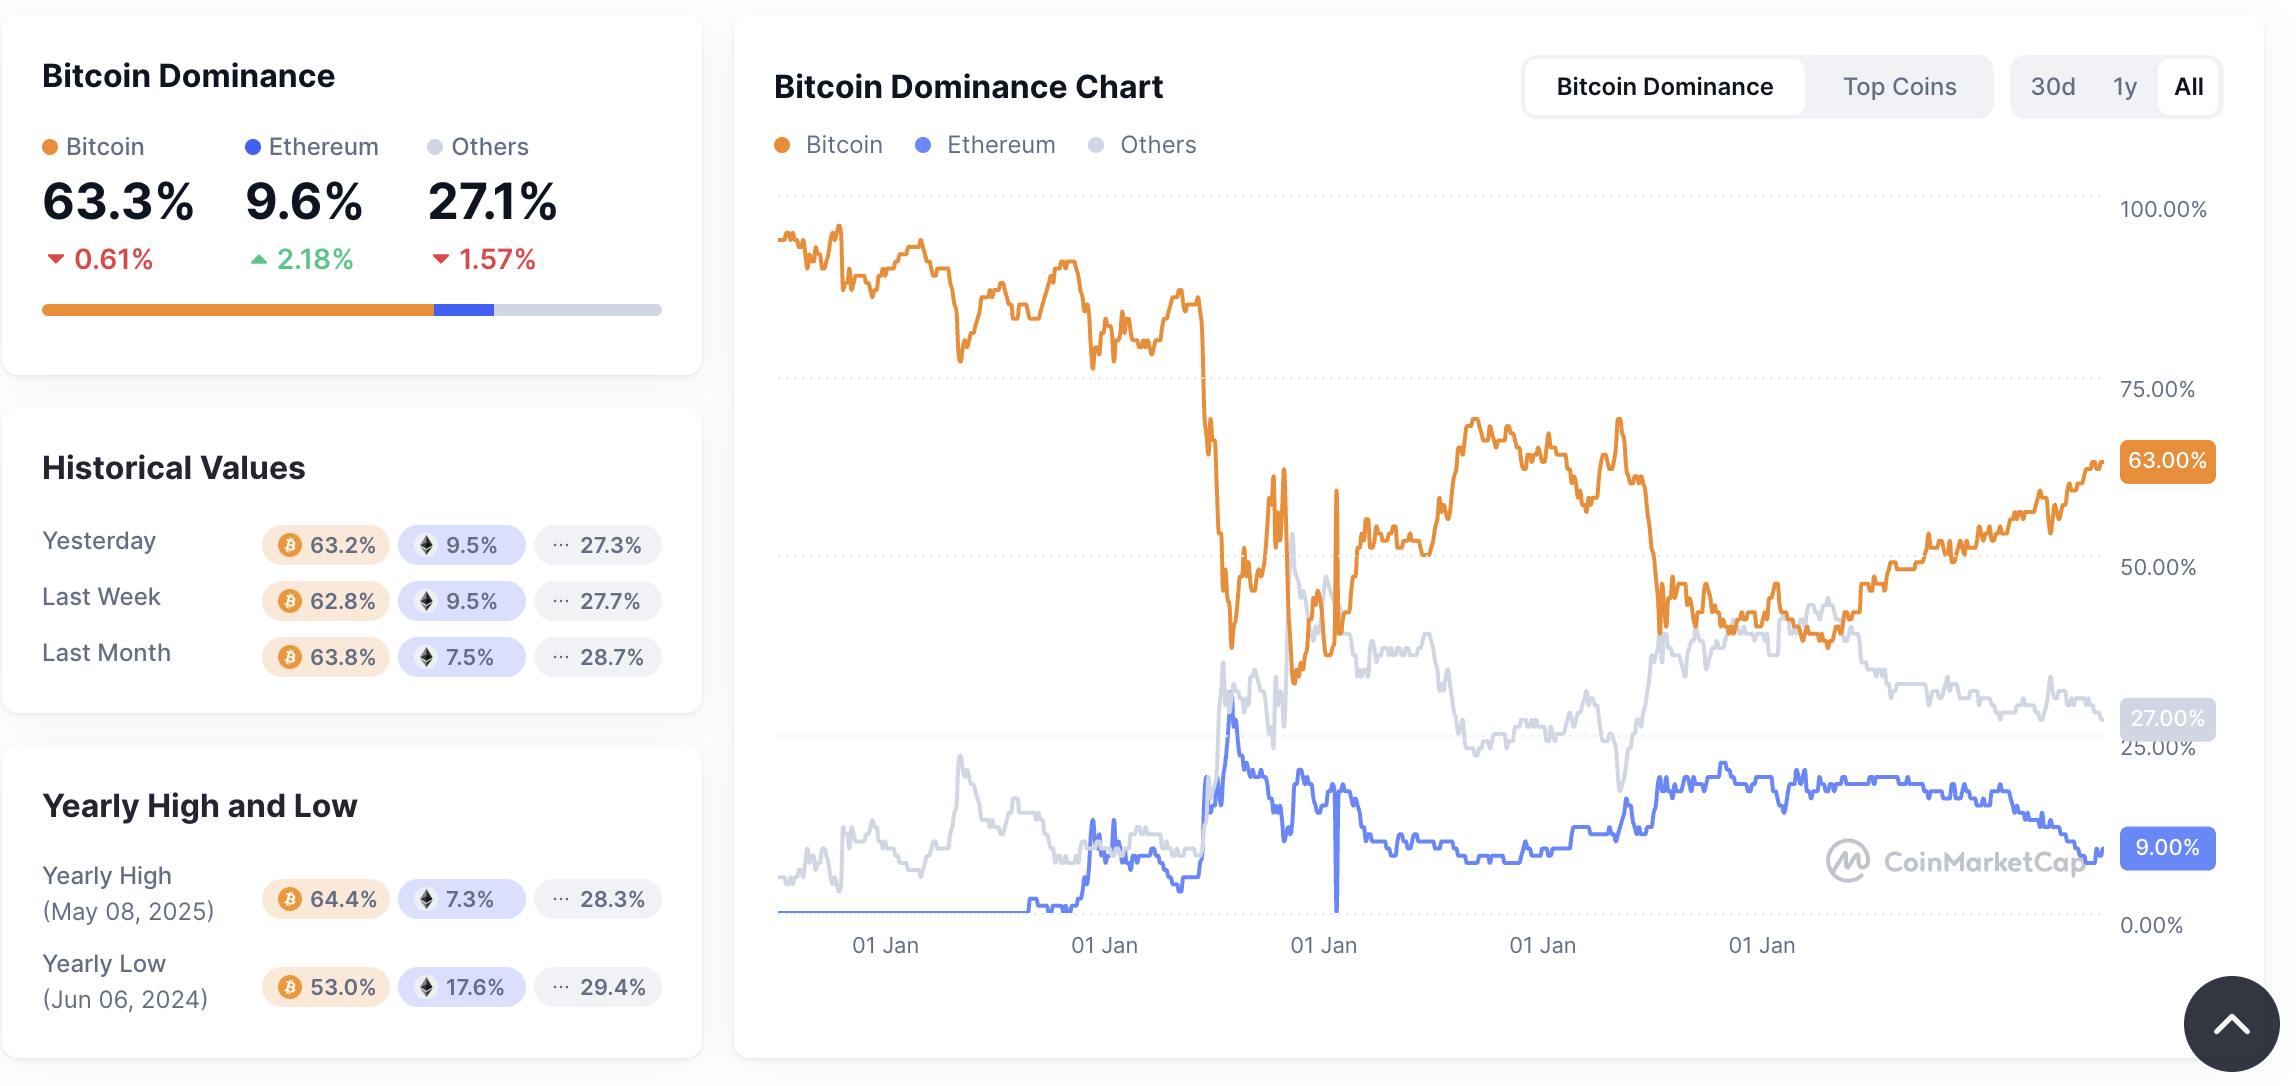
What is the Bitcoin Dominance Chart?
The Bitcoin Dominance Chart acts as a market sentiment indicator. It shows Bitcoin’s market cap proportion and reflects the shifting investor interest between Bitcoin and altcoins, helping you gauge the market’s risk appetite.
History
Several trading communities started using the Bitcoin Dominance Chart back in 2017. However, the chart started gaining ground in 2021 — the era of the altcoin boom. Currently, it is one of the more reliable investing indicators around. It should be noted that it is more fundamental than technical.
Bitcoin Dominance Chart: uses
The BTC Dominance Chart isn’t your regular trading indicator. However, it has the following uses:
Risk aversion
Growing Bitcoin dominance, which is shown on the chart, indicates that current crypto traders and investors are slowly becoming more risk-averse. This usually happens in a slow bear market when BTC looks like the most reliable option to invest and trade.
Tradeability
BTC dominance isn’t just an index. Instead, on Binance, you can trade the BTCDOM/USDT perpetual futures. Therefore, using BTC dominance as a short-term and leveraged trading instrument is also possible, provided you know to read the Bitcoin Dominance Chart in relation to other metrics.
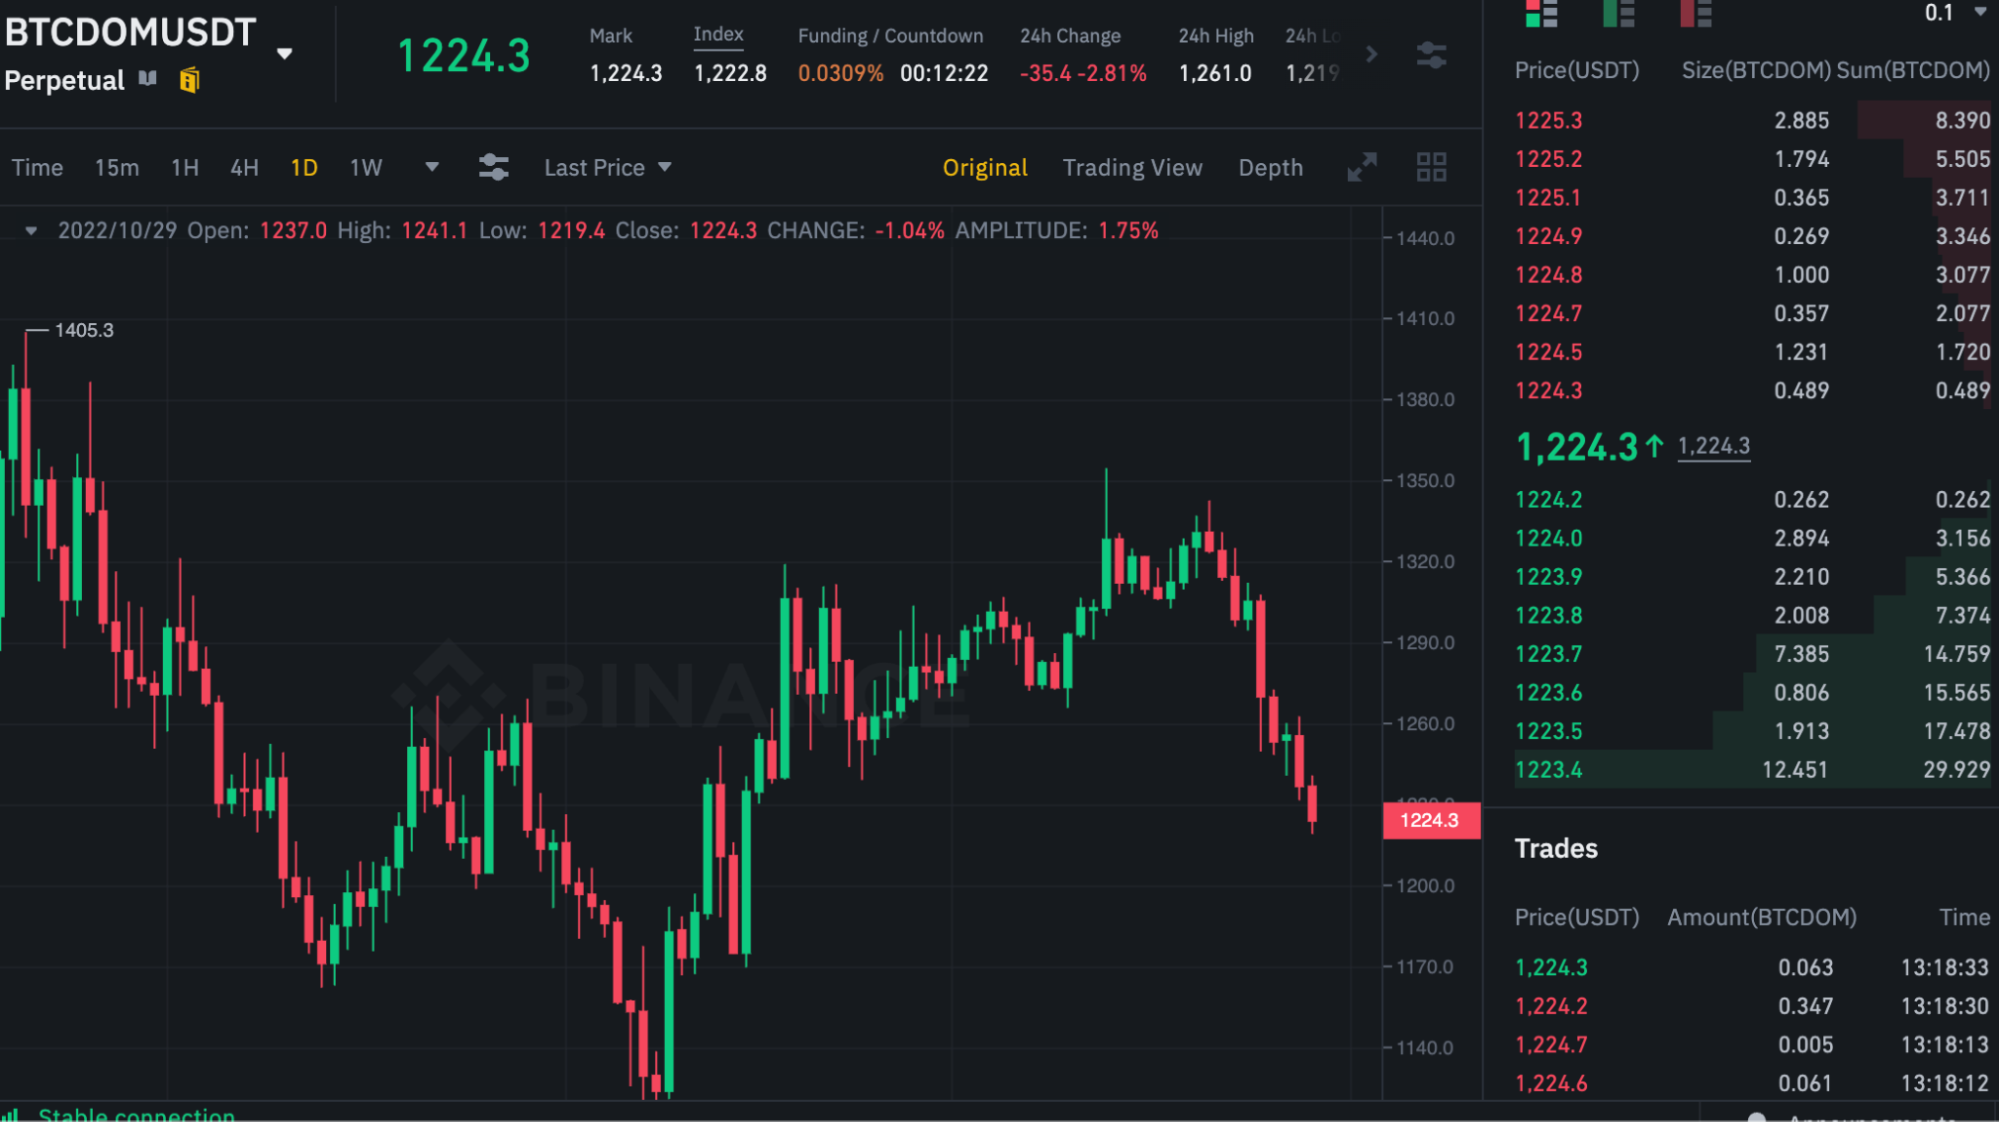
A perpetual futures contract is more like a simple futures contract but without an expiry date.
What does Bitcoin dominance mean?
The short answer is (BTC market cap/ total crypto market cap) x 100.
The longer answer is that BTC dominance is a percentage value that measures how dominant BTC is compared to the total market.
The growth of the altcoin space (new coins/tokens showing up each day) has made Bitcoin dominance a highly useful signal. Several crypto traders and investors prefer using this resource for fine-tuning their portfolios and trading/investing strategies.
Growing BTC dominance means that Bitcoin is growing compared to other altcoins. This might mean any of the following:
- BTC is eroding less than other correcting altcoins, especially in a bear market.
- More BTC is getting added to its supply pool due to increased mining activity.
- A drop in the overall market capitalization in a bear market.
- A surge in the overall market capitalization in a bull market, with BTC showing some aggressive price action compared to altcoins.
Why only Bitcoin and not Ethereum?
As BTC dominance is a ratio of the Bitcoin market cap to the overall crypto market cap, the calculation method holds even for other cryptos.
Theoretically, anyone can find out Ethereum or Cardano dominance by applying simple mathematics. However, we usually talk only about Bitcoin as it started as the first commercial crypto and is still the most dominant asset to date in terms of market capitalization.
Moreover, Bitcoin dominance isn’t a standalone concept. As per the Bitcoin fear and greed index, “Dominance” is one of the sub-index indicators with a 15% weightage.
Factors impacting Bitcoin dominance
Here are some of the important factors known to affect BTC dominance.
Bitcoin value
If BTC moves up the price chart, its market dominance increases. Before altcoins were popular, BTC dominance was close to 90%. Yet, things started to change with blockchain-powered gaming, DeFi, and RWAs growing popular. Therefore, every new advancement in the crypto space that brings about a new token or trend theoretically plays a role in pushing Bitcoin’s dominance down.
While BTC dominance is no longer at 90%, though, the OG crypto still sits at around 63% dominance as of early June 2025. Many altcoins have not experienced the gains that Bitcoin has in its current, post-halving cycle.
It’s important to note, though, that the only way BTC’s dominance stays up is if the cryptocurrency keeps rising in popularity. Value (price) might be subjective and might not truly represent BTC dominance at all times.
Altcoins
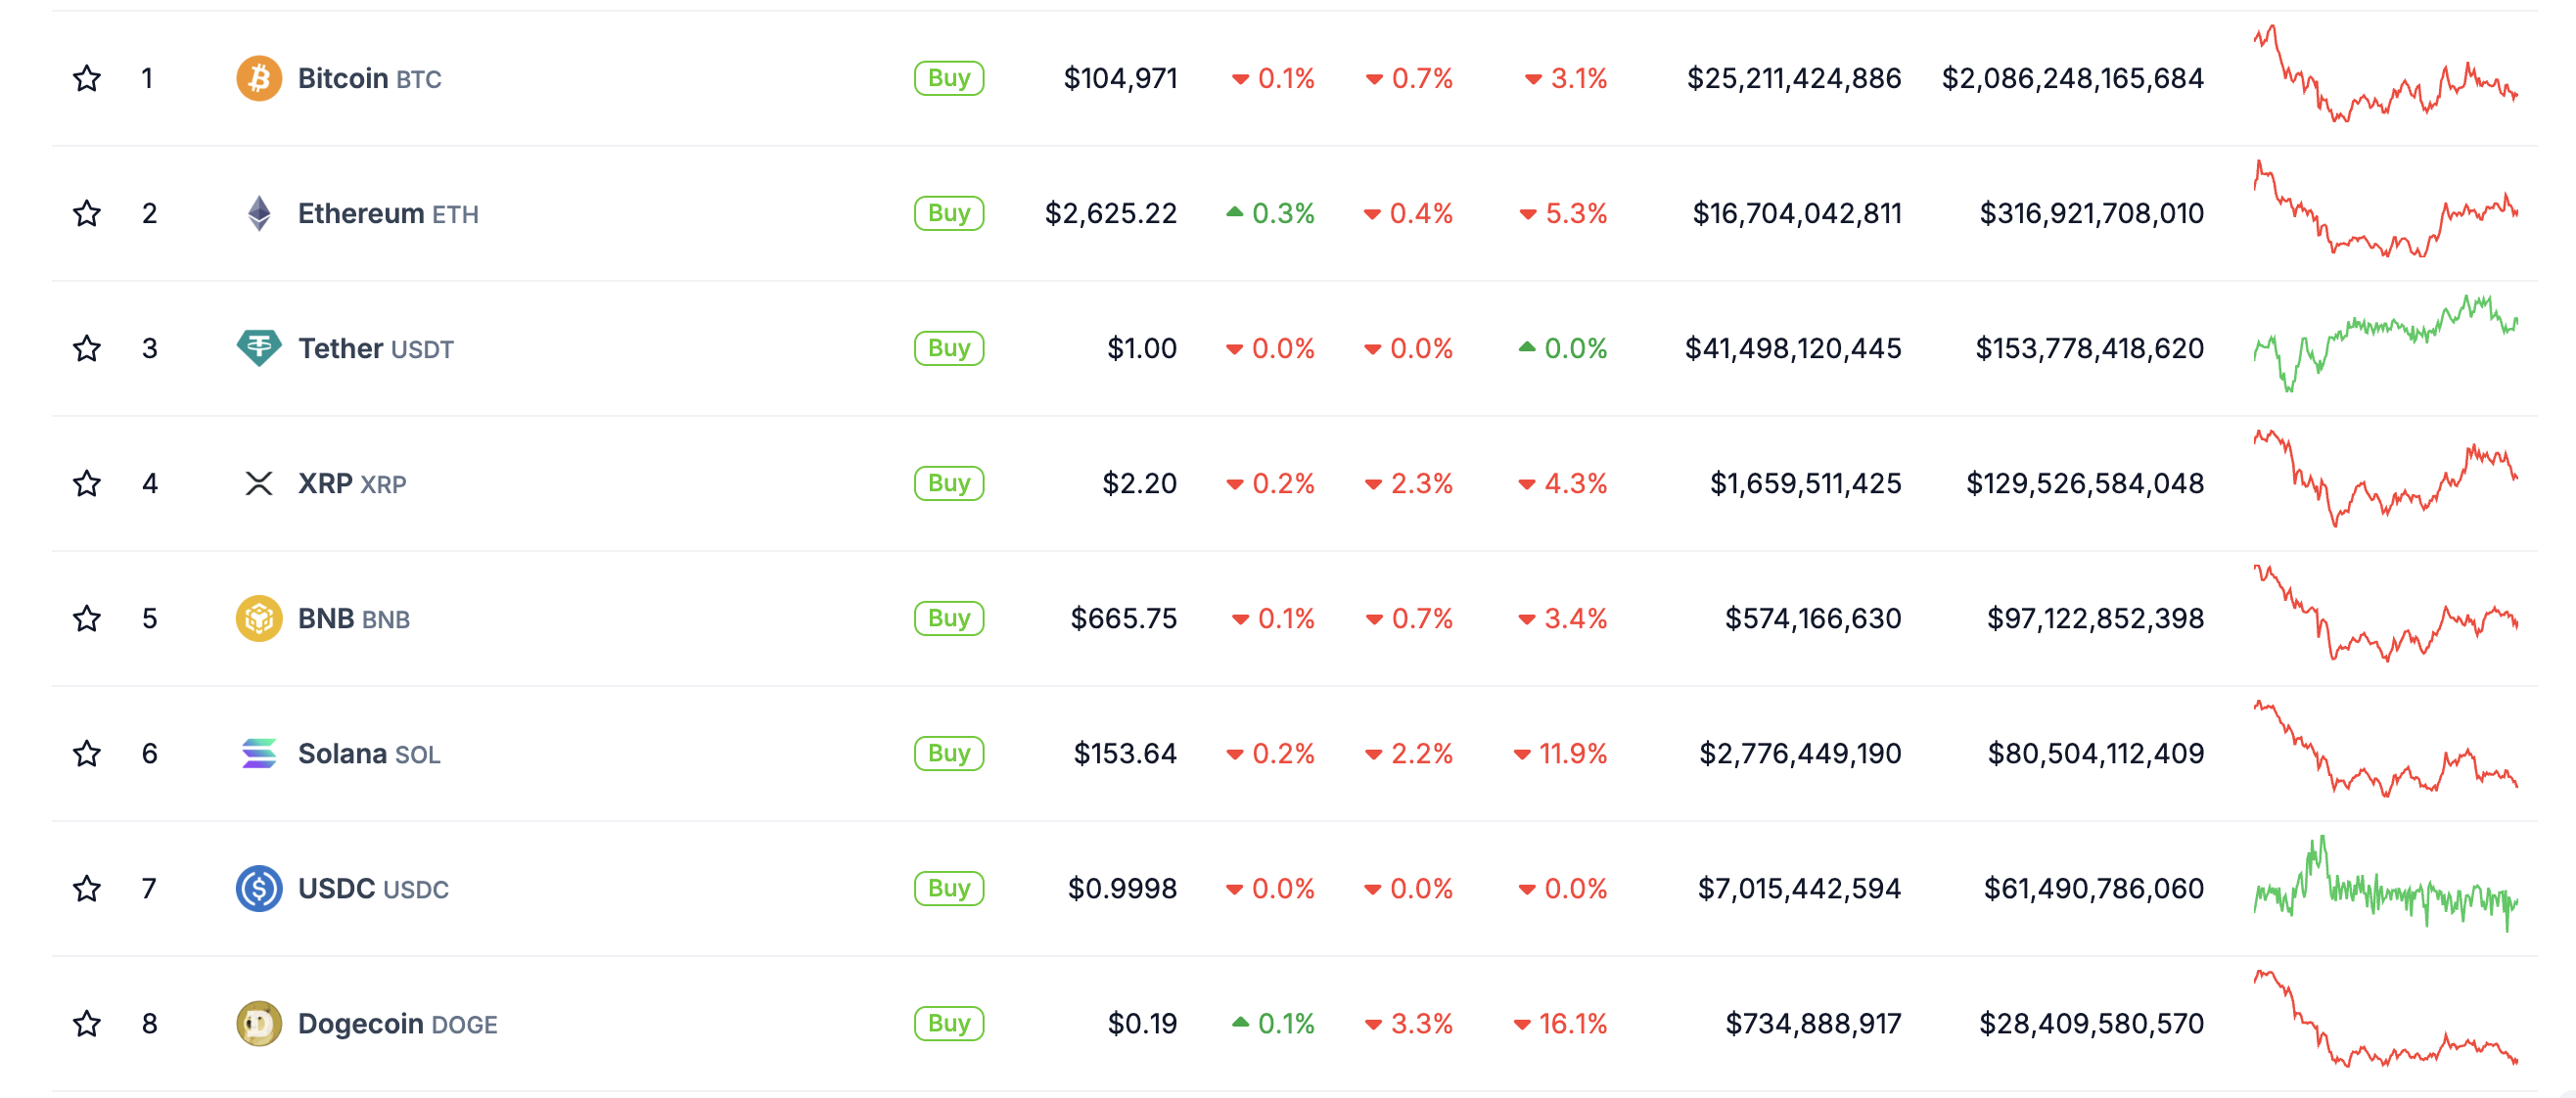
Do remember that according to the larger picture, it is always BTC vs. every other asset. Thus, Bitcoin dominance is impacted if money starts flowing to other cryptocurrencies in droves.
Stablecoin popularity
Satoshi Nakamoto envisioned Bitcoin for peer-to-peer transactions. However, in 2026, the asset still functions most obviously as a store of value.
Instead, stablecoins have taken up that mantle, on-ramping crypto investors to exchanges. Therefore, a rise in the popularity of stablecoins may dilute BTC dominance significantly. Unlike new altcoins, stablecoins like USDT and USDC have a prominent market presence — making them worthy adversaries to Bitcoin dominance.
Market conditions
The nature of the market can also impact Bitcoin’s dominance. You might see BTC dominance growing in a bear market, even with the total and BTC market cap dropping. This is because, over time, Bitcoin has become a relatively stable crypto asset, often following the path of traditional financial markets like the S&P 500 (just with healthier gains).
Bitcoin’s stability means that a drop in the total market cap impacts volatile altcoins more — leading to growing BTC dominance.
In a bull market, the reverse might be true. BTC dominance might fall despite the growing market cap as people are more willing to put funds into riskier altcoins, which are deemed to also have a higher reward potential.
Benefits of the Bitcoin Dominance Chart
If you can read the Bitcoin Dominance Chart, you can expect to reap the following benefits:
- You might be able to spot the onset of bear and bull market phases.
- You could spot reversal patterns.
- It may be possible to identify new altcoin seasons; phases when altcoins boom in terms of valuation.
- In a bear phase, growing BTC dominance can forecast a short-term price consolidation phase, market-wide.
Disadvantages of the Bitcoin Dominance Chart
Despite the perks, the Dominance Chart isn’t perfect. Here are a few disadvantages to make peace with:
Impact of increased supply
An increase in BTC supply due to mining activity might lead to an isolated surge in the Bitcoin Dominance Chart. However, this kind of chart development isn’t particularly useful when it comes to analyzing the trading moves.
Market cap shortcomings
Market capitalization as a valuation indicator isn’t always accurate. There can be seasons when some altcoins pack a lot of market volume due to an increase in trading volume and activity. Even sentimental drivers can push up token prices, adding to the market cap. If the gain across other altcoins is substantial, BTC dominance might end up taking a hit.
How to trade crypto using BTC dominance
The Bitcoin Dominance Chart can work as an effective indicator. Here is how it works:
BTC dominance to analyze market trends
Much like any other chart, even the BTC dominance chart moves in cycles. Hence, the concept of identifying a series of lower highs to determine downtrends can be useful in understanding the market breadth.
A downtrending Dominance Chart shows dilution. In a bull market, this might hint at a boom in the popularity of altcoins. In a bear market, this might hint at a trend reversal as it shows that people are getting confident enough to invest in other altcoins.
Using BTC dominance in relation to BTC price
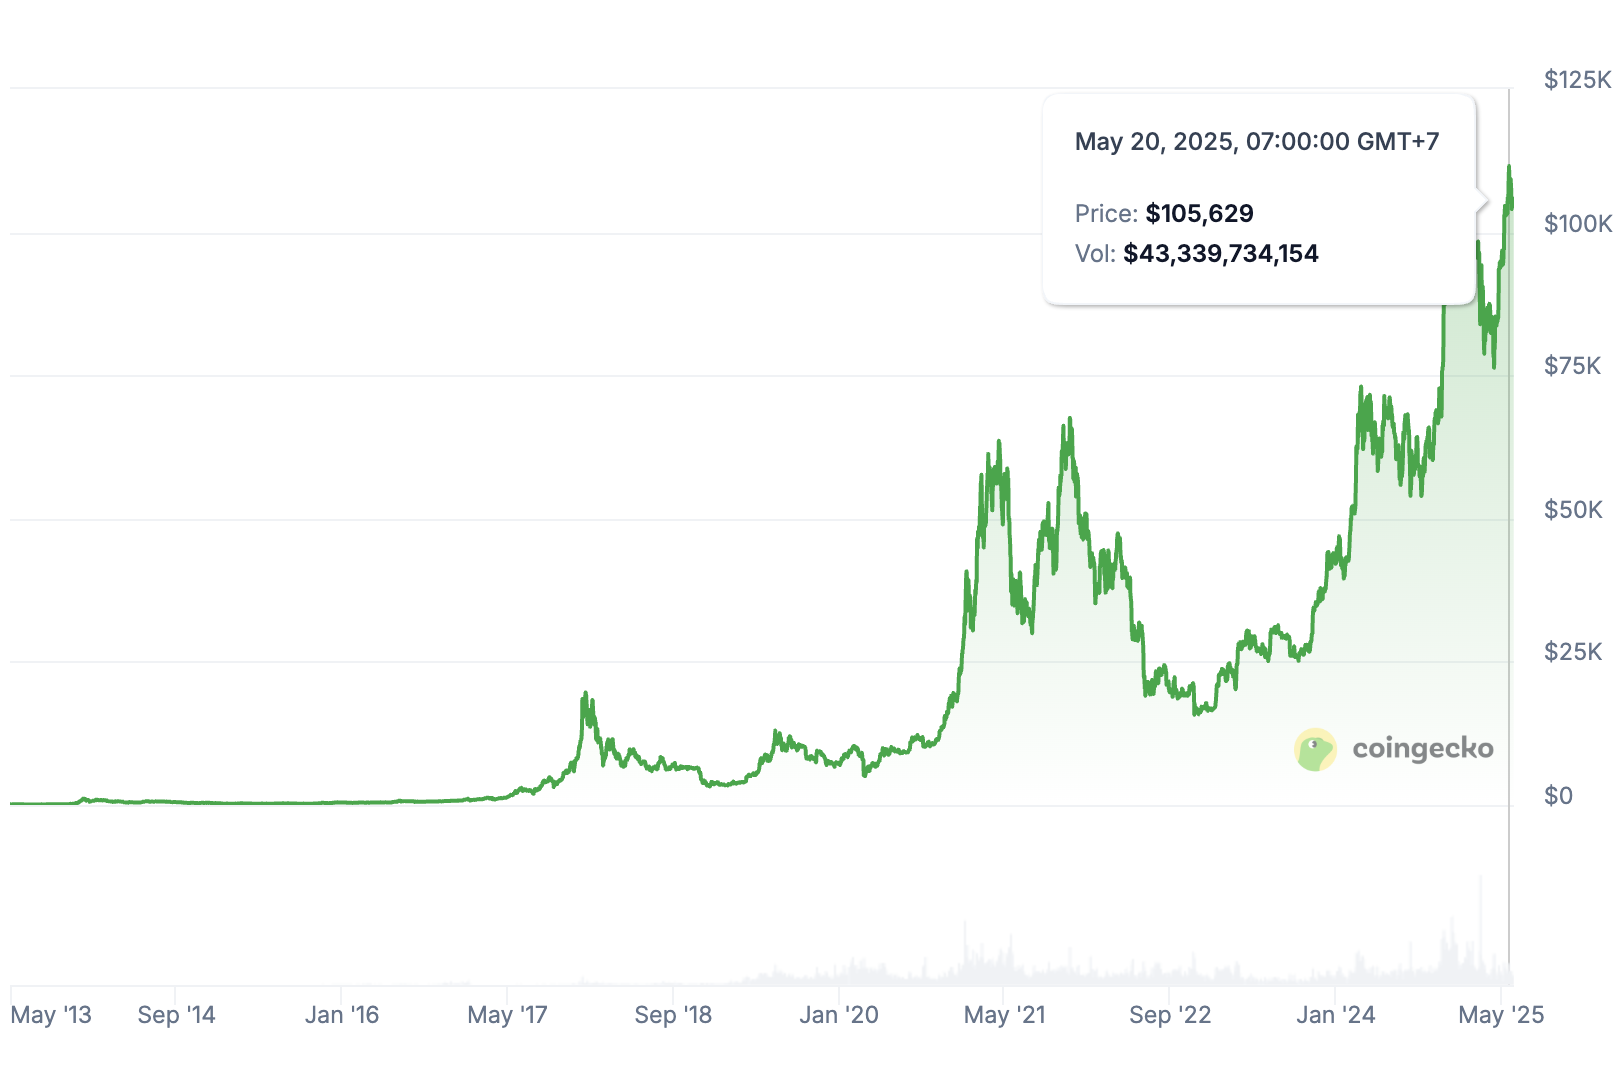
Traders often analyze Bitcoin prices and its dominance concurrently to reach trading outcomes. When both dominance and prices go up, a bull market might be brewing.
Dropping prices and rising dominance might be bear market signals. Finally, if both indicators drop, a larger bearish trend followed by sideways movements can be around the corner. Let’s take a historical example.
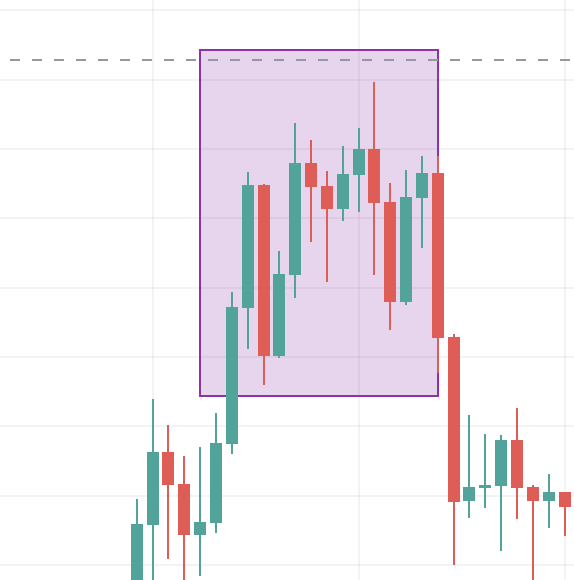
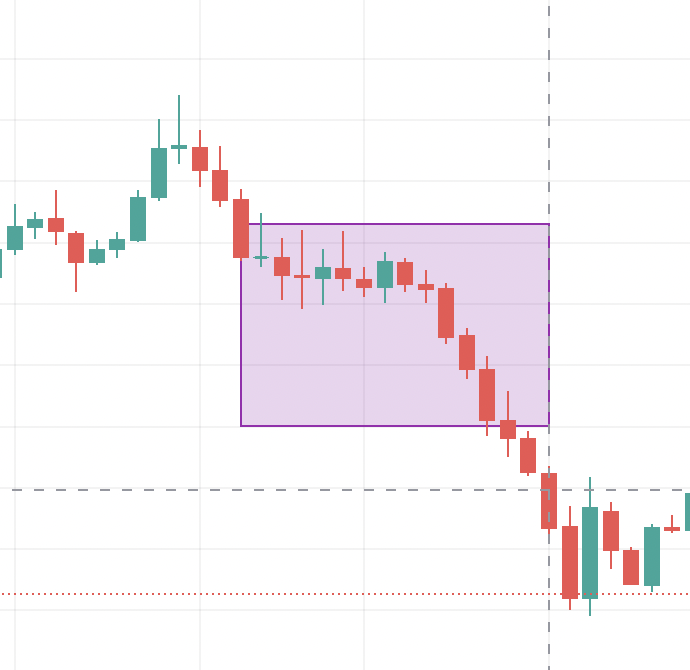
The above chart shows the peak BTC price action between January 2021 and May 2021. In response, the BTC Dominance Chart traded flat and even dropped at the end of the mentioned period.
If you look closely, you will see that after the highlighted region, both the dominance and price started dropping, resulting in new BTC price lows. A larger bear trend engulfed the market until July 2021.
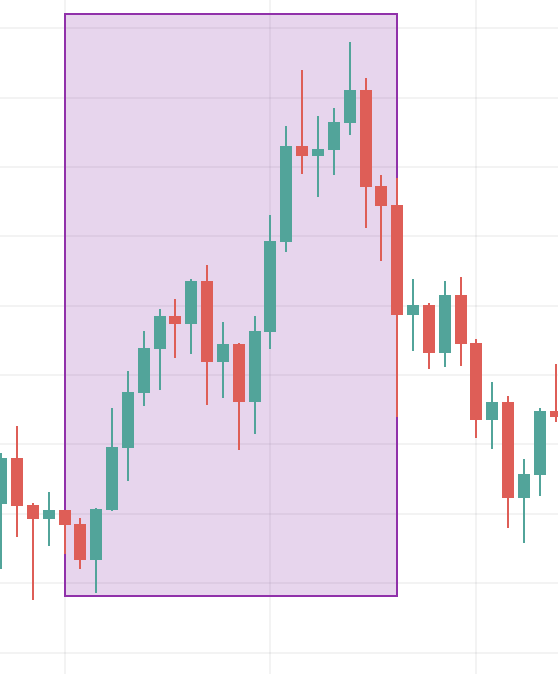
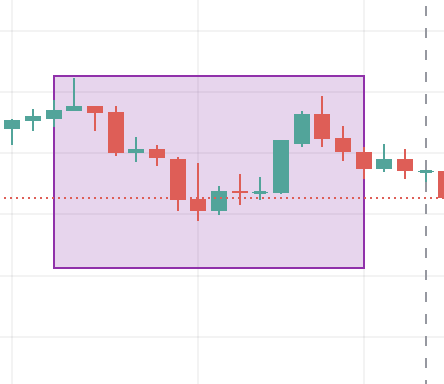
Lastly, rising prices and dropping dominance works as other indicators. It shows that BTC prices are increasing despite the index dropping, meaning that the move at the altcoin counters is more aggressive.
Here is what happened post-July 2021:
Here are a few tables with some combinations to help you make the right choices:
Case 1: BTC dominance is growing
| BTC Price | Trading action (possible) |
| Up | Favor BTC |
| Down | Hold on to fiat (Bearish waves) |
| Sideways | Hold on to fiat/BTC (Choppy markets) |
Case 2: BTC dominance is declining
| BTC Price | Trading action (possible) |
| Up | Favor altcoins |
| Down | Hold on to fiat (Massive bearish waves) |
| Sideways | Favor altcoins (altcoin season building) |
Case 3: BTC dominance is sideways
| BTC Price | Trading action (possible) |
| Up | Favor BTC (outside money coming to BTC) |
| Down | Hold on to Fiat (Bearish waves) |
| Sideways | Hold on to Fiat/altcoins |
Is the Bitcoin Bominance chart a reliable indicator?
The BTC dominance chart is reliable if you have the bigger picture in mind. However, it misses the mark in the following areas:
- It doesn’t take the direct competitors into account but focuses on the entire market.
- Can be impacted by an increase in stablecoin popularity, which is a bit counterproductive considering that stablecoins aren’t as volatile as other altcoins.
- Doesn’t take lost BTCs into account (Bitcoins in inaccessible wallets).
- Every altcoin project is considered, even if it initially attracts a lot of investment and later turns out to be a scam.
Bitcoin Dominance is a handy trend analysis tool
Needless to say, BTC plays a central role in the crypto market. The Bitcoin Dominance Chart is a useful tool, albeit not the only one you should use. Yet, if you can read the dominance and prices together, gaining actionable insights becomes easier.
Disclaimer: This article is for educational purposes only and should not be considered investment advice. Always do your own research (DYOR).


