


Key Highlights For March 8, 2019
- The price of LBRY Credits (LBC) reached a high of $0.029 on Feb 23
- It made a low of $0.023 on Mar 4
- It is trading inside an ascending triangle
- There is some bullish divergence in the RSI
- There is support near $0.023
- There is resistance near $0.0255, $0..0266 and $0.0286
Ascending Support Line
The price of LBC on Bittrex is analyzed at 30-minute intervals from Mar 4 to Mar 8.
The price made a low of $0.023 on Mar 4. A gradual upward move started. Several rises and dips followed with each dip representing a higher low than the last.
Connecting these successive highs gives us the ascending support line.
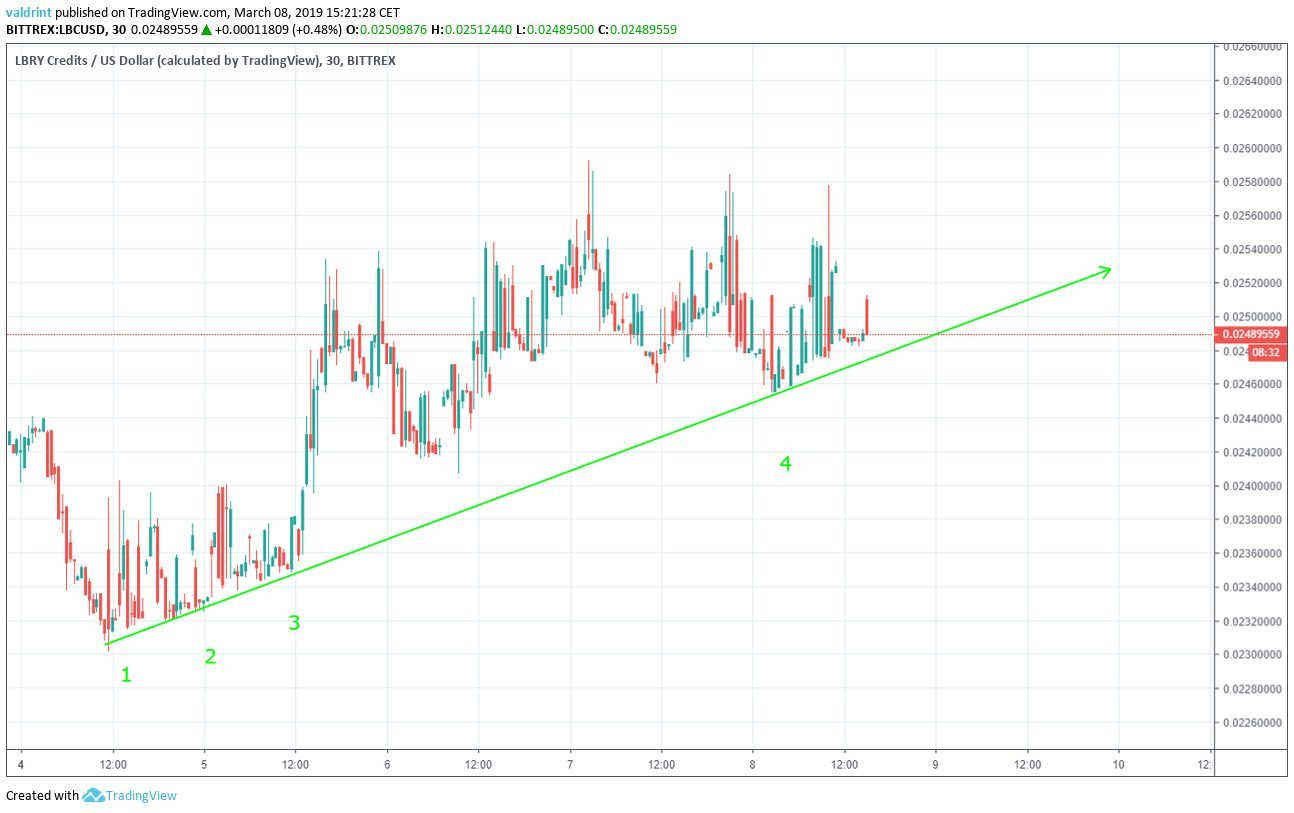
The dates in which the line was touched are:
- Mar 4
- Mar 5 (twice)
- Mar 8
The support line can act as a floor to price, preventing further downward movement. However, a break below could trigger a rapid price decrease. This does not appear likely.
Price has been trading higher than the support since Mar 4. It has not dipped below the line once during this tie. At the current time, price is continuing to grow at a slightly faster rate than that predicted by this support.
Creating The Triangle
The price first reached $0.0253 on Mar 5. It returned to this same value five more times over the next several days. Connecting these highs creates a horizontal resistance line.
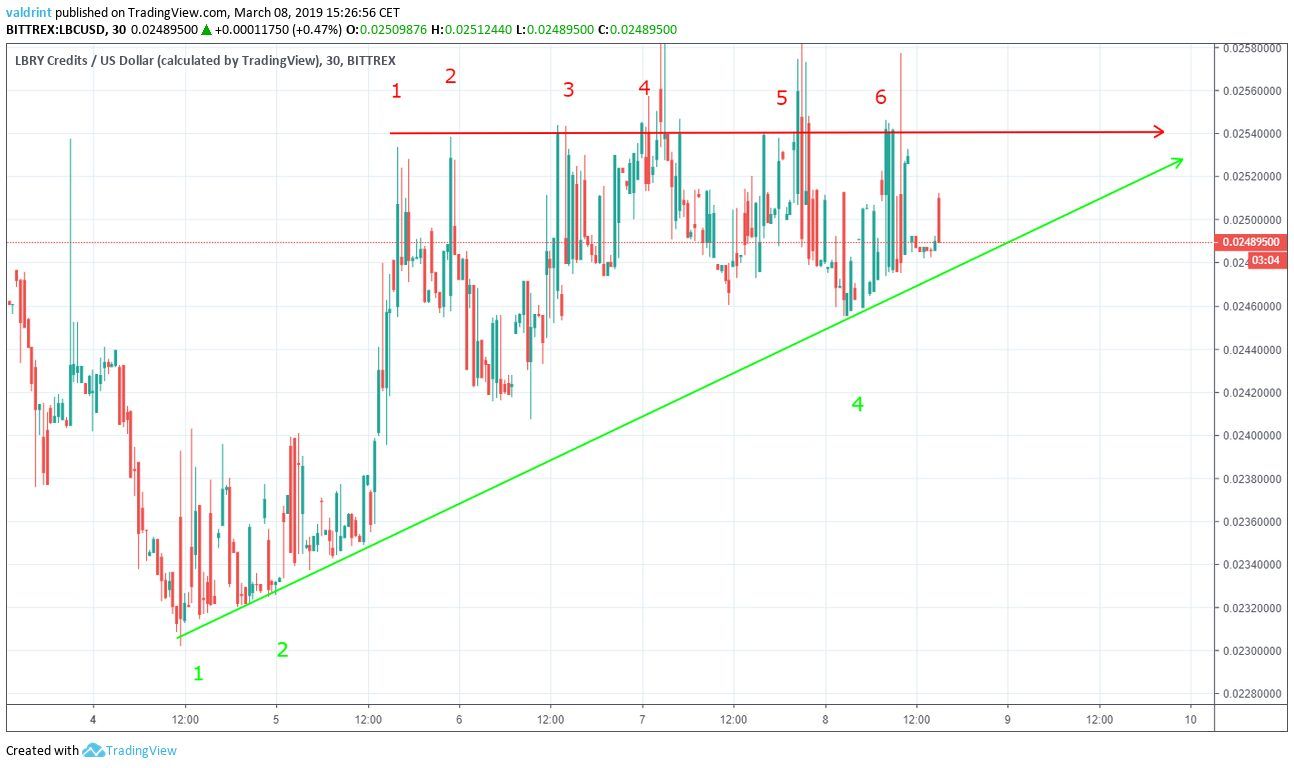
The dates on which the line was touched are:
- Mar 5 (Twice)
- Mar 6
- Mar 7 (twice)
- Mar 8
The horizontal line can act as a ceiling to price, preventing further upward movement.
The breakout above the line by a wick in a volatile market is relatively unimportant as long as it is not suceeded by continued breakouts. While there have been several highs above the resistance since Mar 5, such increases were not sustained for long periods of time.
Within several hours at the most, the price dipped back down below the resistance and back into the ascending triangle. Steady or maintained prices increases beyond the resistance are not expected. However, the ascending triangle is a bullish pattern—suggesting continued price increases at or above the rate predicted by the support.
As prices continue to increase, the price of LBC may continue trading within this triangle until a point of convergence between the resistance and support. At that time, price will be forced to either breakout or breakdown. With the current upward trend, a breakout appears more likely.
Bullish Divergence
The relative strength index (RSI) is an indicator which calculates the size of the changes in price in order to determine oversold or overbought conditions in the market. Combining RSI bullish/bearish divergence with support/resistance essentially predicts price fluctuations.
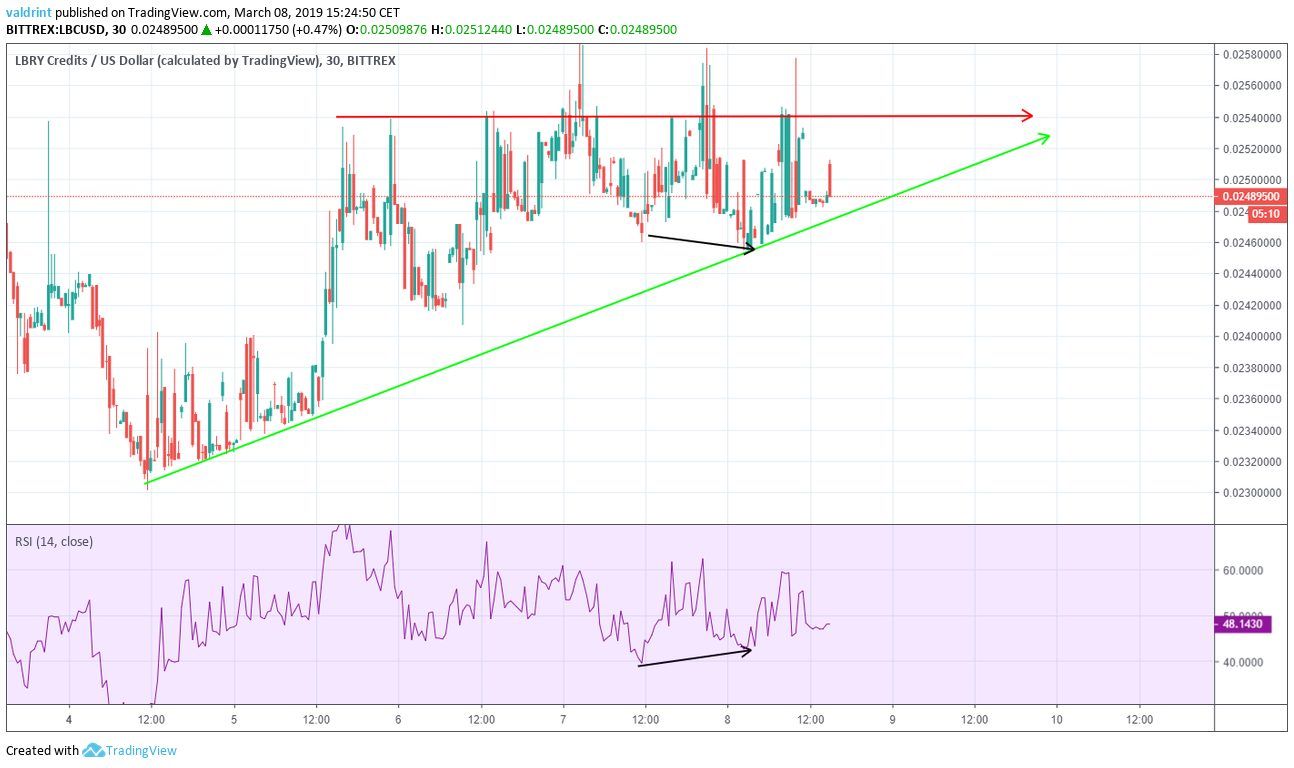
The price made a low of $0.0246 on Mar 7. It made a lower low of $0.0245 on Mar 8. The RSI made a low on Mar 7; however it made a lower high on Mar 8.
This is called bullish divergence, it often precedes breakouts in price. Nonetheless, the amount of divergence, in this case, is not very significant.
While a breakout remains possible, it’s not incredibly likely. Furthermore, breakouts which do occur are likely to return into the triangle. This has been the pattern with other recent breakouts.
Previous Breakout
To further investigate the possibility of maintained price increases, the price of LBC on Bittrex is analyzed at one-hour intervals from Feb 24 to Mar 8.
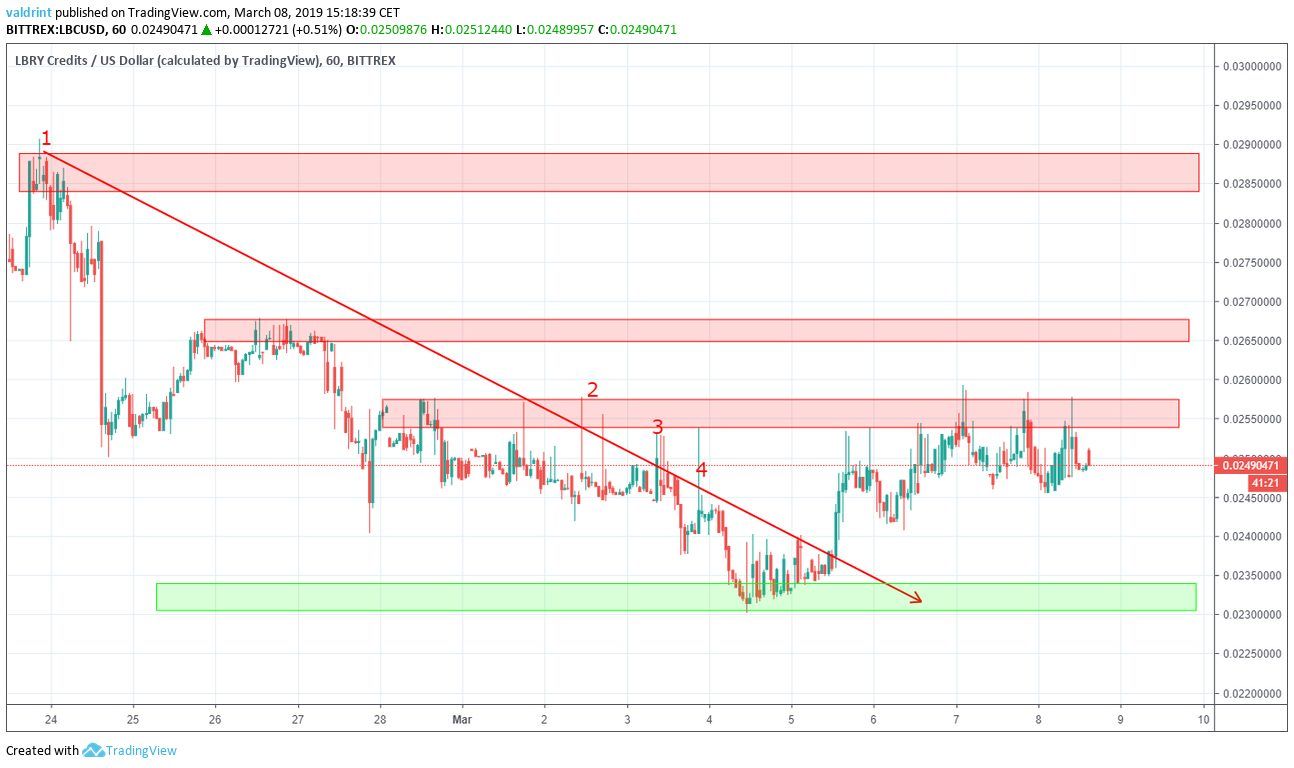
The price made a high of $0.029 on Feb 24. A gradual drop ensued. Price made lower highs since.
Tracing these highs gives us the descending resistance line. The dates on which the line was touched are:
- Feb 24
- Mar 2
- Mar 3
- Mar 4
The price broke out of the resistance line three times between Mar 3 and 4. Each time, a dip followed bringing the price back beneath the resistance. However, on Mar 5, price broke the resistance and did not return.
A new resistance emerged. Currently, There are resistance areas near $0.0255, $0.0266 and $0.0286.
There is a support area near $0.023.
Based on this analysis, a breakout to the second resistance area is more likely than a drop to the support area. If the price consolidates inside the first resistance area, this prediction would be partially validated. If it moves inside the second resistance area, it would be fully validated.
Where do you think the price of LBC will come to a stop? Let us know in the comments below.
Disclaimer: This article is not trading advice and should not be construed as such. Always consult a trained financial professional before investing in cryptocurrencies, as the market is particularly volatile.


