


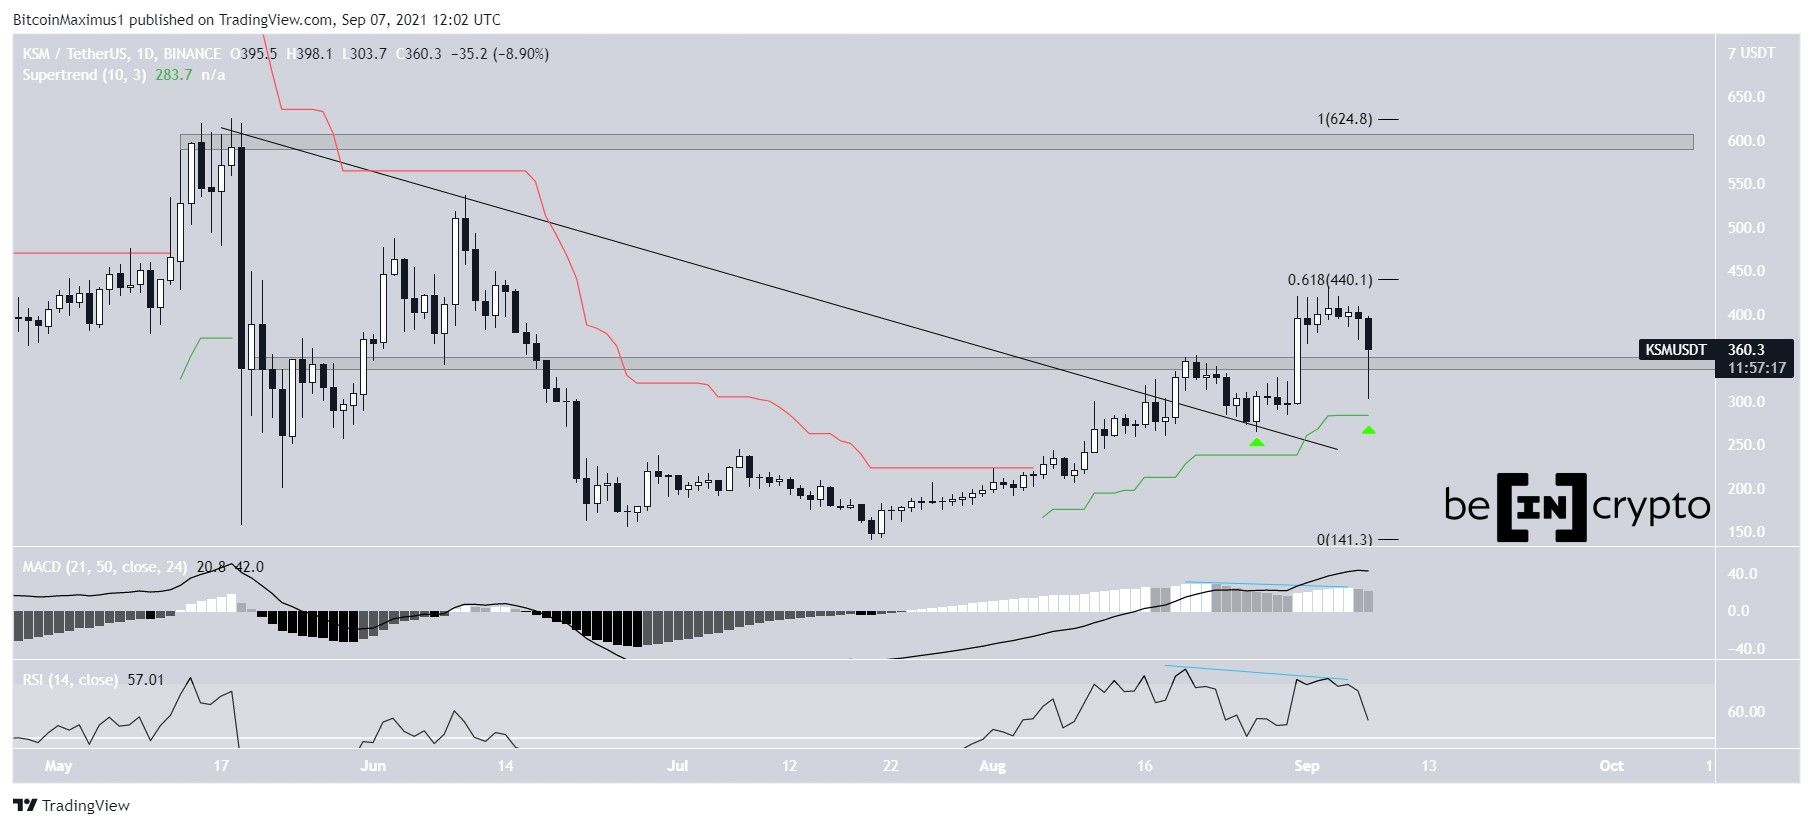
Kusama (KSM) has broken out from a long-term descending resistance line, but has yet to move above the 0.618 Fib retracement resistance level at $440.
Despite the rejection, the token is following an ascending support line and trading above short-term support. Therefore, the bullish structure is still intact.
KSM breaks out
KSM had been decreasing alongside a descending resistance line since May 18. At the time, it was trading at $625, which is still the all-time high price.
On Aug. 19, the token broke out. However, it decreased in order to validate the line as support on Aug. 27 (green icon).
The ensuing upward movement took it to a high of $431 on Sept. 3. However, the token was rejected by the 0.618 Fib retracement resistance level and has been moving downwards since. The decrease was preceded by bearish divergence in both the RSI and MACD.
However, KSM has bounced at the $345 horizontal support area and the Supertrend line. So far, it has created a long lower wick.
As long as it is trading above this level, the bullish structure remains intact.
If a movement above the $440 area were to occur, the next resistance would be found at $600.
Short-term movement
Cryptocurrency trader @TradingTank outlined a KSM chart, stating that the breakout from the current symmetrical triangle can lead to much higher prices.
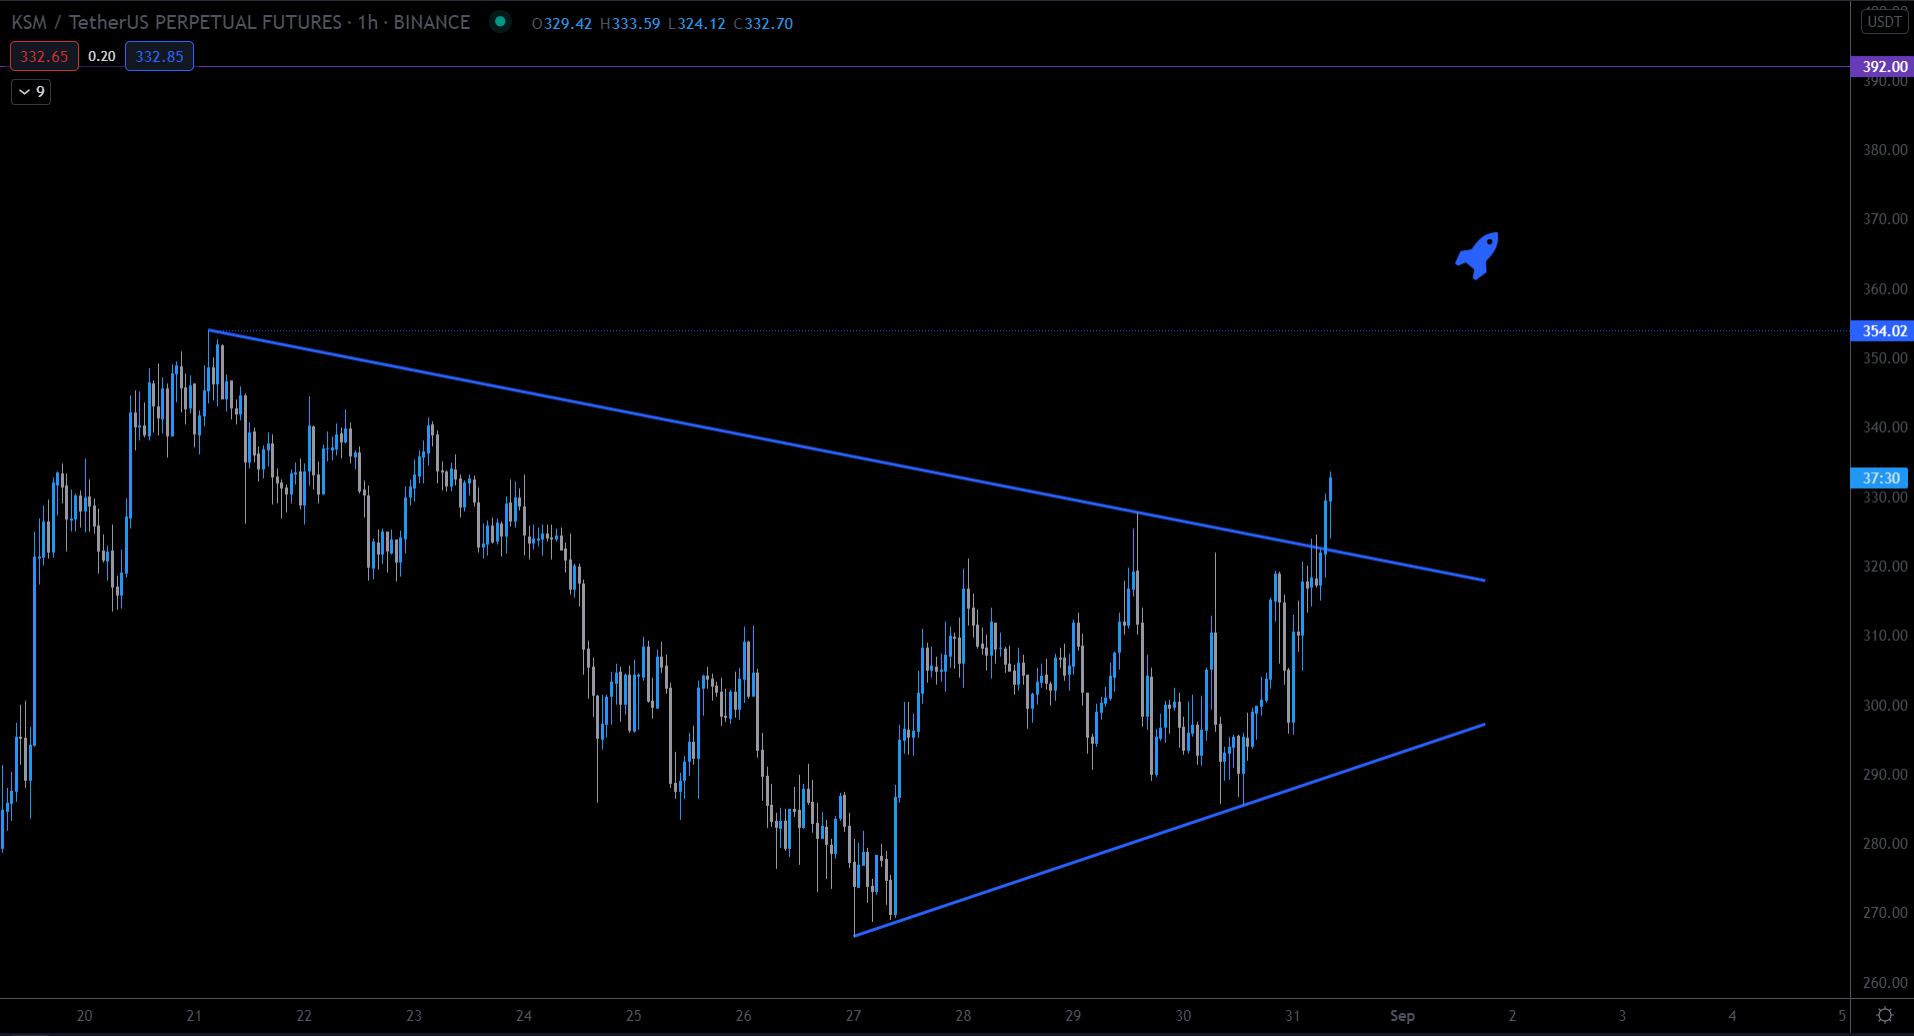
Since the tweet, the token has broken out from the triangle and reached the aforementioned $431 high.
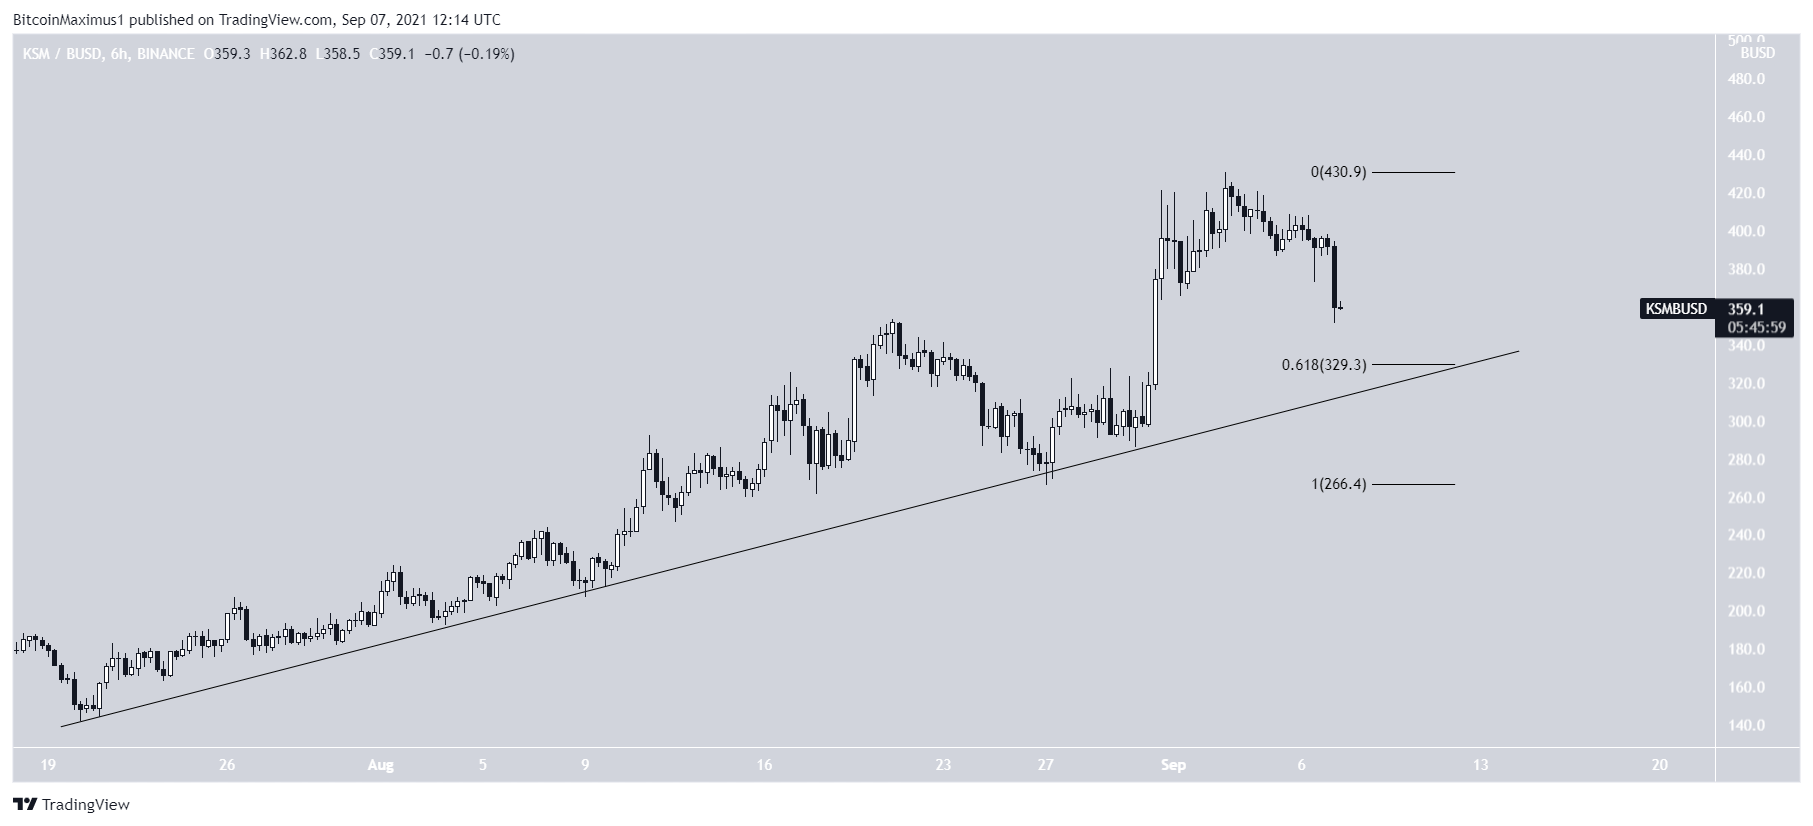
Despite the current rejection, KSM is still following an ascending support line. The line currently coincides with the 0.618 Fib retracement support level at $330.
Therefore, this is a strong confluence of support levels near $330, also coinciding with the previously outlined horizontal area.
This suggests KSM is expected to bounce if it gets there.
For BeInCrypto’s latest Bitcoin (BTC) analysis, click here.


