


BeInCrypto takes a look at five projects that beat the crypto market last week, more specifically, from Oct. 21 to Oct. 28.
These digital assets have taken the crypto news and crypto market spotlight:
- Klaytn (KLAY) price is up 91.11%
- Dogecoin (DOGE) price is up 40.52%
- Theta Network (THETA) price is up 19.19%
- Toncoin (TON) price is up 18.53%
- Cosmos (ATOM) price is up 17.99%
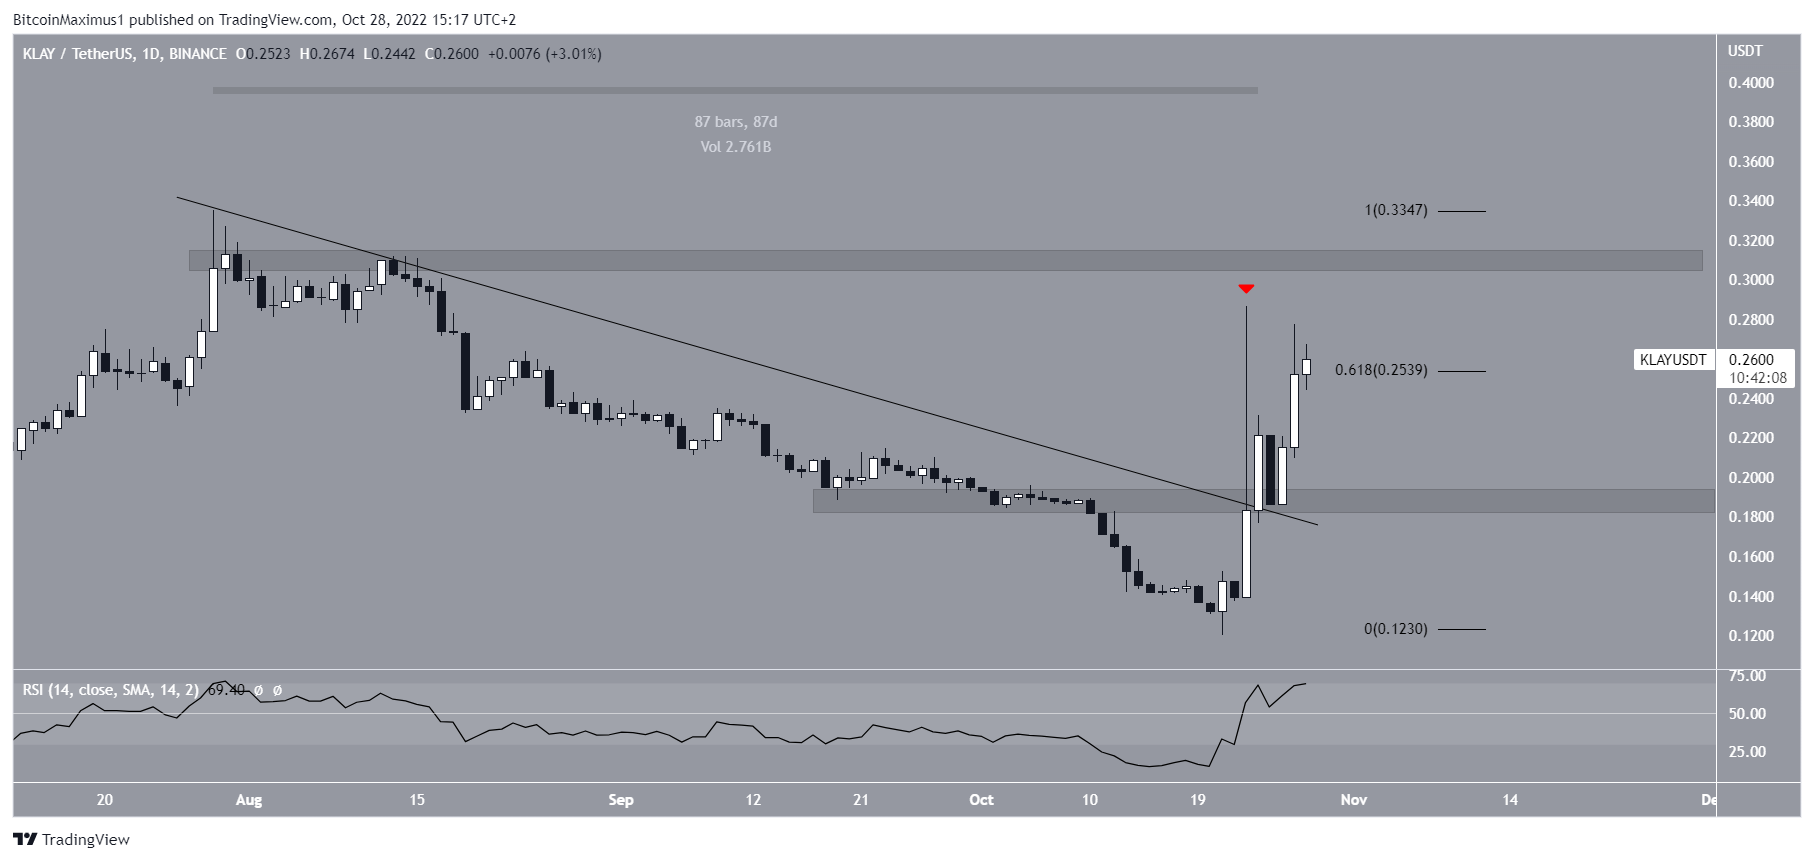
KLAY Price Prediction: Break Out From 87-Day Resistance
KLAY had been decreasing underneath a descending resistance line since reaching a high of $0.334 on July 29. After two unsuccessful attempts, the KLAY price broke out from the line on Oct. 24.
The same day, the price increased and reached a high of $0.293. However, it failed to sustain the upward movement and created a long upper wick instead. After a brief retracement, the KLAY price initiated another upward movement and is approaching its Oct. 24 highs.
Currently, it is attempting to break out from the 0.618 fib retracement resistance level at $0.254. Whether it is successful in doing so or gets rejected will likely determine the direction of the future price trend.
In the case of a breakout, KLAY would be expected to increase towards the next resistance at $0.310. In case of a rejection, a price fall towards $0.192 would be likely.
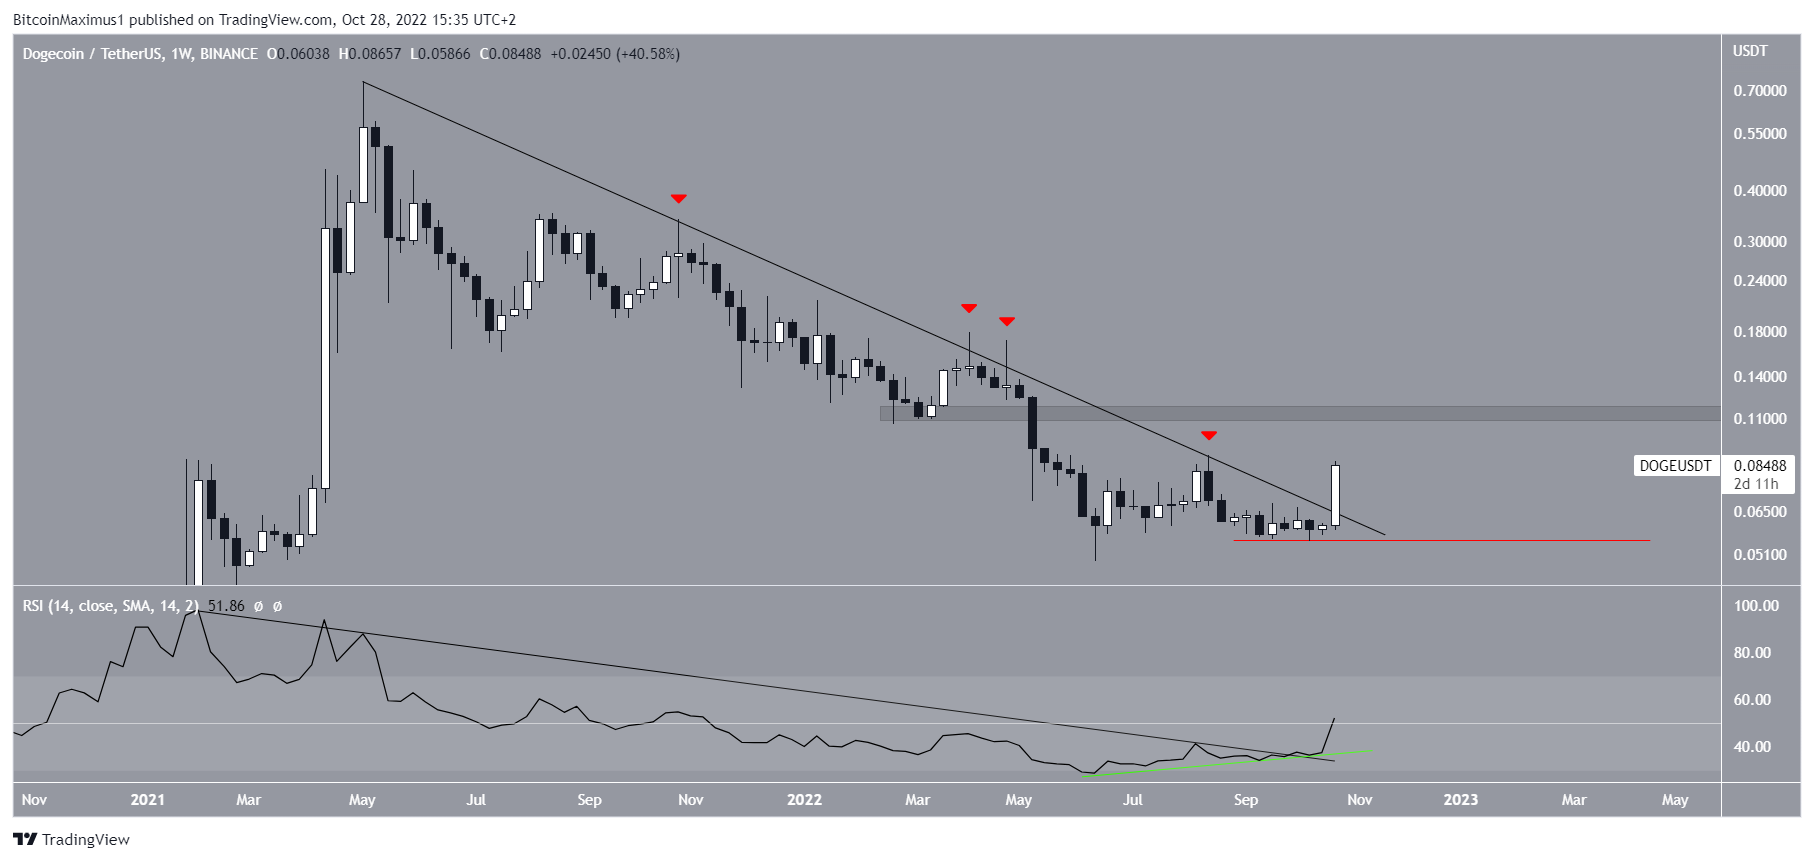
DOGE Price Prediction: Long-Term Correction Completed
The market data shows that DOGE price had been decreasing underneath a descending resistance line since reaching an all-time high price of $0.740 in May 2021. After four unsuccessful attempts, the Dogecoin price broke out from the line amid a massive bullish candlestick.
At the same time, the weekly RSI of the crypto market broke out from its own bearish trend line after generating bullish divergence (green line).
If the upward movement continues, the closest resistance area would be at $0.115. Conversely, a decrease below the pre-breakout levels (red line) of $0.055 would mean that new lows are expected.
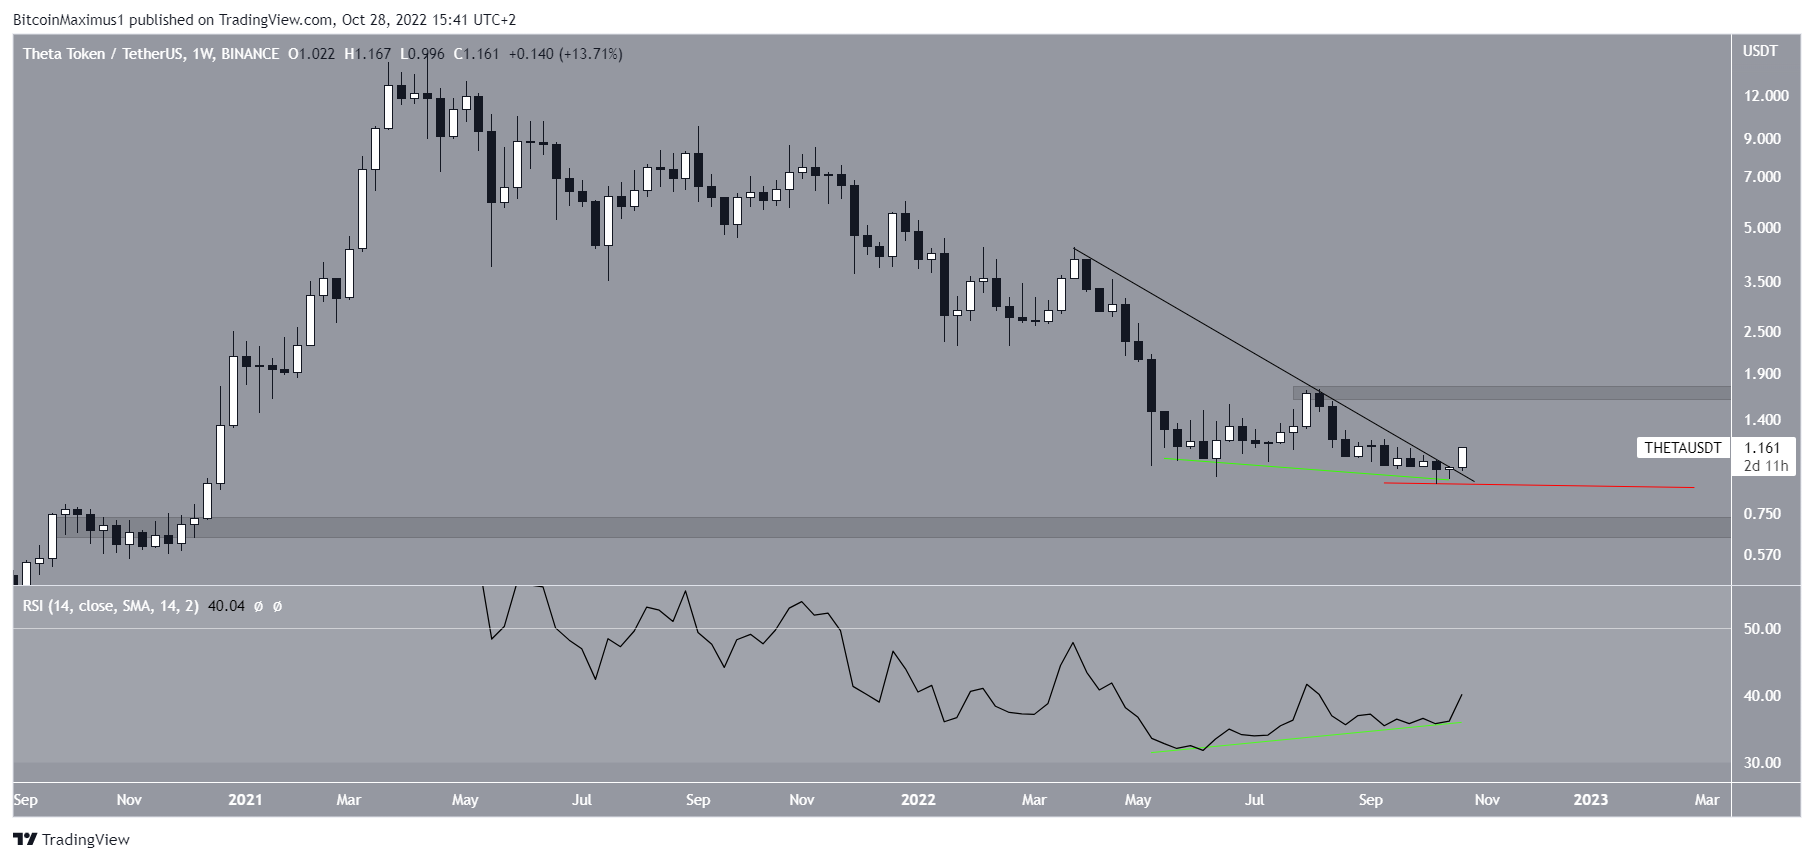
THETA Price Prediction: Double Bottom Pattern Completed
The THETA price had been falling underneath a descending resistance line since March 2022. However, it started creating a double bottom pattern in the beginning of June. Besides being considered a bullish pattern, the double bottom was combined with bullish divergence in the weekly RSI (green line).
Currently, the THETA price is in the process of breaking out from the line. If the upward movement continues, the closest resistance area would be at $1.680.
Conversely, a decrease below pre-breakout levels at $0.911 would take the THETA price towards $0.680.
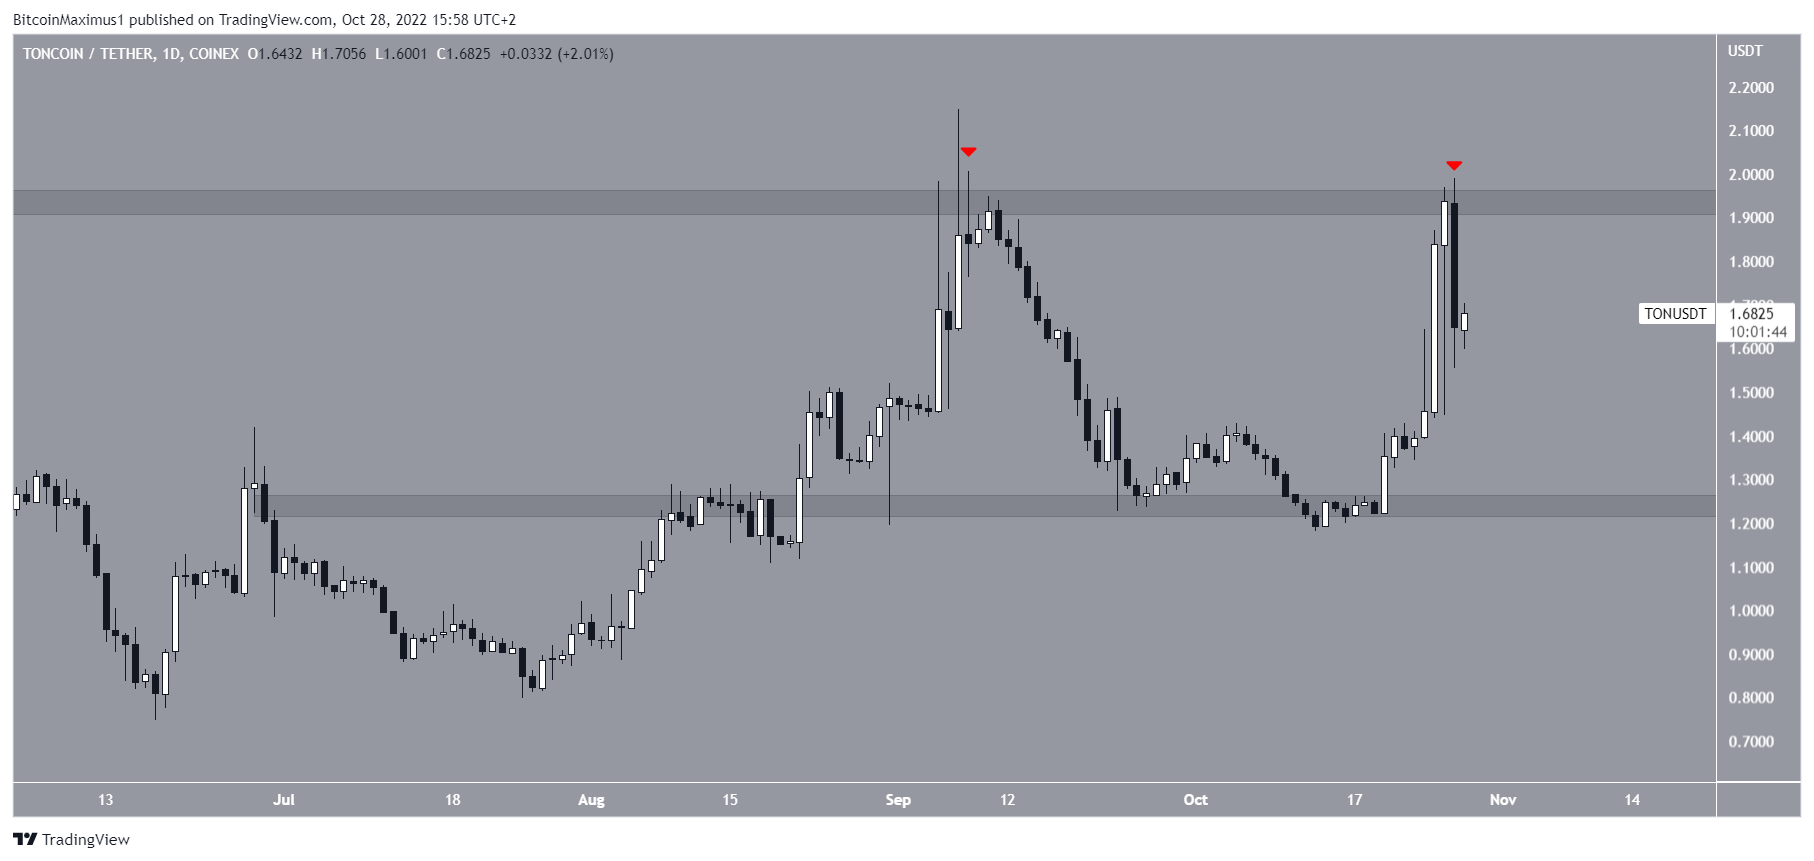
TON Price Prediction: Attempt Made at Breakout Above $1.94
The TON price has been moving upwards at a rapid pace since Oct. 20, when it bounced at the $1.25 horizontal support area. However, it failed to break out from the $1.94 resistance area, instead creating a double top pattern and a bearish candlestick.
Due to the rejection and creation of a bearish candlestick, a decrease toward the $1.25 horizontal area seems to be the most likely scenario for TON price.
On the other hand, a daily close above the $1.94 resistance area would mean that the trend is bullish instead, and that new highs in the crypto market will follow.
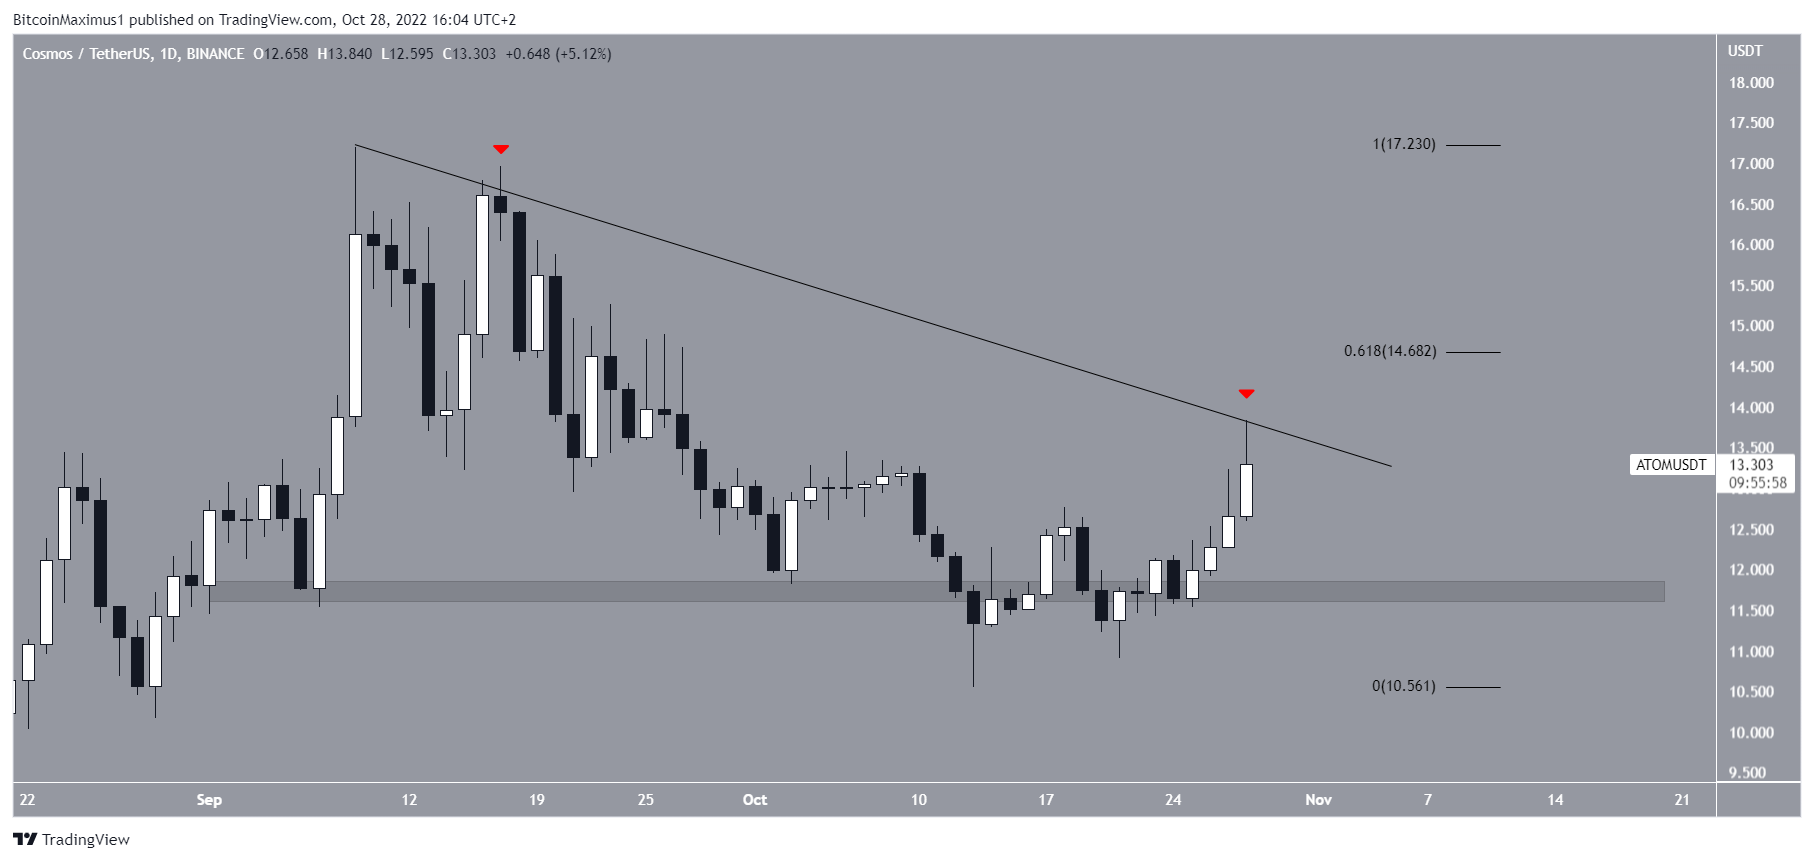
ATOM Price Prediction: Reaches Resistance Line
ATOM price had been decreasing below a descending resistance line since reaching a high of $14.149 on Sept. 8. Currently, it is in the process of making the second attempt at breaking out (red icon).
Whether ATOM price breaks out from the line or gets rejected will likely determine the direction of the future trend. A breakout would take the ATOM price toward $14.682, while a rejection would likely cause a fall toward $11.710.
For the latest BeInCrypto Bitcoin (BTC) and crypto market analysis, click here
Disclaimer: BeInCrypto strives to provide accurate and up-to-date information, but it will not be responsible for any missing facts or inaccurate information. You comply and understand that you should use any of this information at your own risk. Cryptocurrencies and the crypto market are highly volatile financial assets, so research and make your own financial decisions.
