See More

KLAY, CHZ, XEC, ICP and RVN Fall as Fear Reigns Over Crypto Market

3 mins
Updated by Ali M.
Join our Trading Community on Telegram

In Brief

  • KLAY has fallen to a new all-time low
  • CHZ and ICP are following descending resistance lines
  • XEC has broken down from a symmetrical triangle
  • promo

BeInCrypto takes a look at the five digital assets in the crypto market that decreased the most last week, more specifically, from Oct. 7 to Oct. 14. These are the worst-performing cryptocurrencies in the crypto market in the past week: 
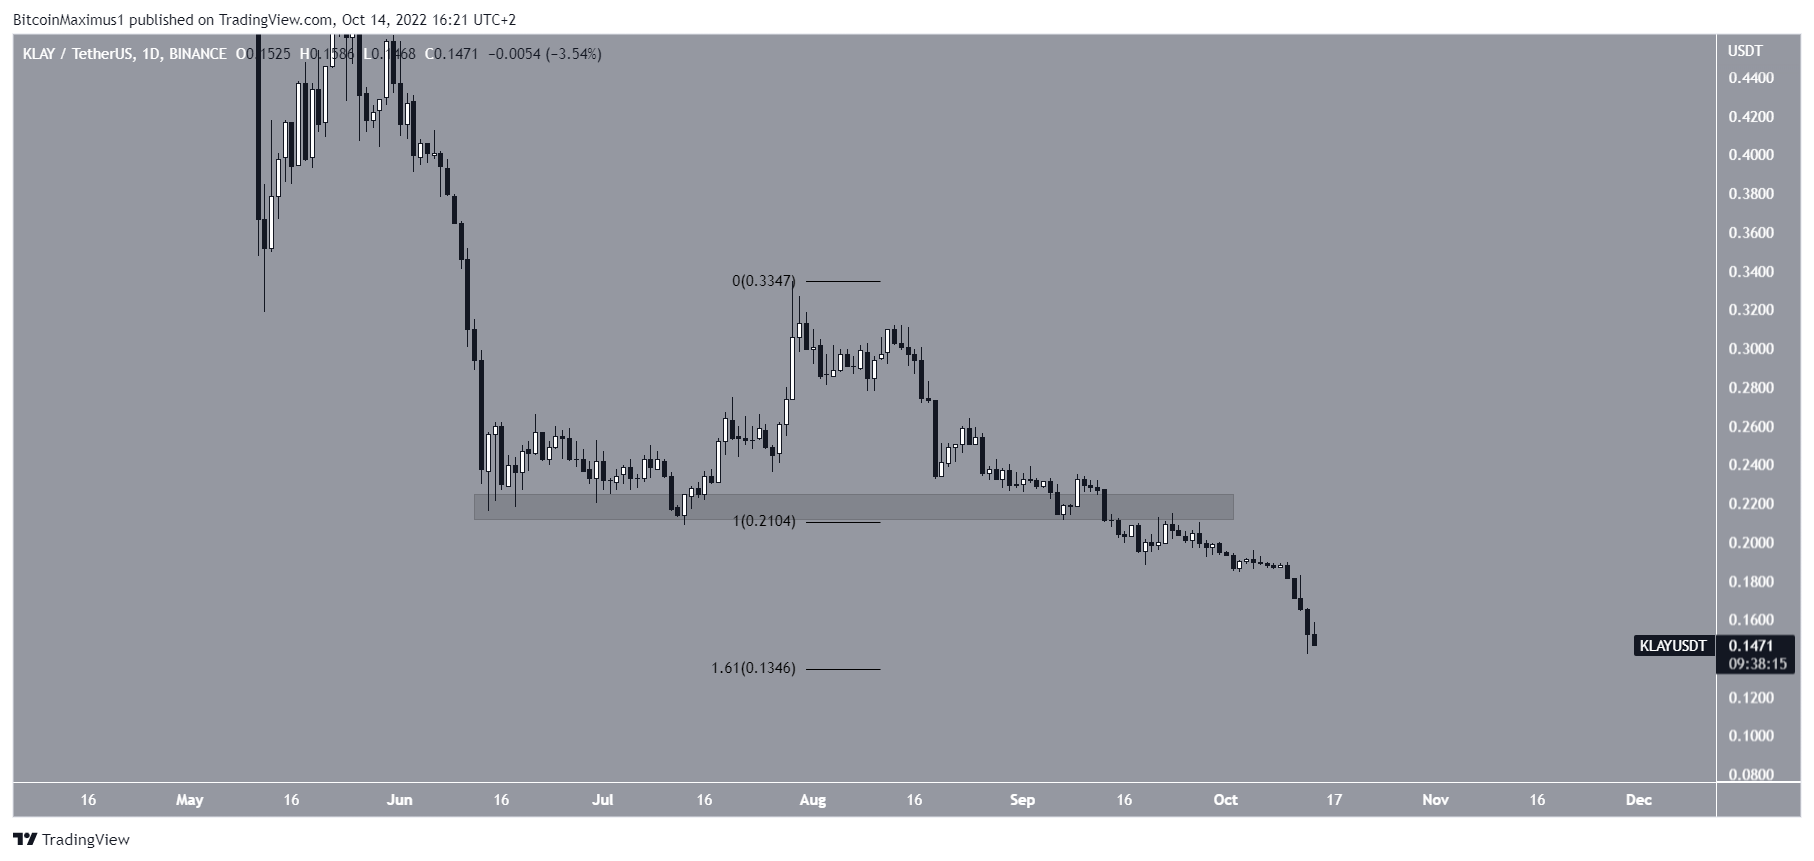
  1. Klaytn (KLAY) price is down -19.48%
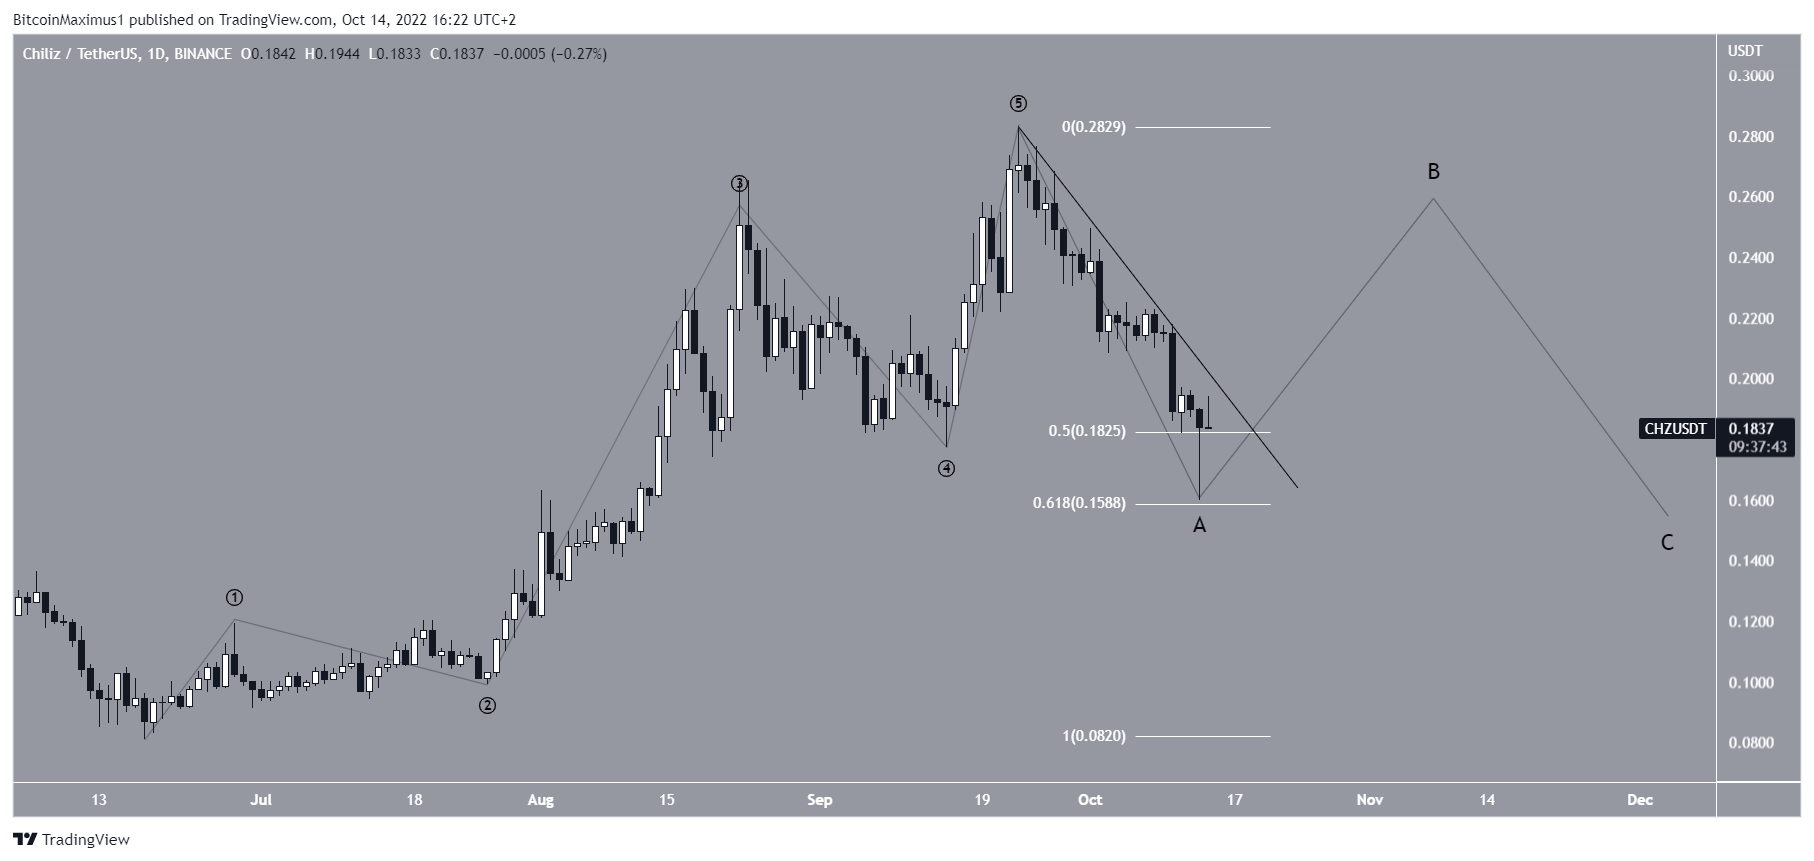
  2. Chiliz (CHZprice is down -14.51%
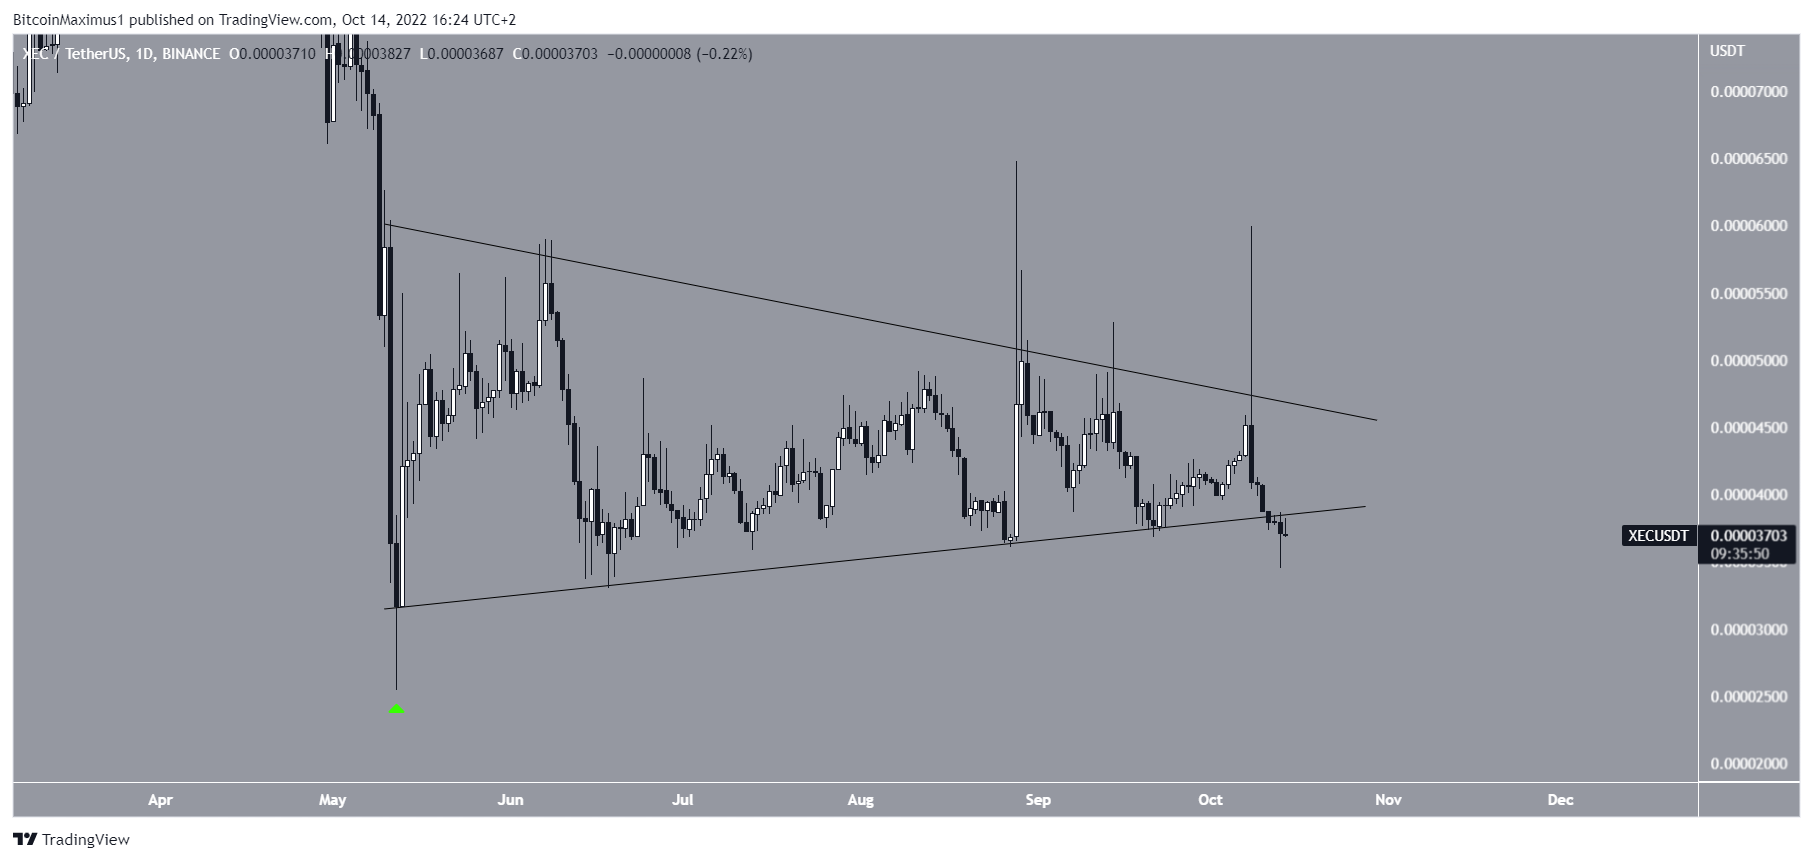
  3. eCash (XEC) price is down -13.68%
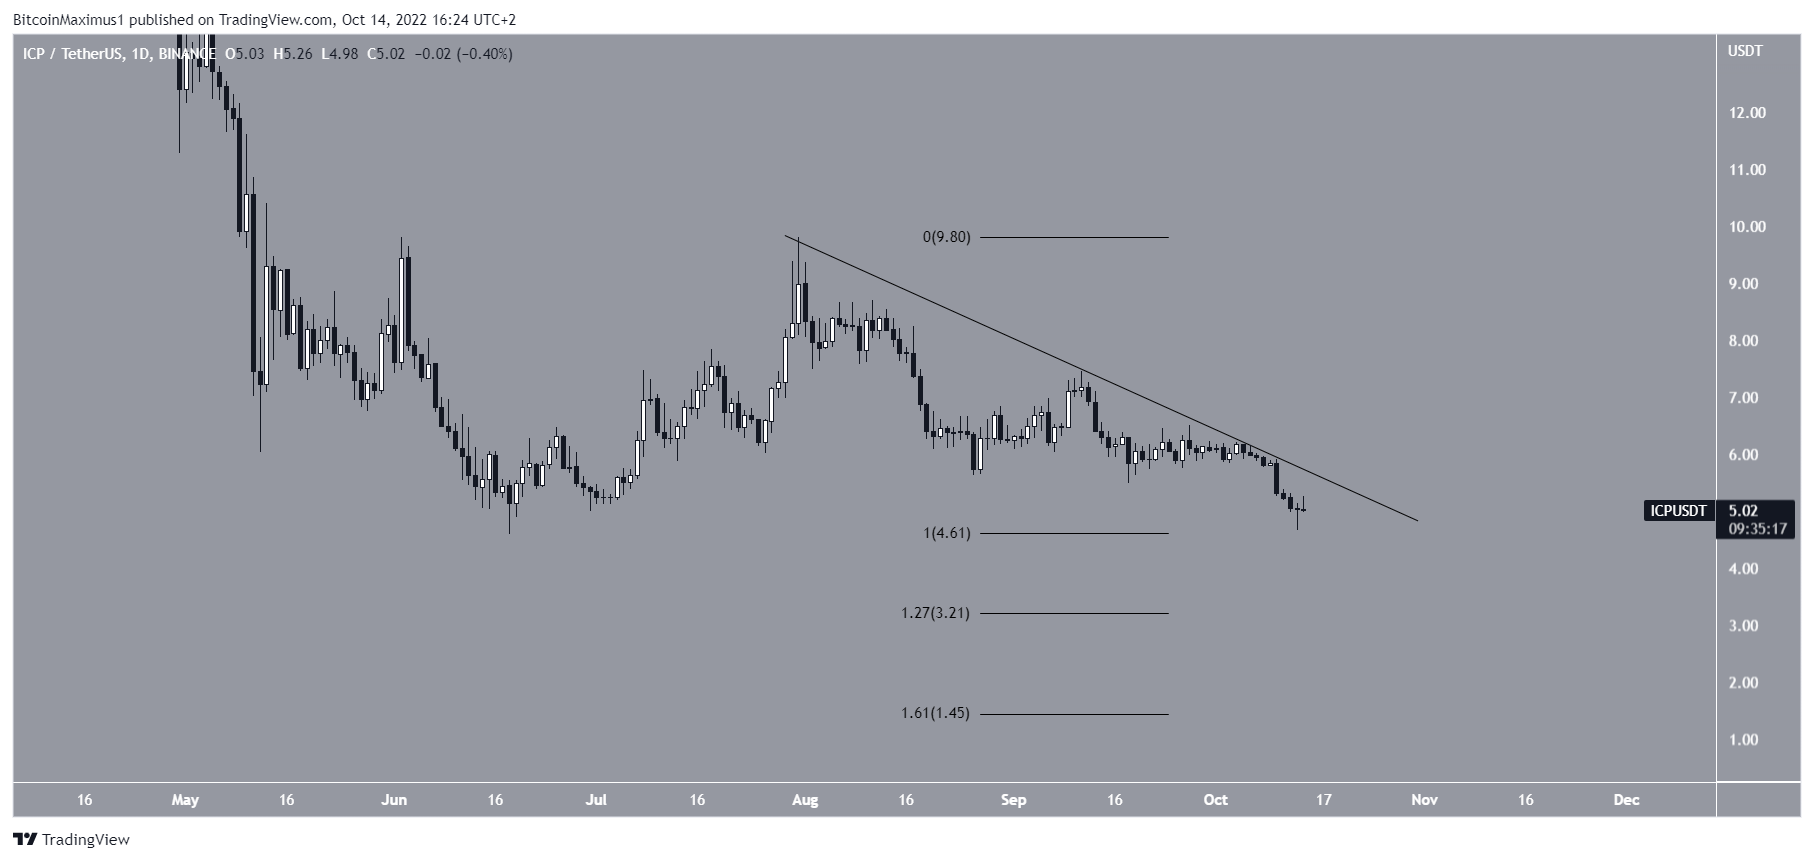
  4. Internet Computer (ICP) price is down -13.53%
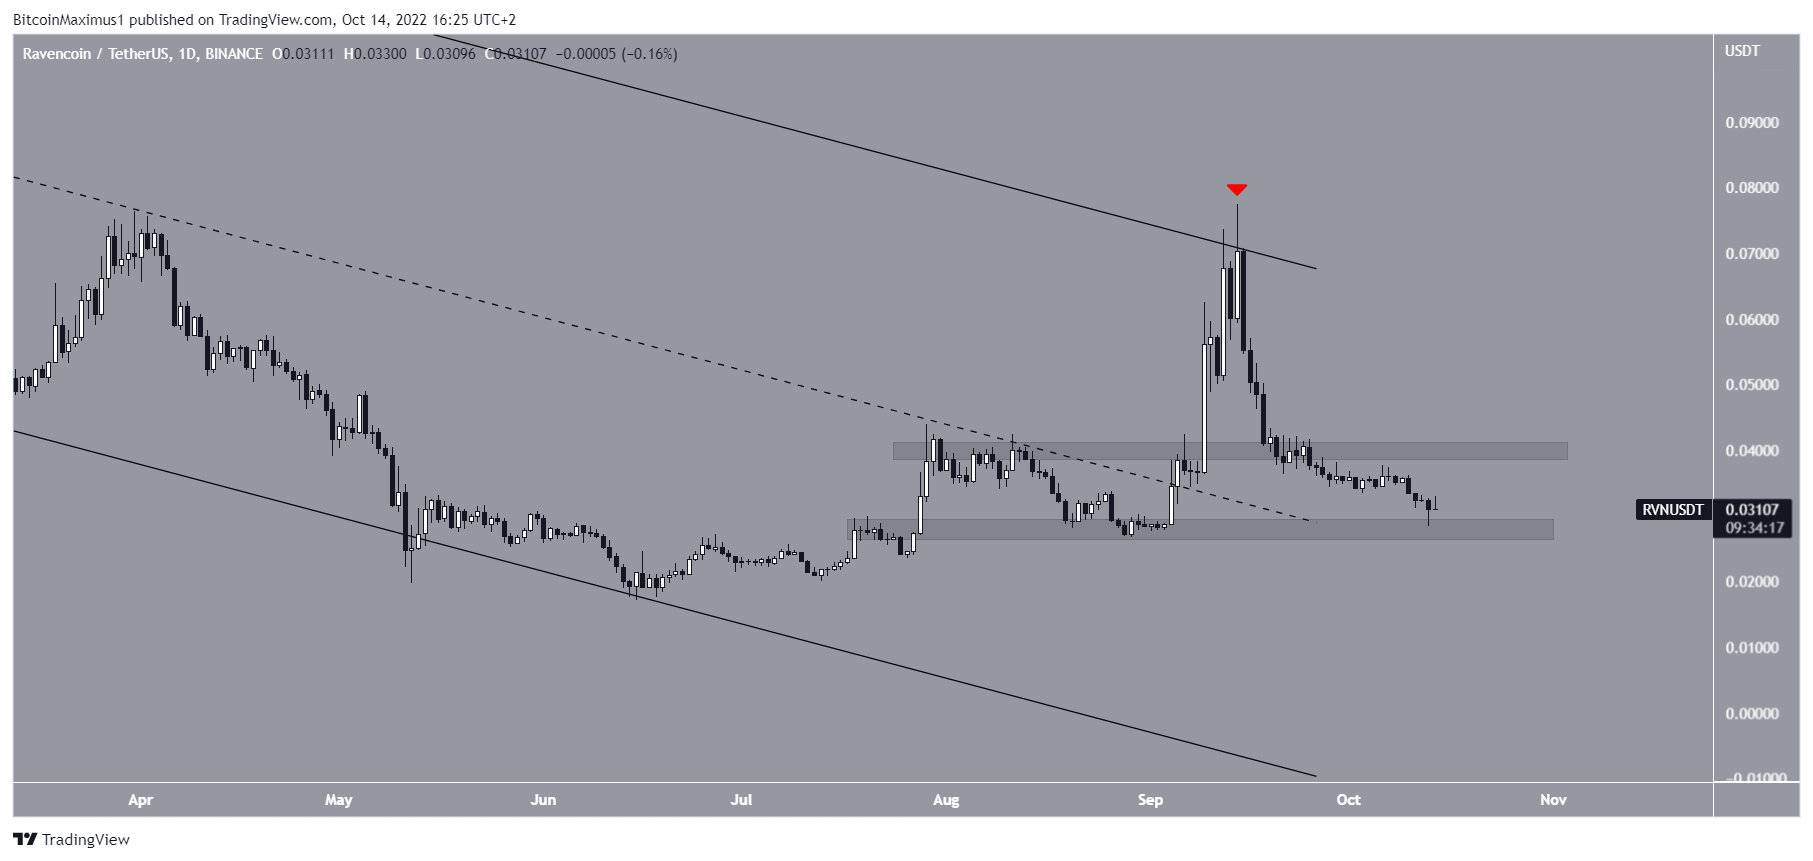
  5. Ravencoin (RVNprice is down -12.22%

Klaytn KLAY price dips further

KLAY price has been falling since reaching a high of $0.335 on July 29. Initially, Klaytn price bounced above the $0.225 horizontal support area, which acted as the all-time low support. Still, KLAY price broke down from the area on Sept. 14 and has been falling at an accelerated rate since with the rest of the crypto market. So far, KLAY price has reached a new all-time low of $0.142 on Oct. 13. The next closest support area is at $0.135, created by the 1.61 external Fib retracement of the most recent upward movement.
KLAY Fib level
Klaytn KLAY Price Chart. Source:TradingView

Chiliz CHZ price could bounce before lower lows

CHZ price began a five-wave upward movement on June 18. The move led to a new high of $0.282 on Sept. 23. Due to the severity of the ensuing fall that was also seen across the crypto market, it is likely that this was the top of the move. The ensuing decrease in Chiliz price has followed a descending resistance line and led to a low of $0.160 on Oct 13. The low was made very close to the 0.618 Fib retracement support level (white) at $0.158. CHZ price created a long lower wick, which is considered a sign of buying pressure. If CHZ price breaks out from the descending resistance line, it would confirm that the first part of the correction is complete, and the B wave (black) has begun.
CHZ Wave count
Chiliz CHZ Price Chart. Source: TradingView

eCash XEC price looks poised to retrace

XEC had been trading inside a symmetrical triangle since reaching a low of $0.000025 on May 12 (green icon). While symmetrical triangles are considered neutral patterns, they often provide continuation. Therefore, since the triangle is transpiring after a downward eCash price movement, an eventual breakdown from it is expected. On Oct. 12, XEC price finally reached a close below the support line of the channel, thereby confirming the breakdown. So, a downward XEC price movement toward the $0.000025 low is expected.
eCash XEC Price Chart crypto market
eCash XEC Price Chart. Source: TradingView

Internet Computer ICP price spells trouble

ICP price has been decreasing underneath a descending resistance line since reaching a high of $9.80 on July 31. The downward movement in Internet Computer price has so far led to a low of $4.67 on Oct. 13. Despite this sharp fall that was also seen across the crypto market, ICP price has yet to break down below its all-time low of $4.60. However, unless ICP price is successful in breaking out from the resistance line, the continuation of the downward movement seems likely. In this case, the next closest support levels would be $3.21 and $1.45. Since they would both constitute new all-time lows, they are found using an external Fib retracement on the most recent upward movement.
Internet Computer ICP Price Chart
Internet Computer ICP Price Chart. Source: TradingView

Ravencoin RVN price consolidates

RVN price has been falling since reaching a high of $0.075 on Sept. 14 (red icon) like the rest of the crypto market. The high was made at the resistance line of a long-term descending parallel channel. So far, it has led to a low of $0.028 on Oct. 13. The downward movement caused Ravencoin price to fall inside the horizontal range of $0.048-$0.028. Whether RVN price breaks out above the $0.040 range high or falls below the $0.028 range low will determine if another breakout attempt or a fall toward the support line of the channel is expected.
Ravencoin RVN Price Chart crypto market
Ravencoin RVN Price Chart. Source: TradingView
For BeInCrypto latest Bitcoin (BTC) analysis and crypto market analysis, click here Disclaimer: BeInCrypto strives to provide accurate and up-to-date information, but it will not be responsible for any missing facts or inaccurate information. You comply and understand that you should use any of this information at your own risk. Cryptocurrencies are highly volatile financial assets, so research and make your own financial decisions.
Top crypto projects in the US | April 2024

Trusted

Disclaimer

In line with the Trust Project guidelines, this price analysis article is for informational purposes only and should not be considered financial or investment advice. BeInCrypto is committed to accurate, unbiased reporting, but market conditions are subject to change without notice. Always conduct your own research and consult with a professional before making any financial decisions. Please note that our Terms and ConditionsPrivacy Policy, and Disclaimers have been updated.

Valdrin-Tahiri.jpg
Valdrin Tahiri
Valdrin discovered cryptocurrencies while he was getting his MSc in Financial Markets from the Barcelona School of Economics. Shortly after graduating, he began writing for several different cryptocurrency related websites as a freelancer before eventually taking on the role of BeInCrypto's Senior Analyst. (I do not have a discord and will not contact you first there. Beware of scammers)
READ FULL BIO
Sponsored
Sponsored