


The Kava.io (KAVA) price has been increasing since it bounced at an important support area at the beginning of Nov.
The price has broken out from a resistance line and is likely to move upwards in the short-term. The direction of the long-term trend is still unclear.
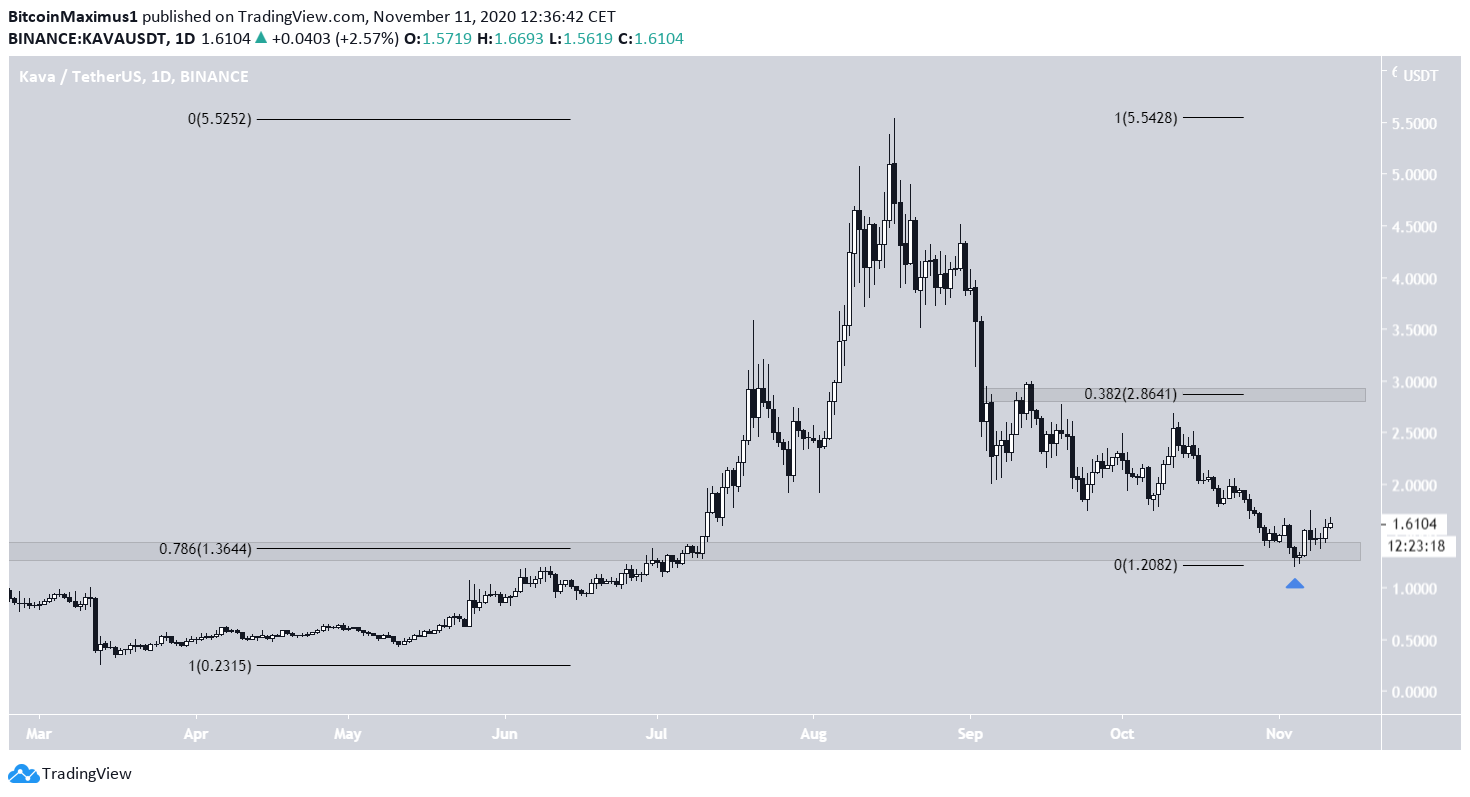
Bounce at Support
KAVA has been falling since it reached a high of $5.53 on Aug 17. The decline continued until the price reached the $1.35 support area at the beginning of Nov, briefly ending up with a low of $1.21 on Nov 4. KAVA has been rallying since.
If the price continues moving upwards and retraces the entire price decline, the closest significant resistance area is found at $2.86, the 0.382 Fib retracement level measured from the Aug 17 high.
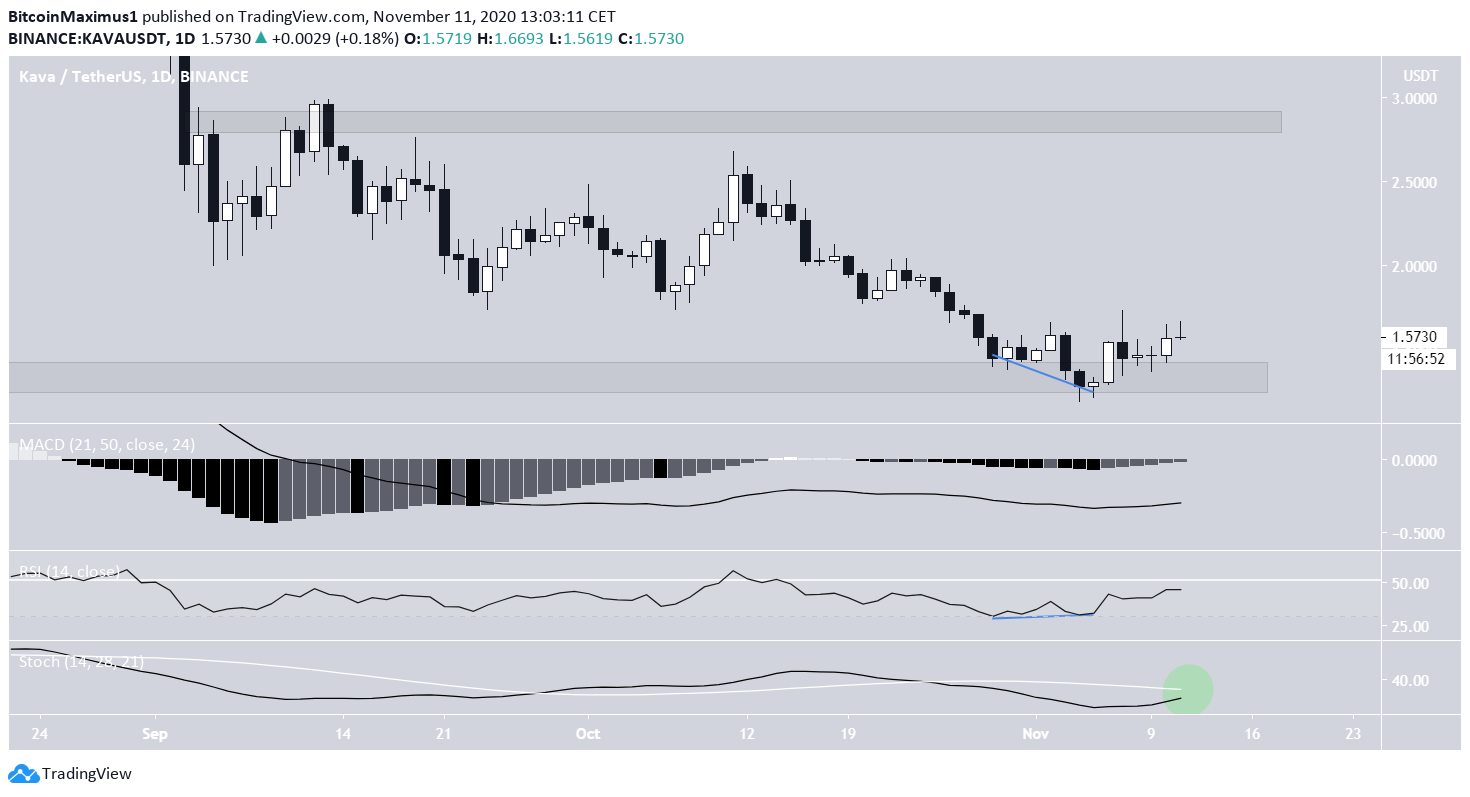
Technical indicators on the daily time-frame are bullish but have not yet confirmed the trend reversal. The RSI has formed bullish divergence and has begun to move upwards. The Stochastic Oscillator has yet to make a bullish cross, and the MACD is below 0.
Therefore, while a short-term bounce seems likely, we cannot yet state with certainty that the ongoing downward trend has ended.
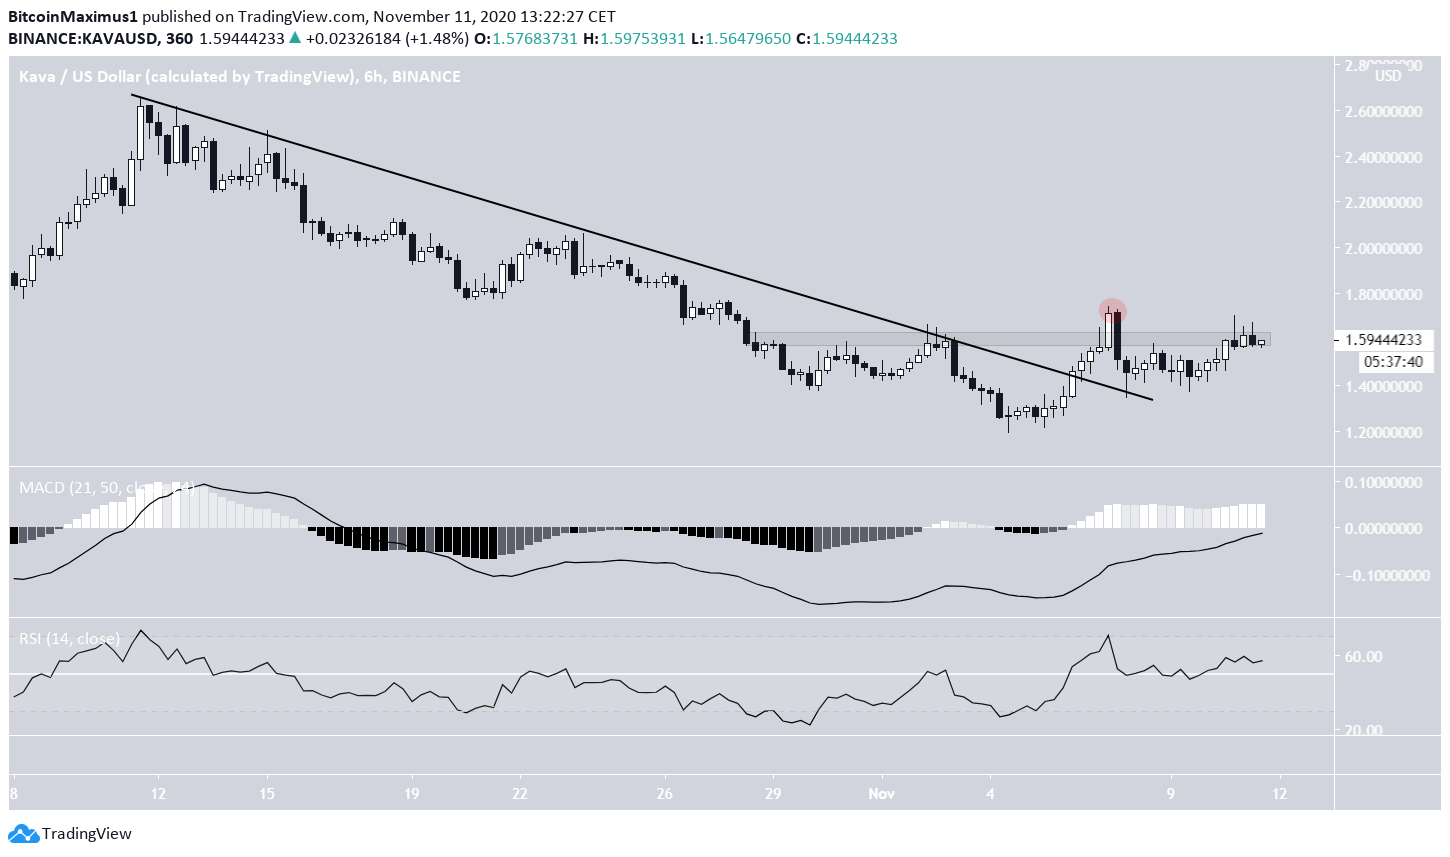
Short-Term Breakout
The 6-hour chart shows that KAVA has broken out from a descending resistance line that had been in place since Sept 27.
The increase was short-lived, and the price fell below the $1.60 area after briefly deviating above it. The area is now likely to act as resistance.
However, technical indicators suggest that a breakout could occur since both the RSI and the MACD are increasing, and neither has generated bearish divergence.
Wave Count
Cryptocurrency trader @CryptoTony_ tweeted a KAVA chart, stating that the price will soon begin a new impulse and move toward $1.85.
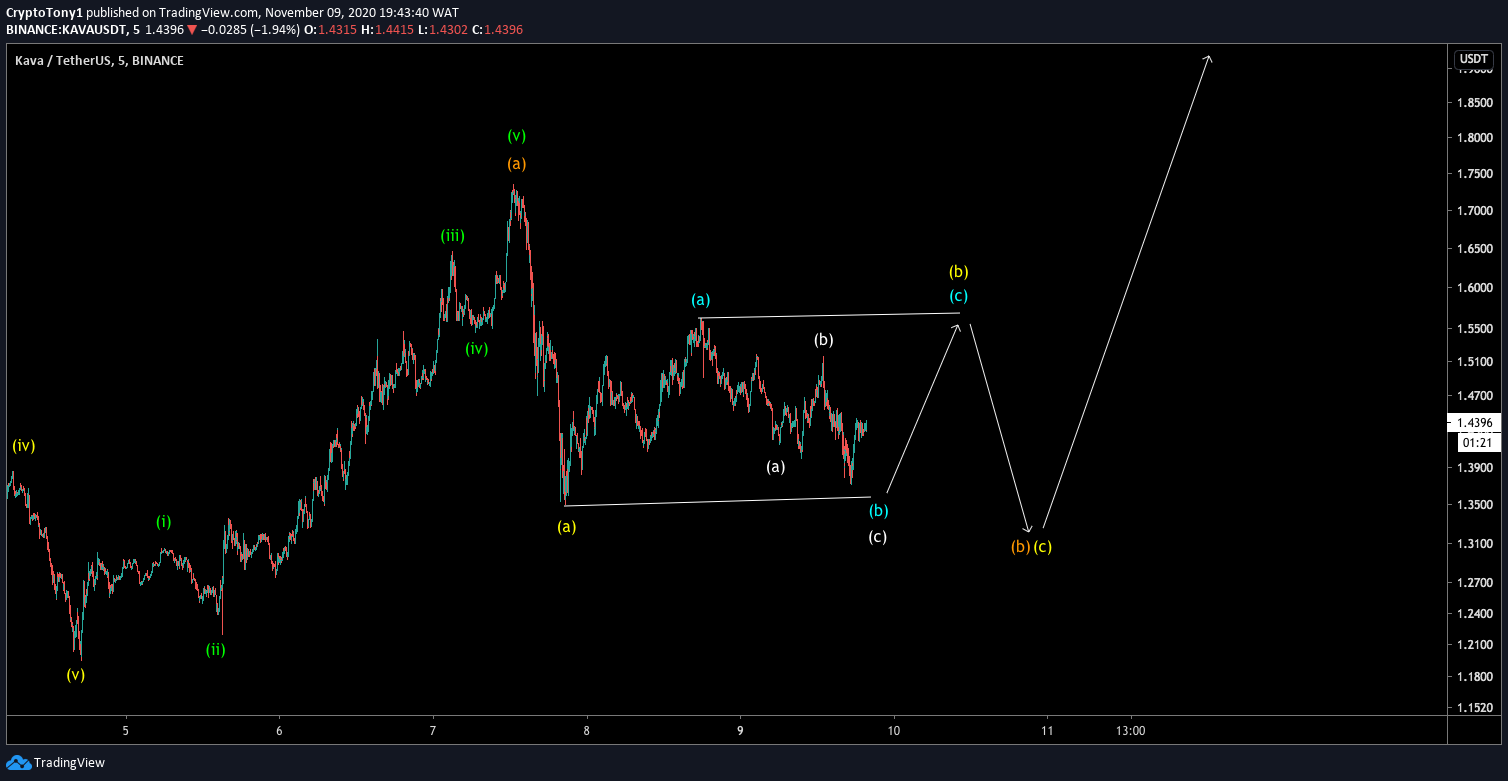
It appears that KAVA has completed a bearish impulse (shown in black below) with an extended third wave (blue) and has now begun an A-B-C correction (black).
The cluster of Fib confluences is found near $1.90, the 0.5 Fib level of the decline, and the length of A projected to C. This level aligns with the target given in the tweet.
Therefore, the price should reach this level before possibly resuming its downward trend once more.

Conclusion
To conclude, while it seems likely that KAVA will rally and reach $1.90, there are no definitive signs yet that the long-term trend has turned bullish.
For BeInCrypto’s latest Bitcoin analysis, click here!
Disclaimer: Cryptocurrency trading carries a high level of risk and may not be suitable for all investors. The views expressed in this article do not reflect those of BeInCrypto.


