


KAS, the altcoin that powers the Kaspa proof-of-work blockchain, saw its value climb to an all-time high of $0.19 on June 30. Exchanging hands at $0.18 at press time, the token’s value has since declined by 7%.
An on-chain assessment of KAS’ price performance confirms that traders continue to demand the altcoin.
Kaspa’s Brief Decline Triggers Surge in Long Liquidations
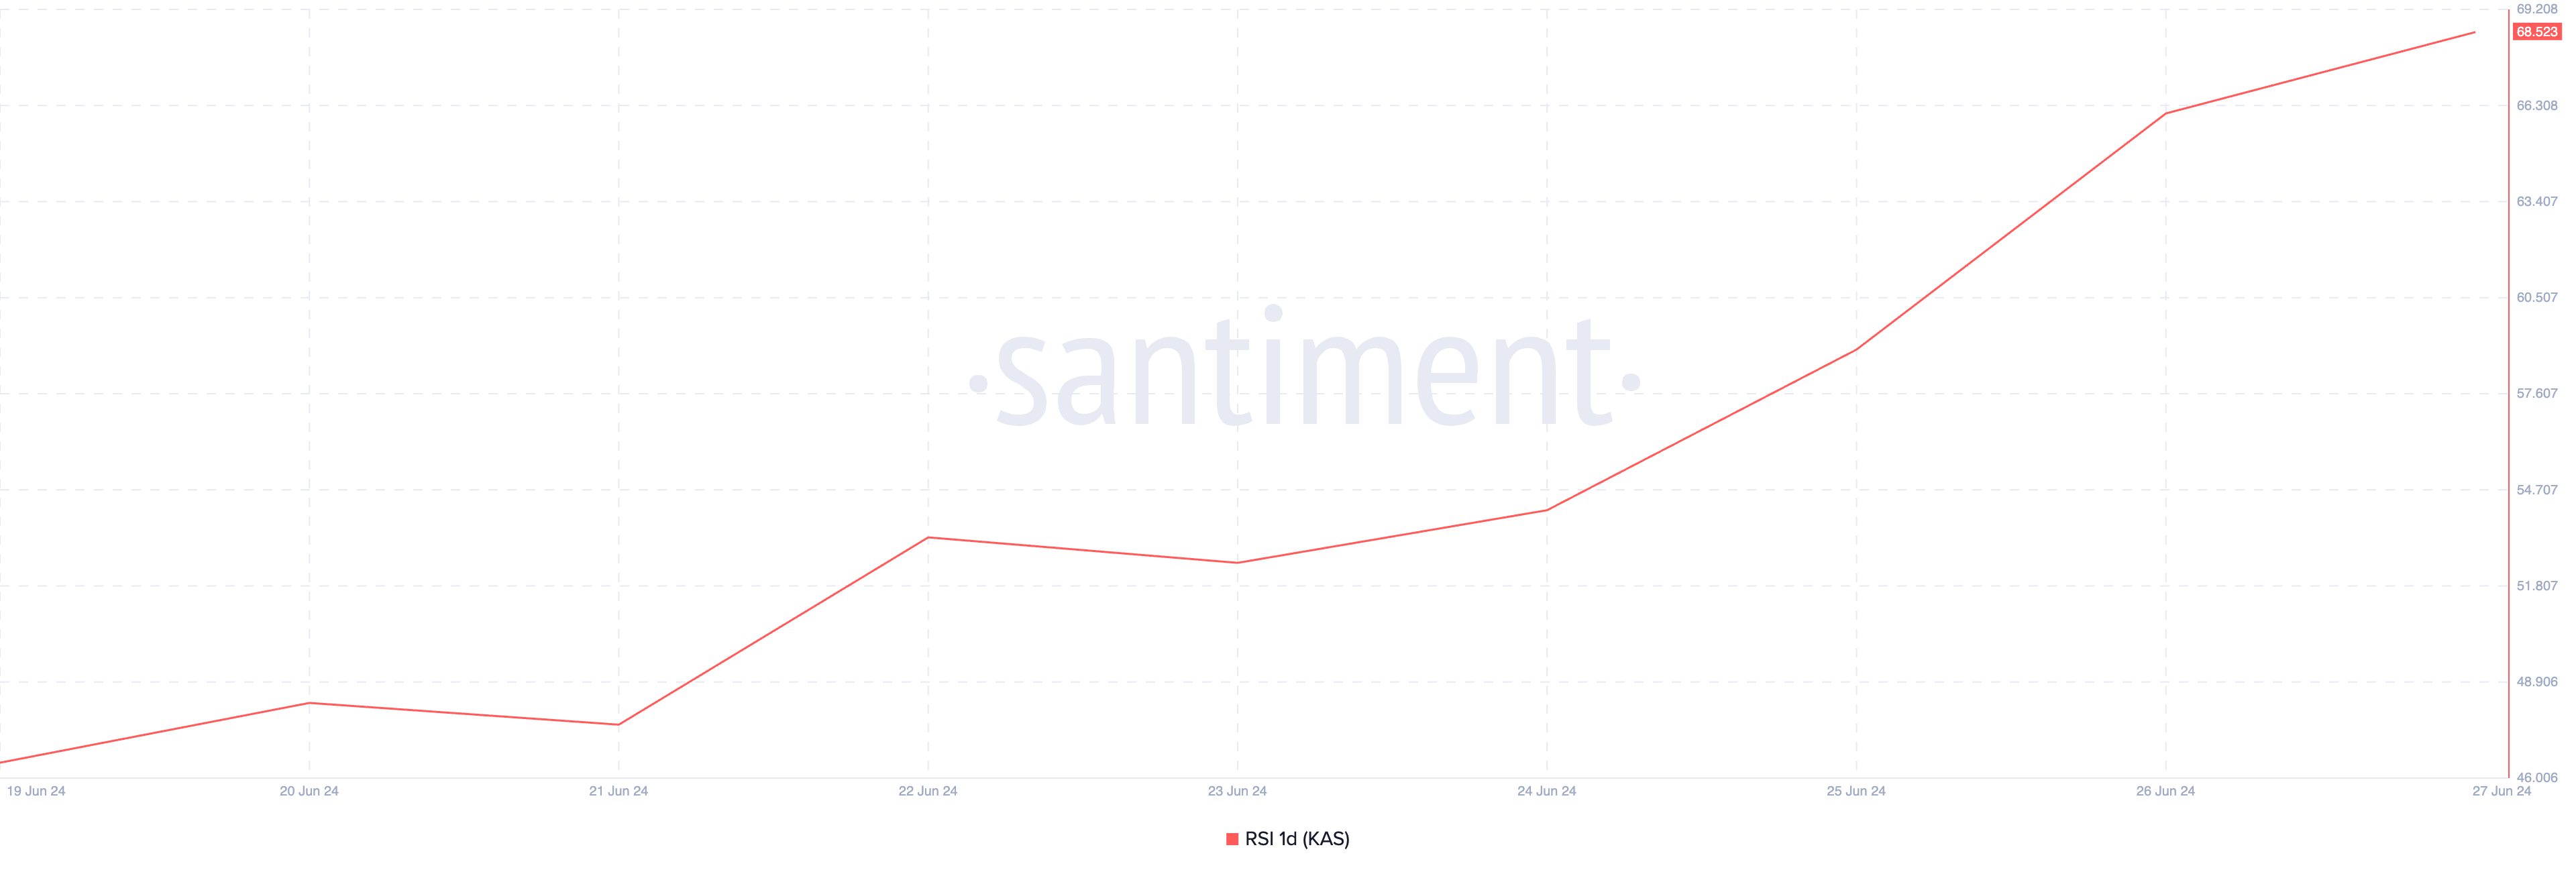
As of this writing, the value of Kaspa’s (KAS) Relative Strength Index (RSI) is 68.52. It is also in an uptrend. This indicator measures an asset’s overbought and oversold market conditions.
It ranges between 0 and 100, with values above 70 suggesting that the asset is overbought and due for a correction. In contrast, values below 30 indicate the asset is oversold and may soon witness a rebound.
At 68.52, KAS’ RSI signals high buying pressure among market participants. It confirms that the token price hike is backed by actual demand, which may be necessary to sustain the rally.
Read More: How To Buy KASPA And Everything You Need to Know
After KAS rallied to an all-time high yesterday, many futures market traders opened several short positions. This was gleaned from the negative weighted funding rate (-0.0085%) recorded yesterday.
Funding rates are a mechanism used in perpetual futures contracts to ensure the contract price stays close to the spot price.
When an asset’s funding rate is negative, more traders demand short positions. This means that more traders expect the asset’s price to fall than those who buy it with the expectation of selling at a higher price.
Several long positions were liquidated when KAS eventually corrected from its all-time high. On June 30, the value of long positions liquidated totaled $586,220, its single-day highest since March 16.
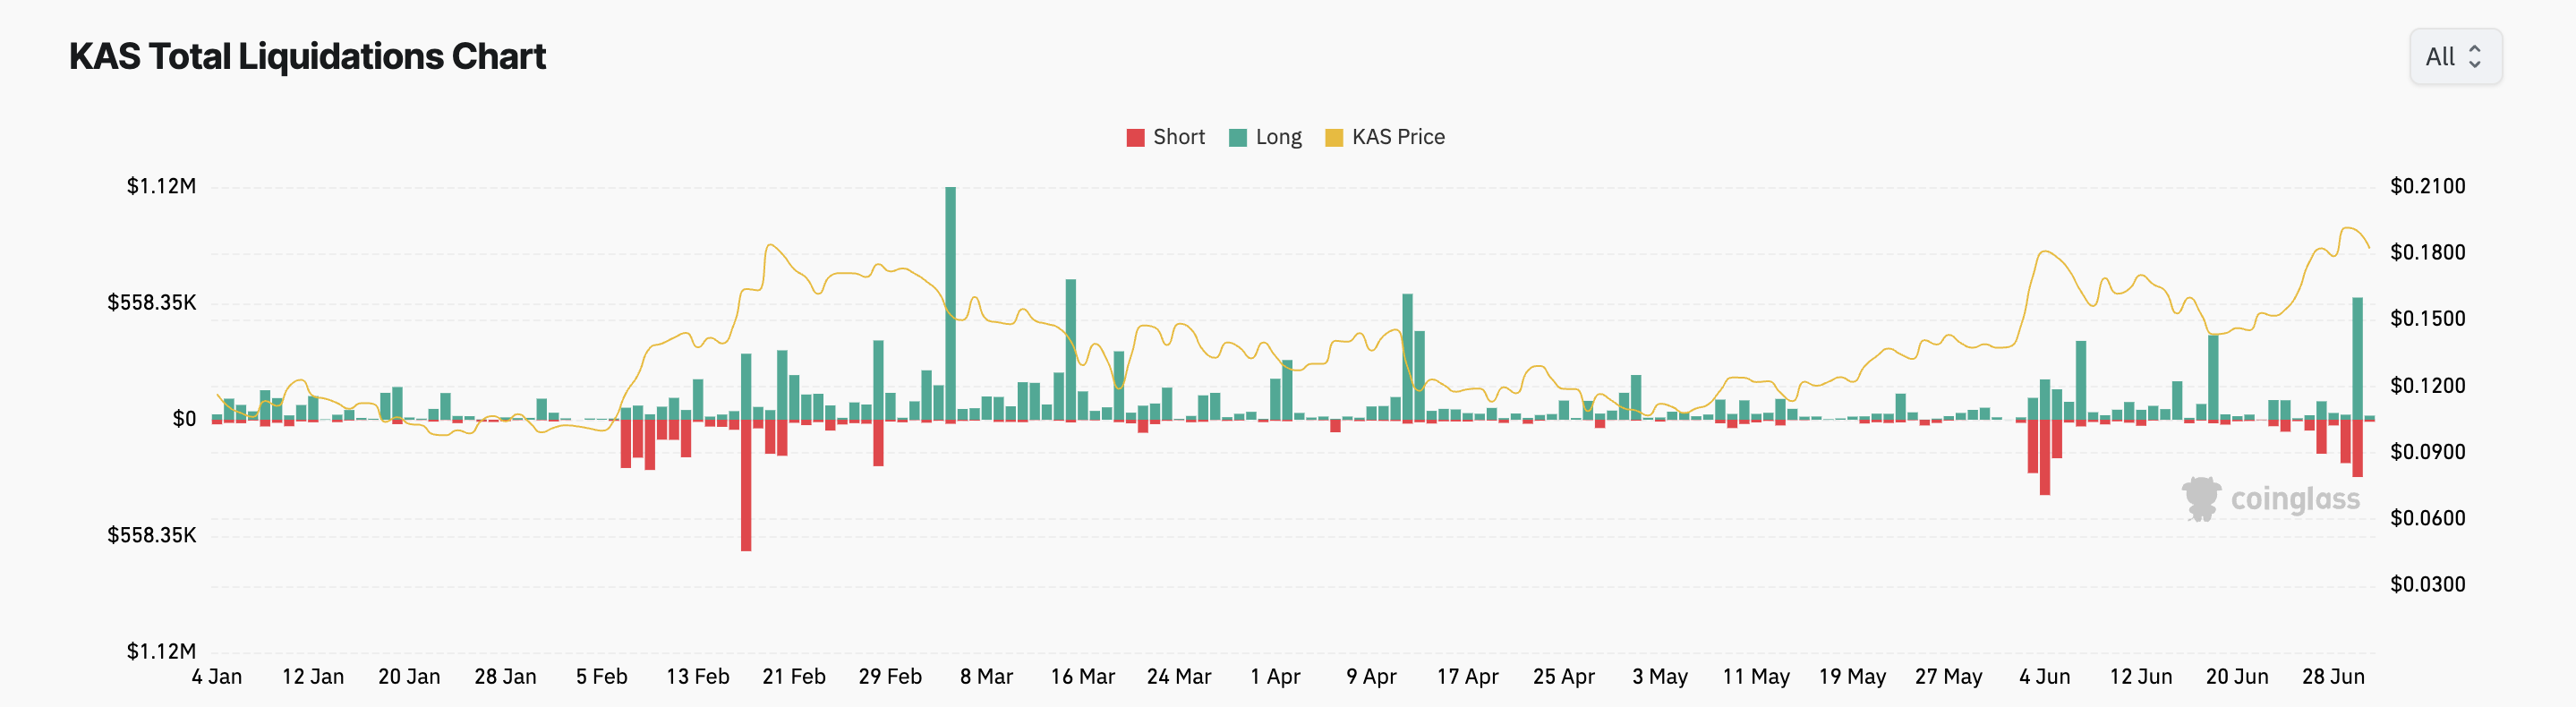
Long liquidations happen when an asset’s value drops unexpectedly, forcing traders with open positions in favor of a price rally to exit.
KAS Price Prediction: There is Room For More
KAS’ value may rise further as the bullish bias towards it remains significant. For example, readings from its Awesome Oscillator show that the indicator has returned only green histogram bars since June 23.

This indicator measures an asset’s price trends and identifies reversal points. When it posts green bars, it is a bullish signal, indicating that there may be upward movement or strength in the ongoing trend.
If the current trend continues, KAS’ price will reclaim its all-time high and may end up trading above it at $0.2.
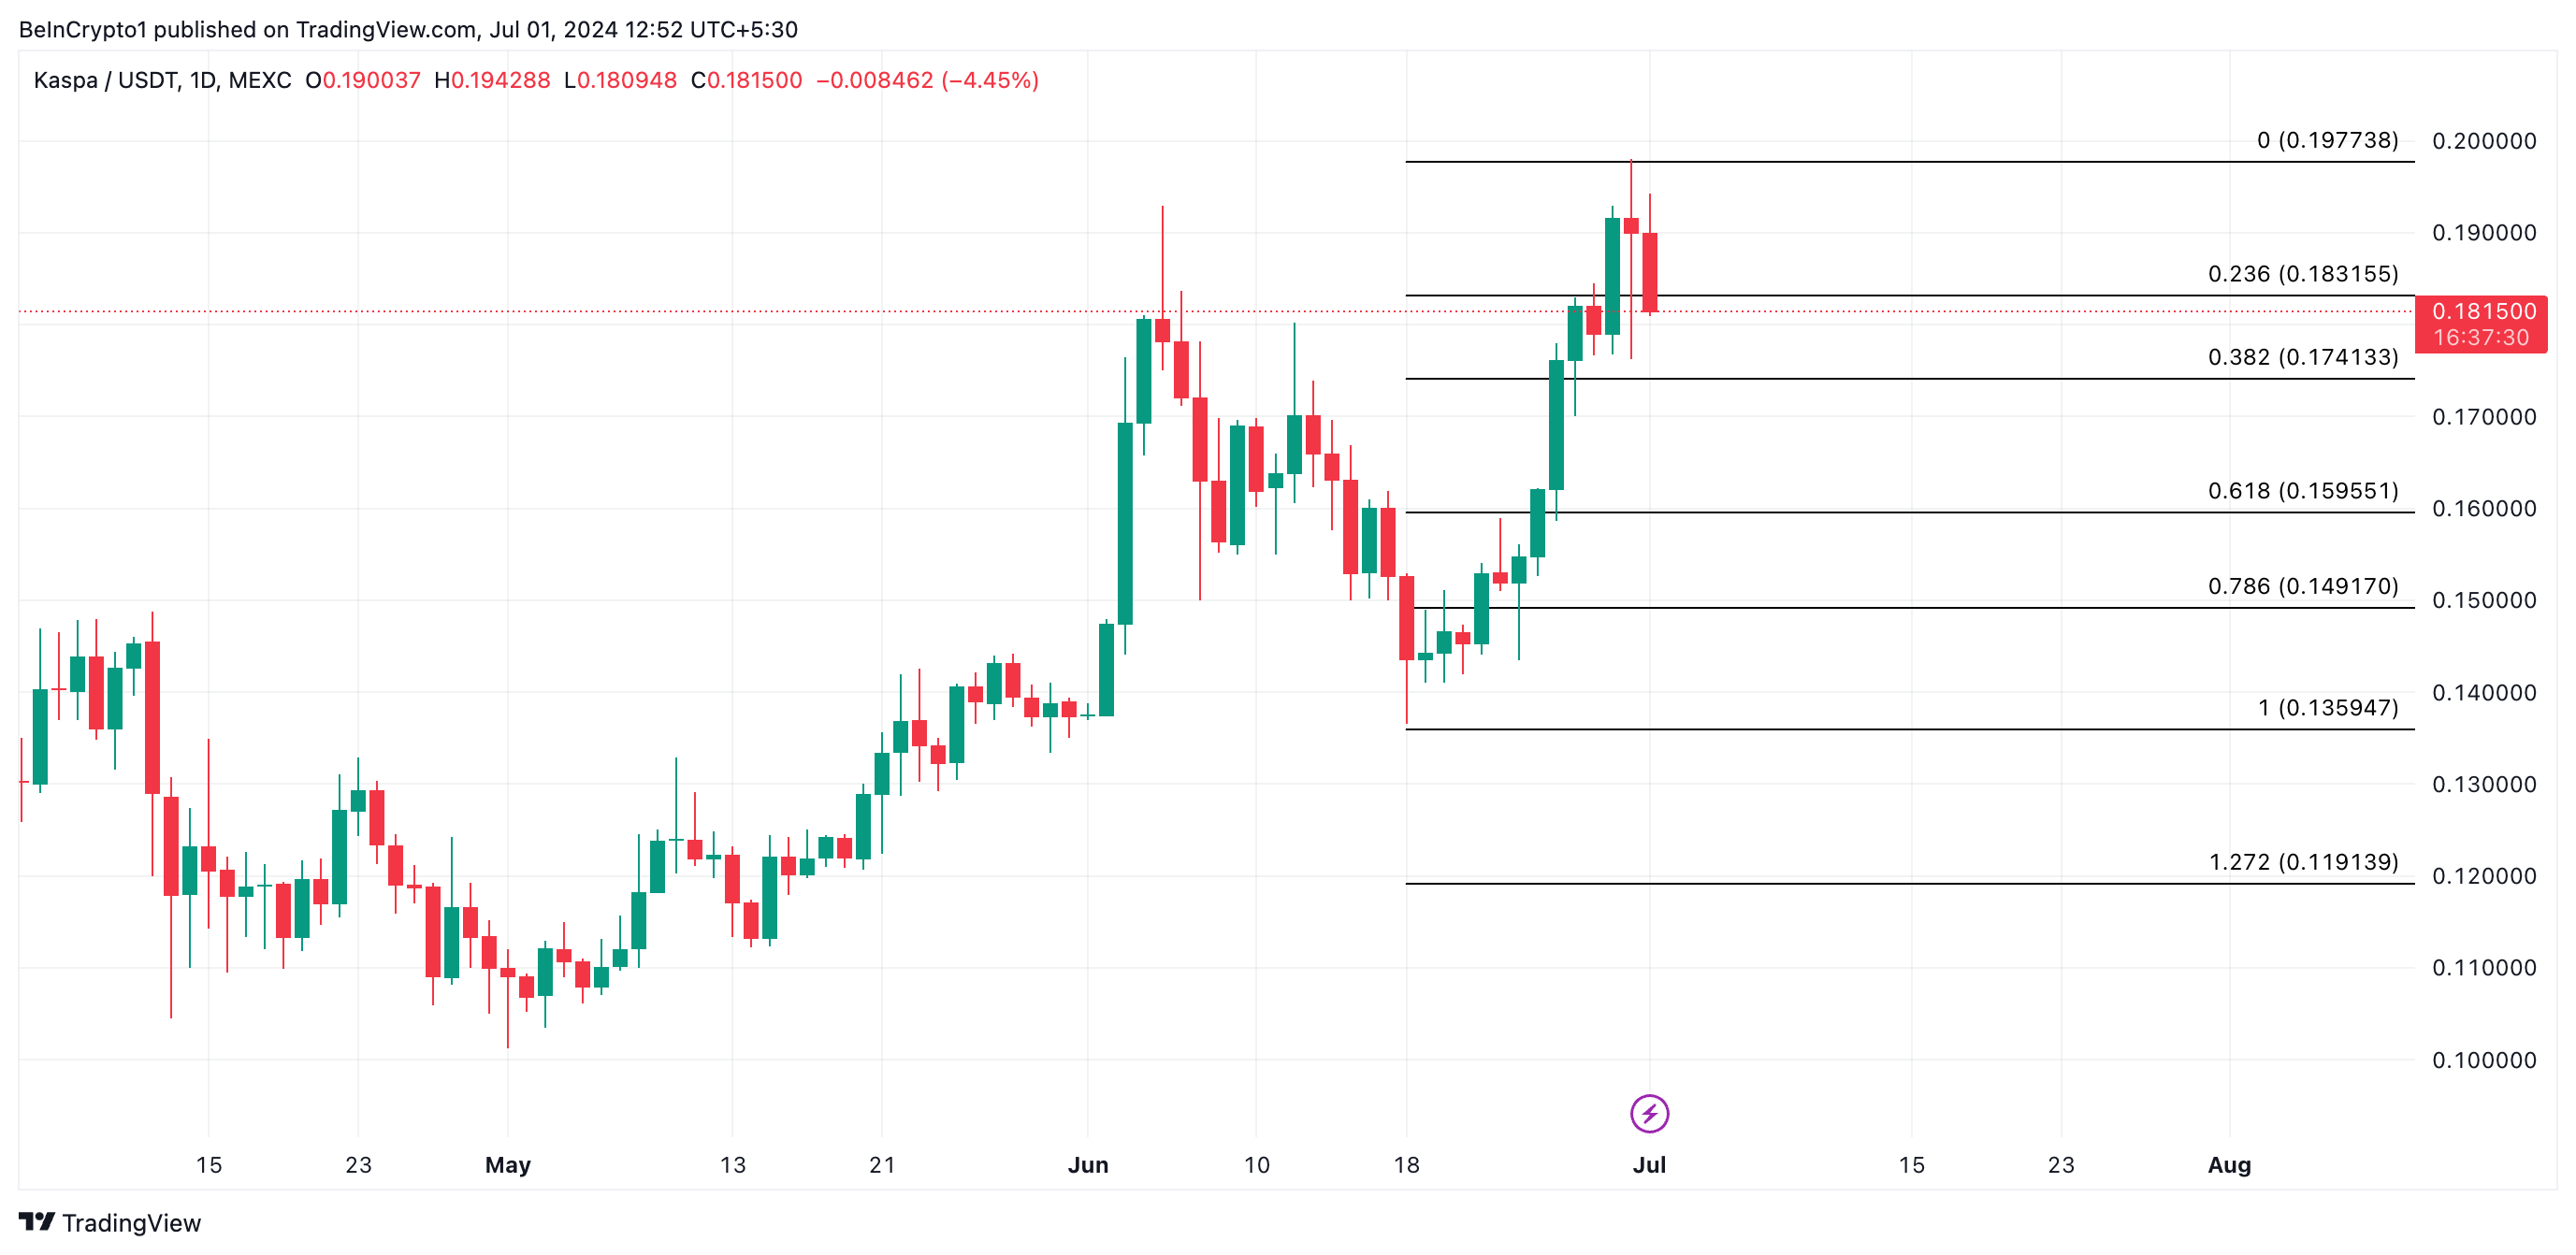
However, a decline may ensue if profit-taking activity gains momentum, invalidating the bullish projection above. KAS’ price may fall to $0.17.


