


Kaspa (KAS) price is treading downwards again after exhibiting potential for recovery over the past couple of days.
This time, however, the correction could extend, which could be a little further.
Kaspa Optimists Could Back Off
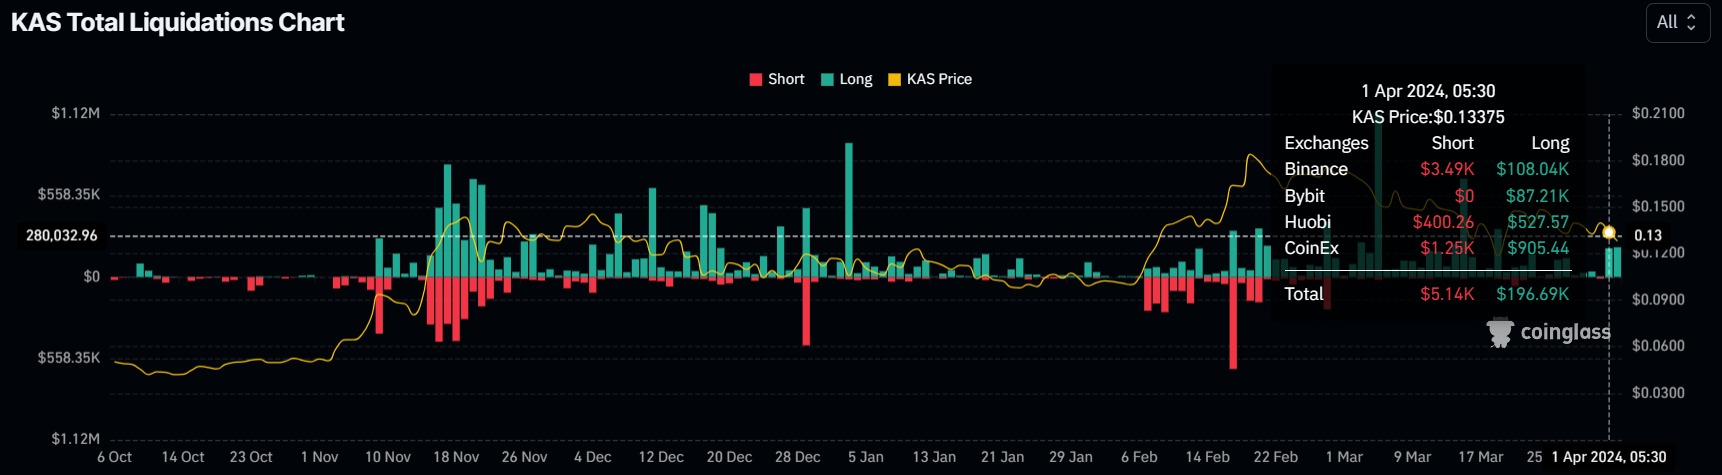
KAS traders that have been making bullish bets are losing owing to the red candlesticks on the daily chart. Following a 10% correction in Kaspa price in the last 24 hours, many long contracts witnessed liquidation.
In just two days, over $404 million worth of long liquidations have been recorded. This might keep traders from attempting another attempt at placing their bets on a price. As is, price indicators are not supportive of a rally anyway.
Read More: Where To Buy Kaspa (KAS): 3 Best Platforms for 2024
The Relative Strength Index (RSI), a momentum oscillator measuring the speed and change of price movements, is exhibiting bearishness. The indicator is currently under the neutral line marked at 50.0 after failing to breach and flip it into support.
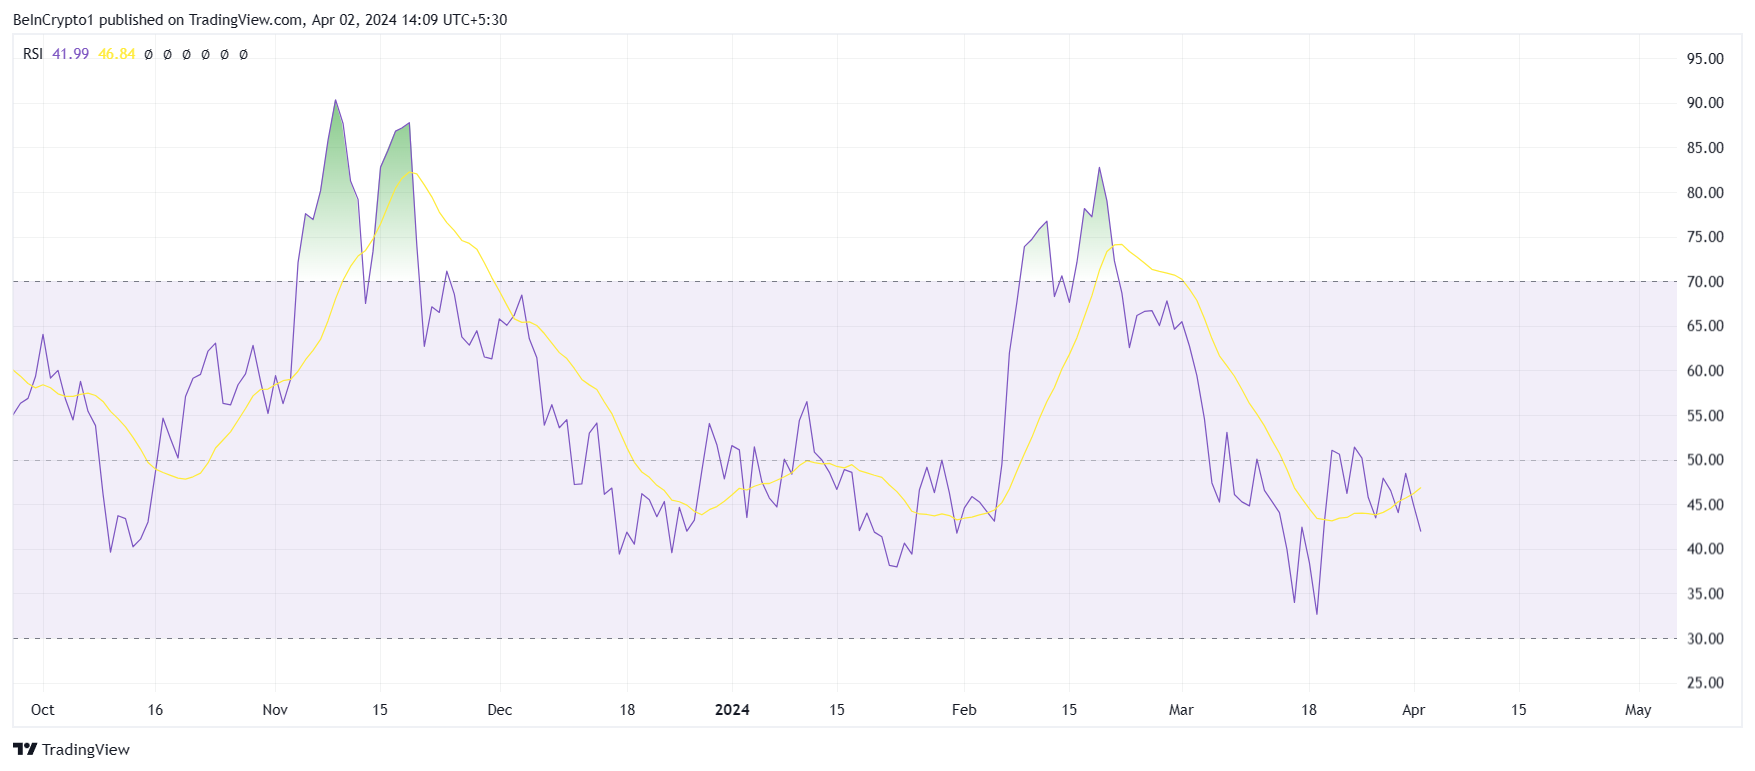
This hints at KAS noting pessimism from the investors and the broader market cues, which would result in the altcoin witnessing further drawdown.
KAS Price Prediction: What Awaits?
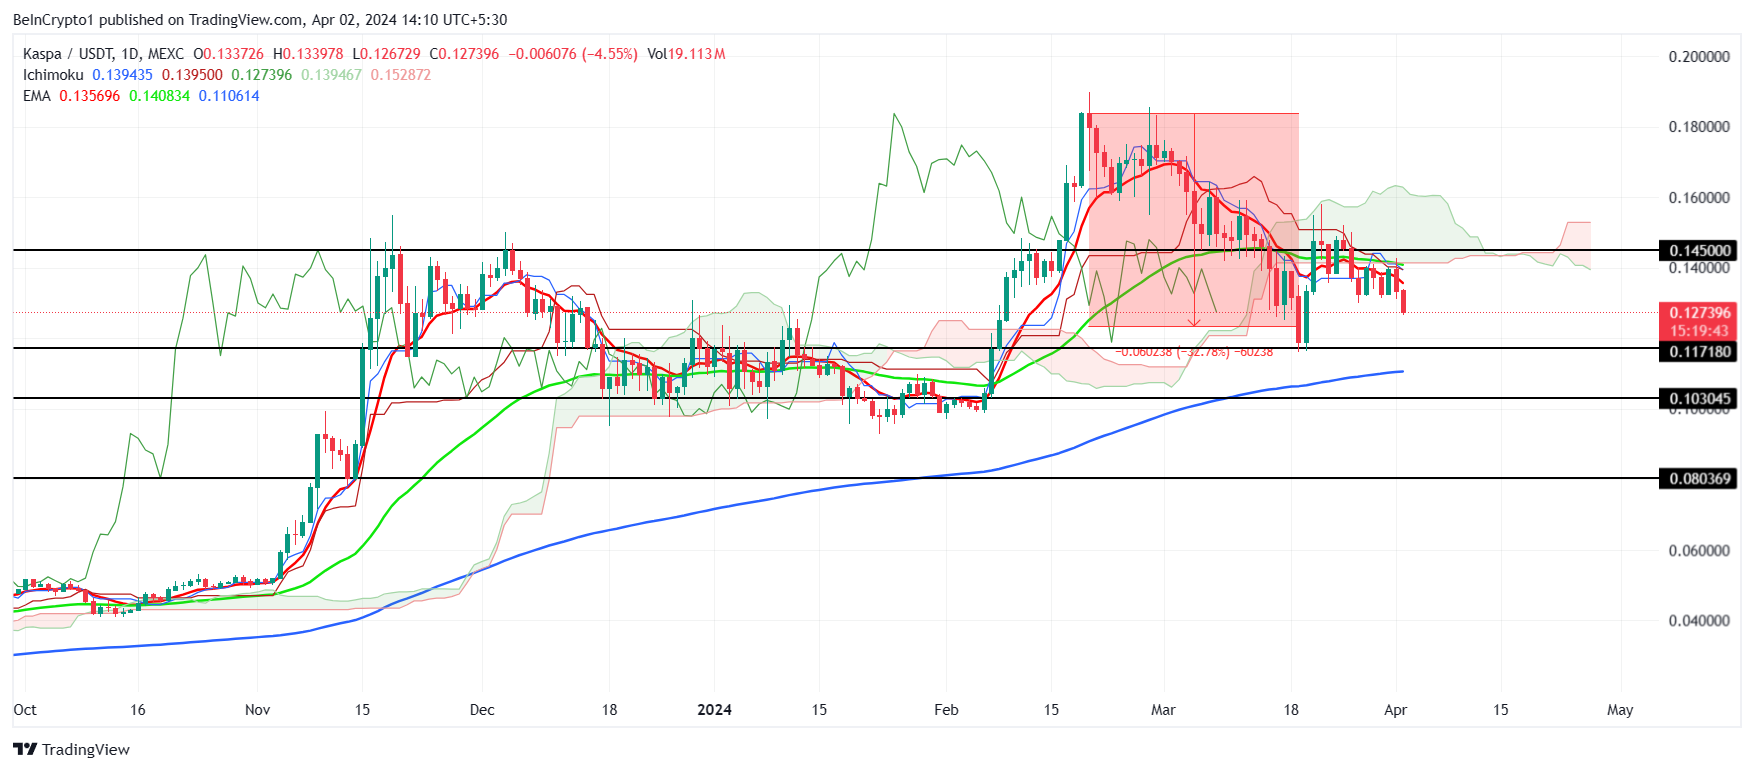
Kaspa’s price is trading at $0.127 at the time of writing after failing to break through the resistance of $0.145. By the looks of it, KAS will halt its decline after tagging $0.117. Should the bearishness remain intense even then, the altcoin could fall to test the next crucial support at $0.103. This would result in a 17% fall for KAS.
The Ichimoku cloud also supports this likely outcome. This is a technical analysis tool displaying support, resistance, and trend direction on a chart, which helps traders identify potential market trends. Given the candlesticks are below the cloud, the cryptocurrency will probably stick to its bearish outlook.
Read More: How To Buy KASPA And Everything You Need to Know
On the other hand, if Kaspa’s price bounces back from the $0.117 support level, it could attempt another breach of $0.145. This would also enable the cryptocurrency to reclaim the 50 and 100-day Exponential Moving Averages, likely invalidating the bearish thesis.


