


The Bitcoin dominance rate (BTCD) has broken down from a long-term ascending support line and faces considerable overhead resistance.
While a short-term relief rally could occur, BTCD is expected to eventually continue its longer-term descent.
Support Line Breakdown
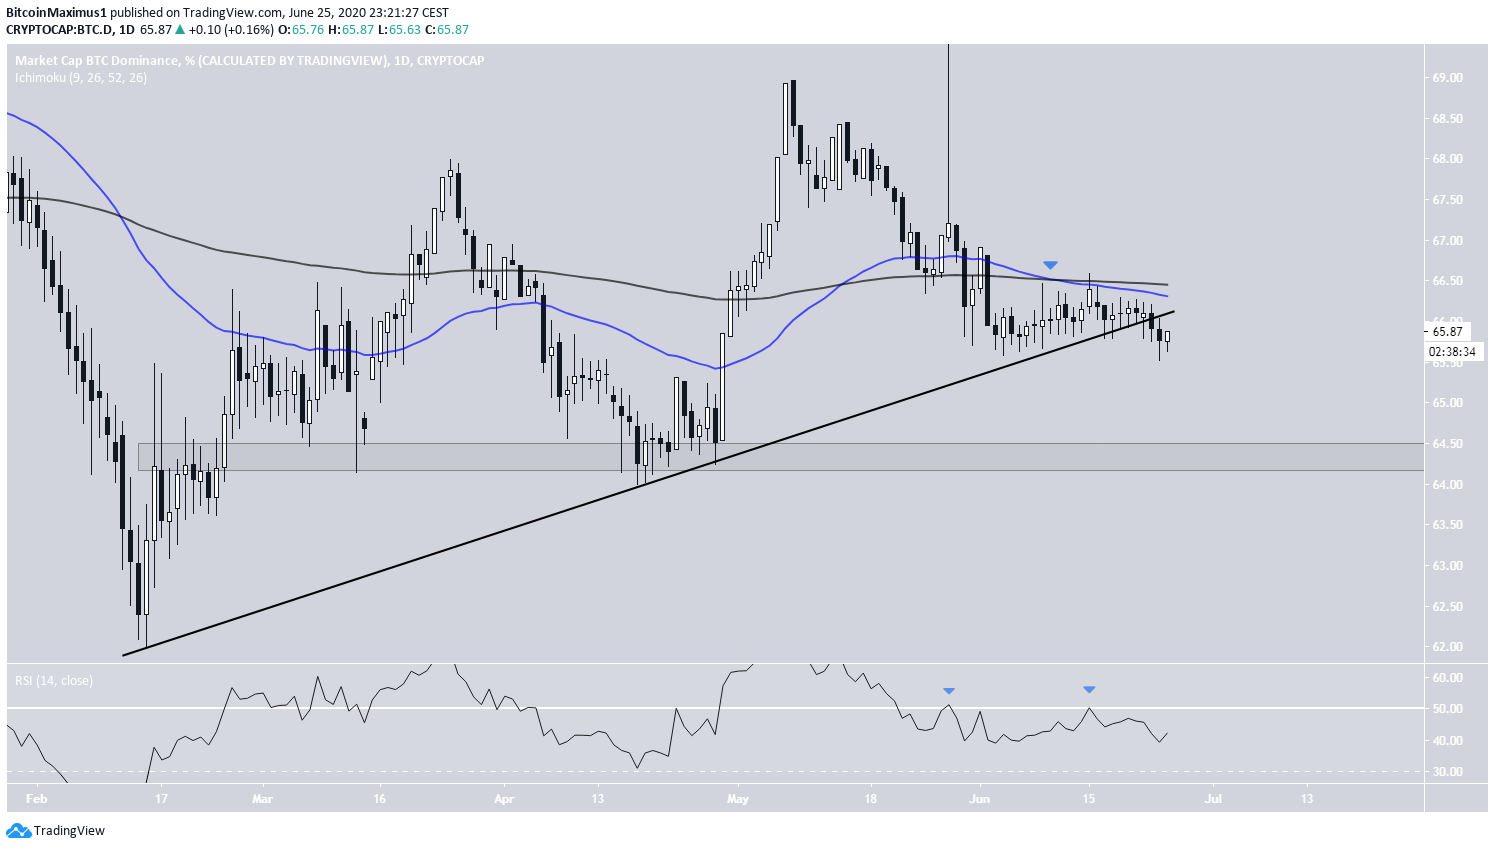
On June 23, the Bitcoin dominance rate (BTCD) broke down from an ascending support line that had been in place since Feb 23. While the rate is currently in the process of creating a bullish daily candlestick, it faces considerable overhead resistance.
The 50 and 200-day moving averages (MA) have made a bearish cross, and are offering resistance to the rate. Furthermore, the daily RSI has been twice rejected by the 50-line. A rate increase that would validate the aforementioned MAs and/or the ascending support line would also cause the RSI to go to 50, where it would likely be rejected.
If BTCD continues its descent, it is likely to find support between 64-64.5%.
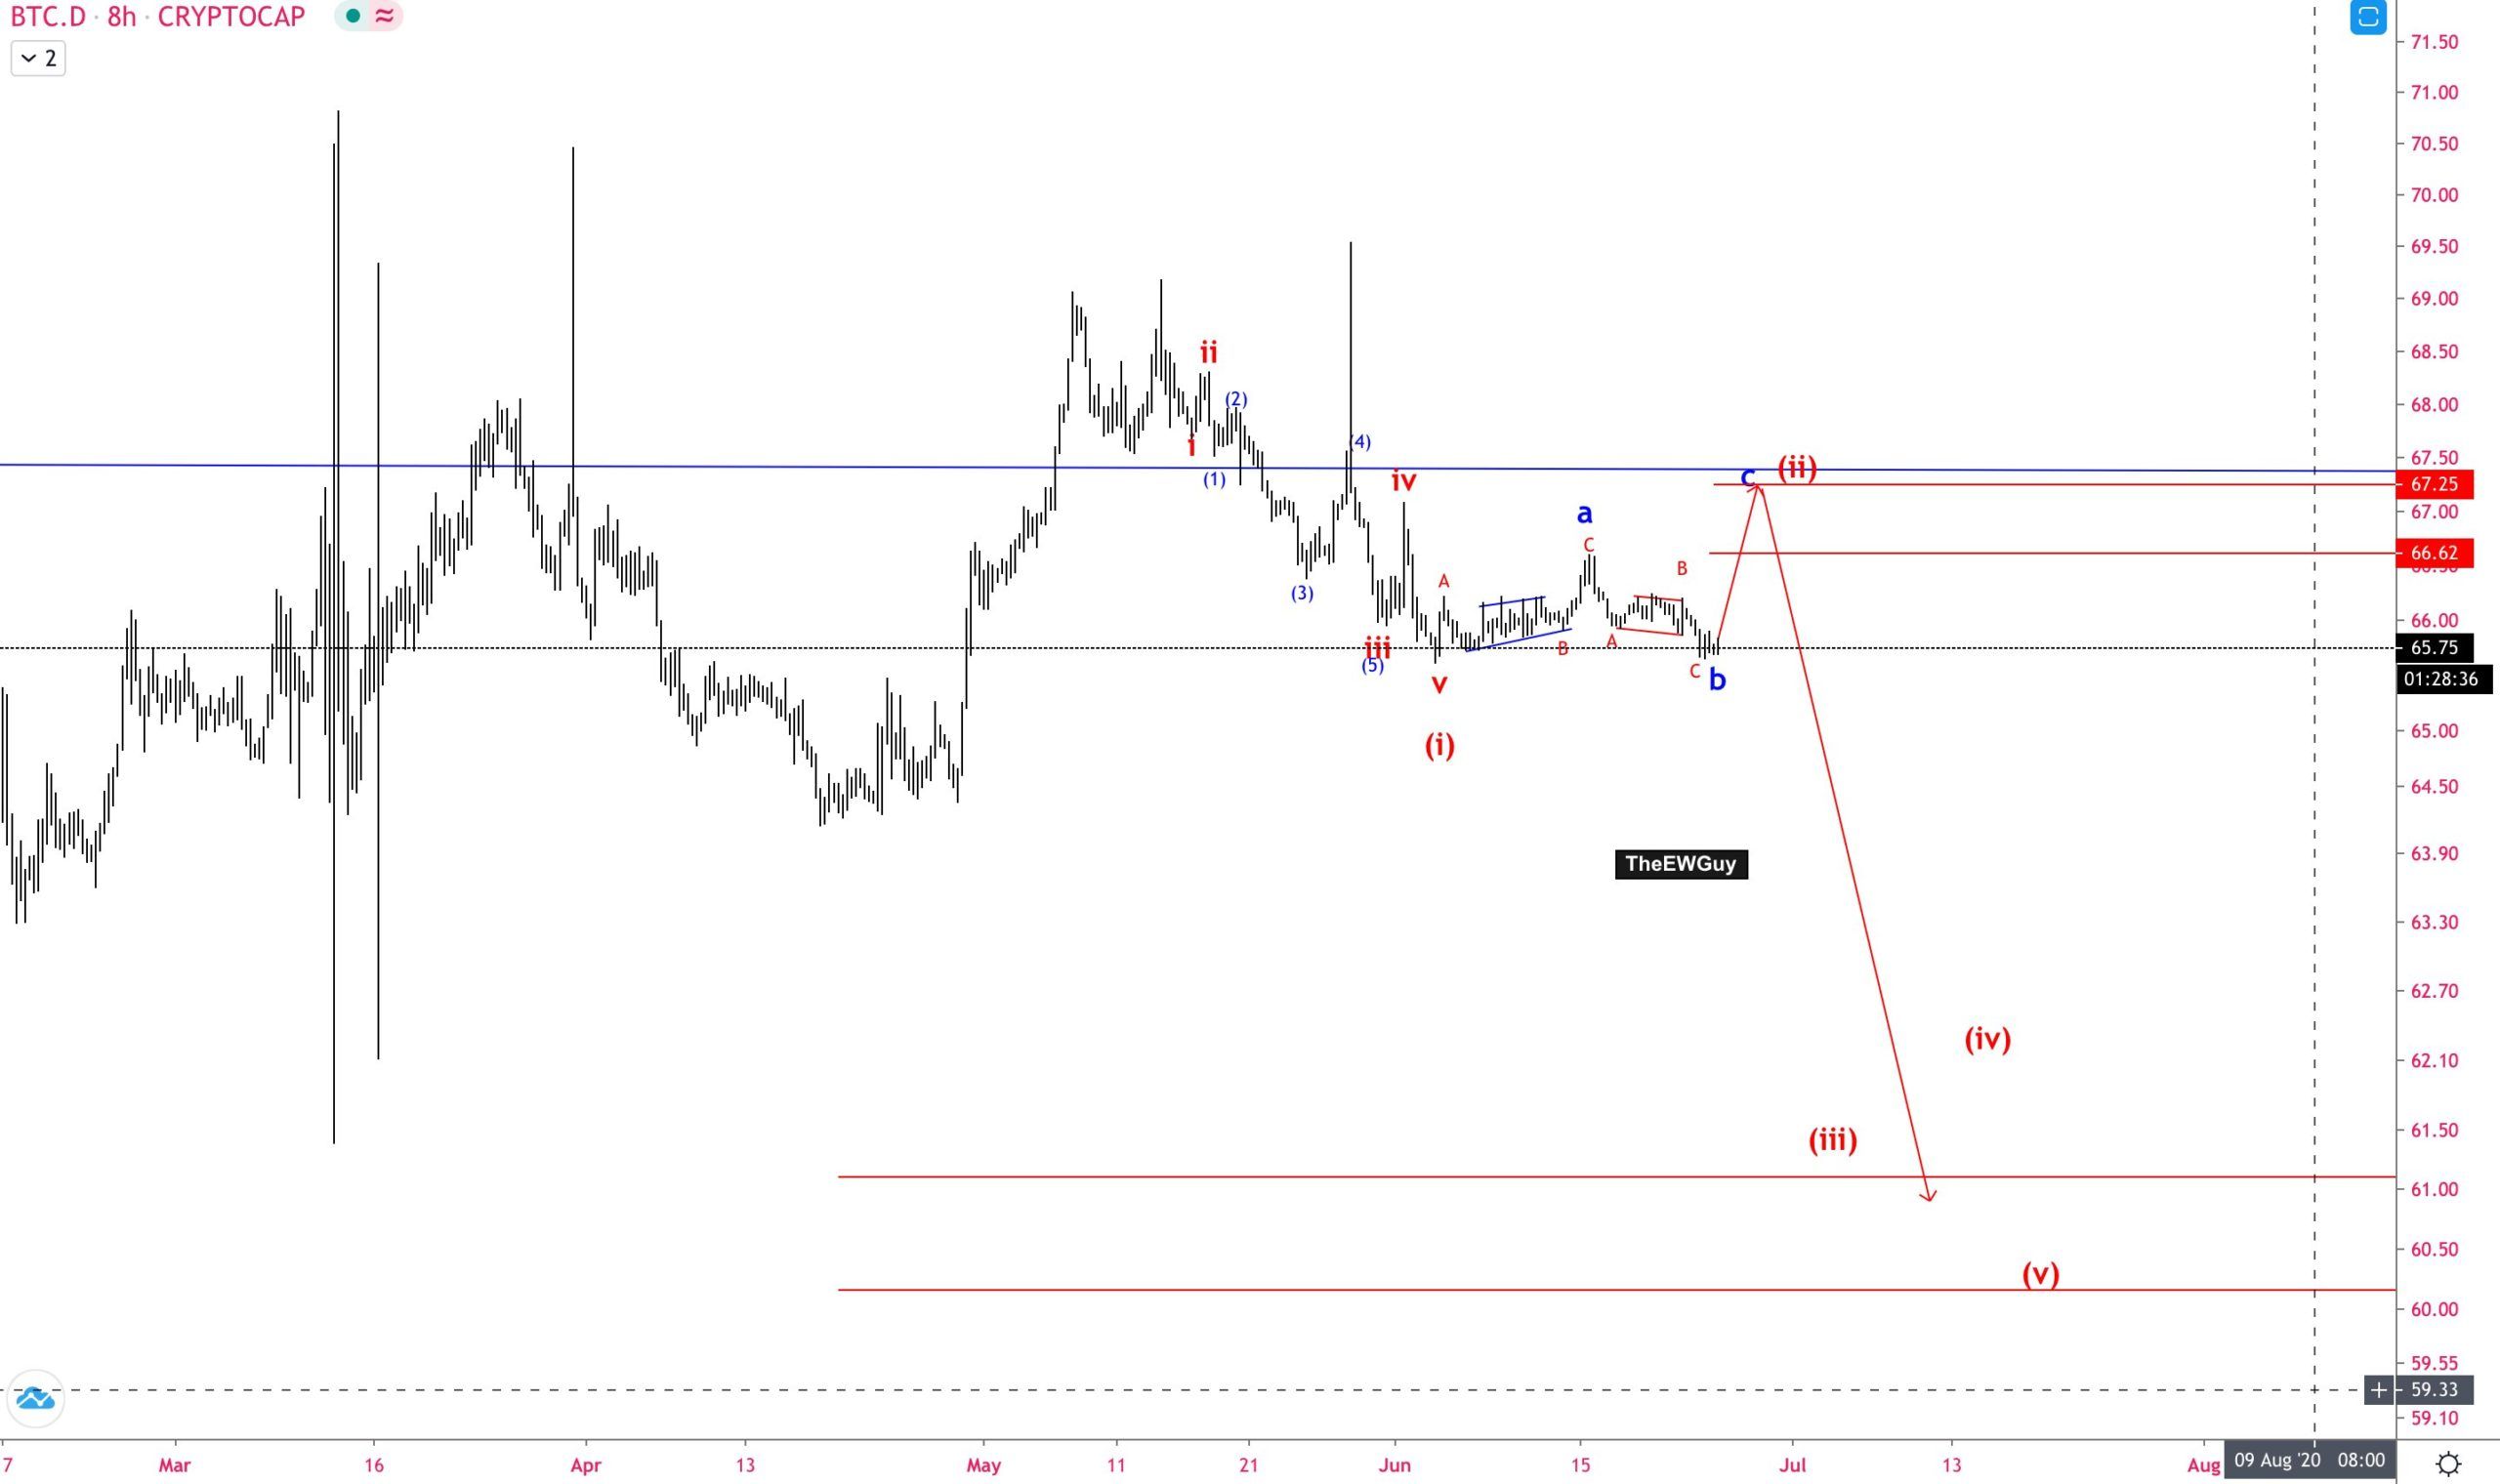
The well-known trader specializing on Elliott Wave theory,y @TheEWguy, stated that he believes the Bitcoin dominance rate will have one final upwards push before decreasing considerably:
Channel & Relationship To Bitcoin
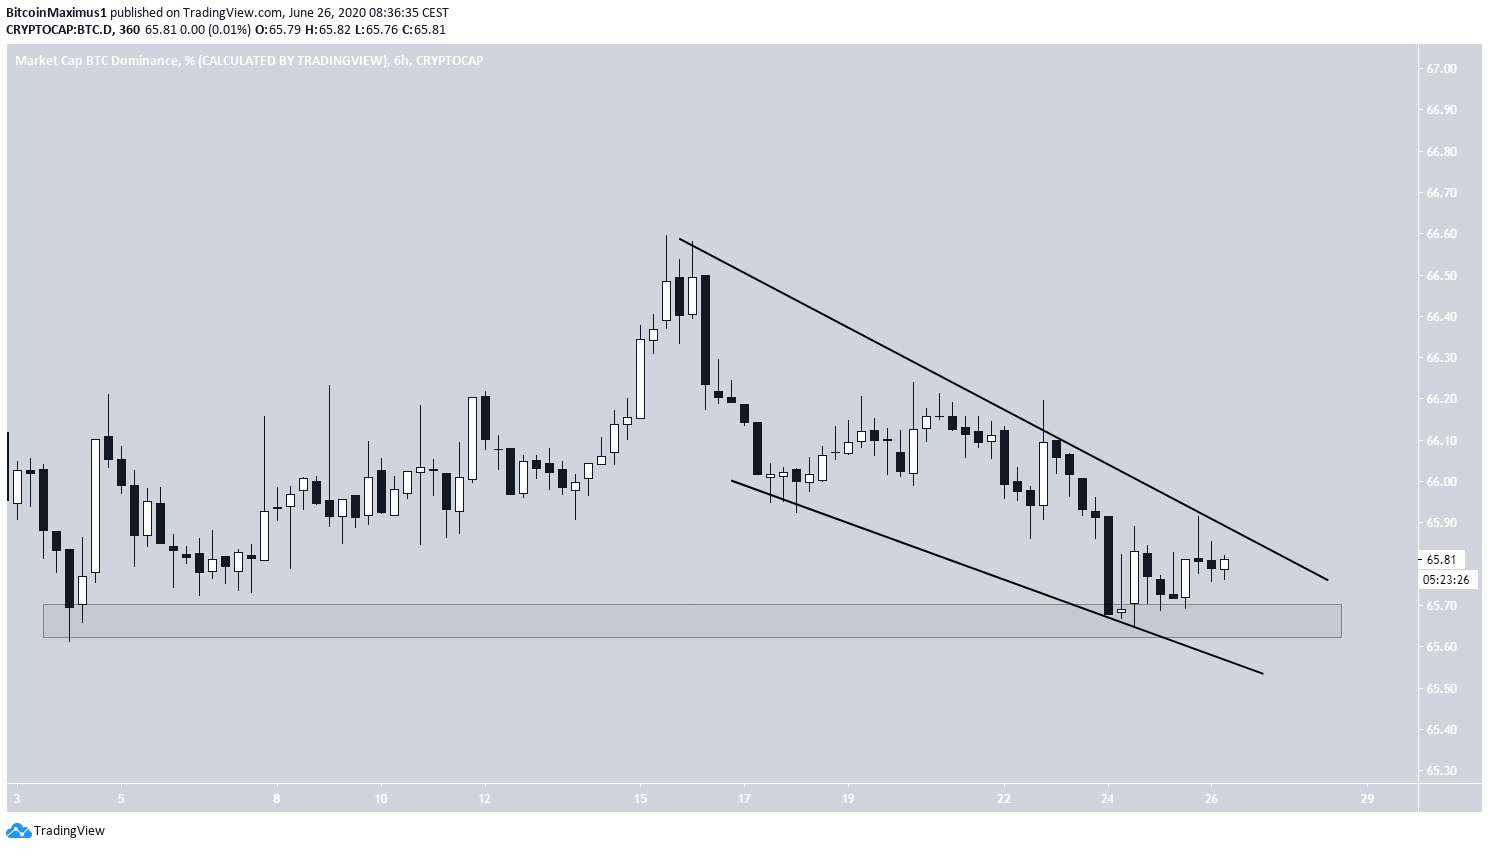
In the shorter-term, the BTCD is trading inside either a descending channel or wedge. Furthermore, it has bounced on the minor 65.5% support area, which initiated an upward move on June 4.
Whether the rate decreases below this support area or breaks down from the resistance line of the channel will determine if BTCD decrease towards the 64-64.5% support area, or initiates the relief bounce as suggested by the EW count.
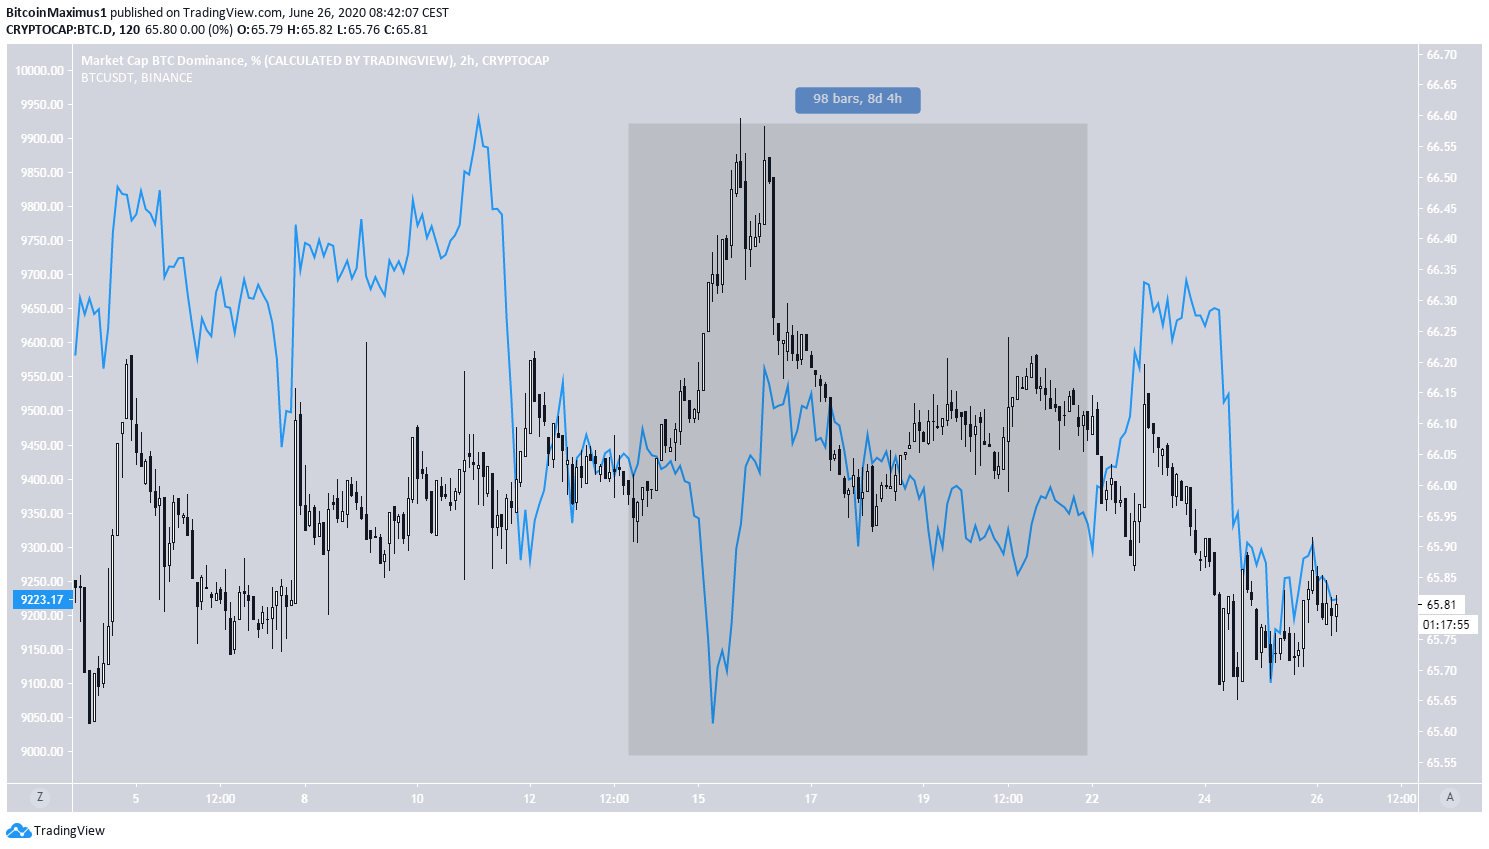
As for the relationship to Bitcoin, the BTCD has had a positive correlation with the price since June 5.
This changed for an eight-day period between June 13-21, in which the correlation flipped, but the positive relationship has resumed since June 22.
Therefore, for ALT/BTC pairs to increase, the Bitcoin price has to decrease.
To conclude, the BTCD is expected to decrease after a possible short-term relief rally.


