


As August comes to a close, it heralds the arrival of a historically negative month for Bitcoin – Does this make September the perfect time to buy Bitcoin?
September stands out as the sole month that has, on average over the last decade, exhibited a negative performance for the Bitcoin price.
The Only Negative-Average Month for the Bitcoin Rate
During this timeframe, BTC has experienced an average decline of 5.5%. While some view this as a discouraging trend, others might interpret it as a favorable chance for strategic investment.
This information is visually represented in the table provided below. The figures reflect the percentage change in comparison to the preceding month. Although August 2023 has not concluded, the Bitcoin price has declined by approximately 11% compared to August 1.
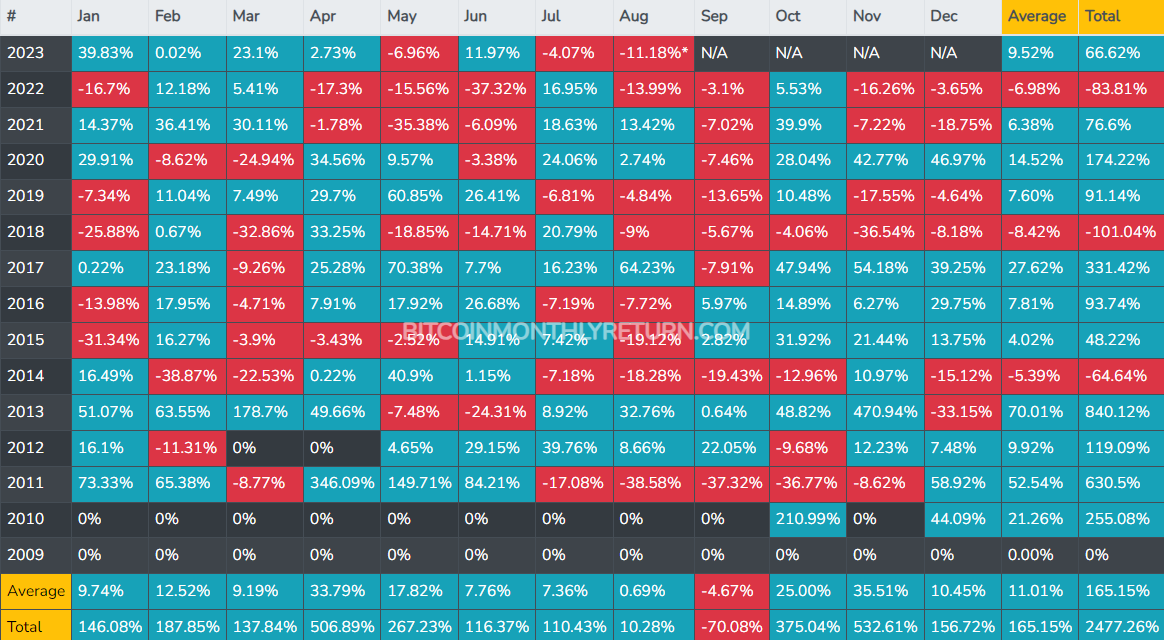
The data clearly illustrates substantial price fluctuations in Bitcoin over the years. For instance, in 2013, there was a remarkable surge of 470.94% in November, whereas in 2018, there was a decline of -36.54% in the same month.
More Insight? Check Out the Top 11 Crypto Communities To Join in 2023
Trends Over the Years
In general, the table highlights certain trends. For instance, the Bitcoin price appears to exhibit a pattern of significant highs and lows in certain years, while in other years, the fluctuations are less intense. Additionally, the average percentage of monthly changes varies yearly, with notable spikes over the past decade in 2013, 2017, and 2021.
Indeed, there seems to be a discernible pattern. There might not be much to elaborate on when observing Bitcoin’s monthly performance beyond the averages.
However, a significant observation can be made when analyzing its annual performance. The price experienced substantial surges in 2013, 2017, and 2021. Remarkably, these are the years immediately following the halving events.
If historical patterns hold, a noteworthy surge could be anticipated in 2025 as well. Considering the scheduled halving event in 2024. Representing this on a logarithmic price chart could potentially yield a visual resembling the one below:
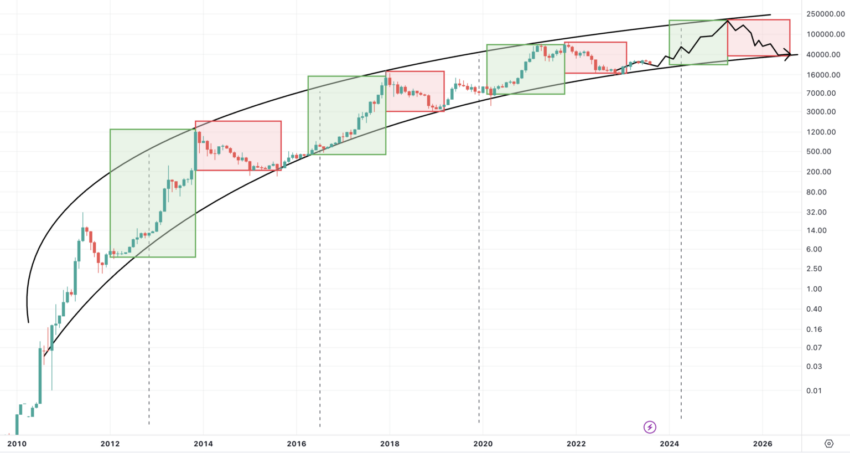
The dashed lines in the chart mark halving events, while the prominent green segments depict the notable price surges in 2013, 2017, and 2021. The chart also includes a speculative projection for 2025.
The latter is a conjectural illustration meant to depict a potential scenario.
Exercising caution is paramount when contemplating the prospect of purchasing Bitcoin based on its historical September price patterns. While historical trends can provide valuable insights, the cryptocurrency market is exceptionally fluid and influenced by numerous variables.
Solely relying on past September performances might not encompass the present market environment and emerging dynamics. Employing a more encompassing strategy that merges historical analysis with broader market indicators and evolving news trends would likely represent a prudent approach.


