
Bitcoin is once again at the center of market volatility as the crypto king faces a critical technical formation — the head and shoulders pattern.
This bearish setup, historically known for signaling trend reversals, suggests the potential for a short-term decline. The combination of technical weakness and outflow dominance is heightening concern among traders.
Bitcoin Is Losing Investor Confidence
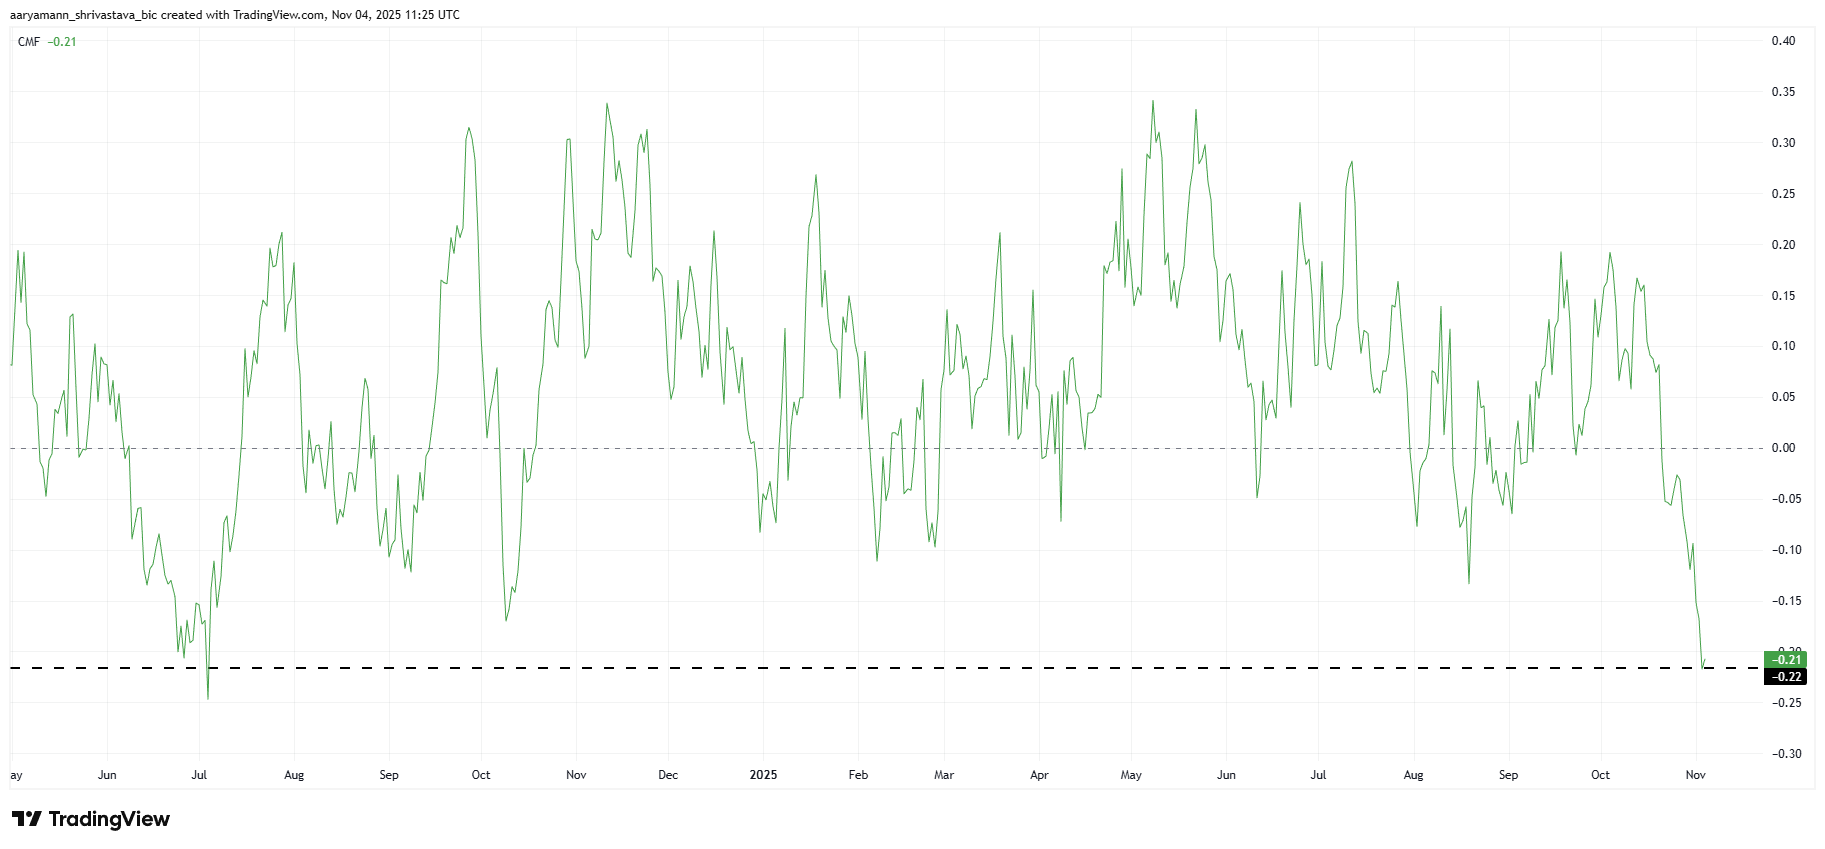
The Chaikin Money Flow (CMF) indicator shows that outflows are currently dominating Bitcoin. Over the last few days, the CMF has fallen sharply to its lowest level in 16 months. This indicator tracks the flow of capital in and out of an asset, and its latest reading highlights the intensity of selling pressure across major exchanges.
Such sustained outflows indicate that investors are pulling funds rather than accumulating positions, often a precursor to deeper corrections. The situation marks one of the most significant bearish divergences in over a year. Unless inflows recover quickly, Bitcoin could continue losing momentum as traders de-risk ahead of further market turbulence.
Want more token insights like this? Sign up for Editor Harsh Notariya’s Daily Crypto Newsletter here.
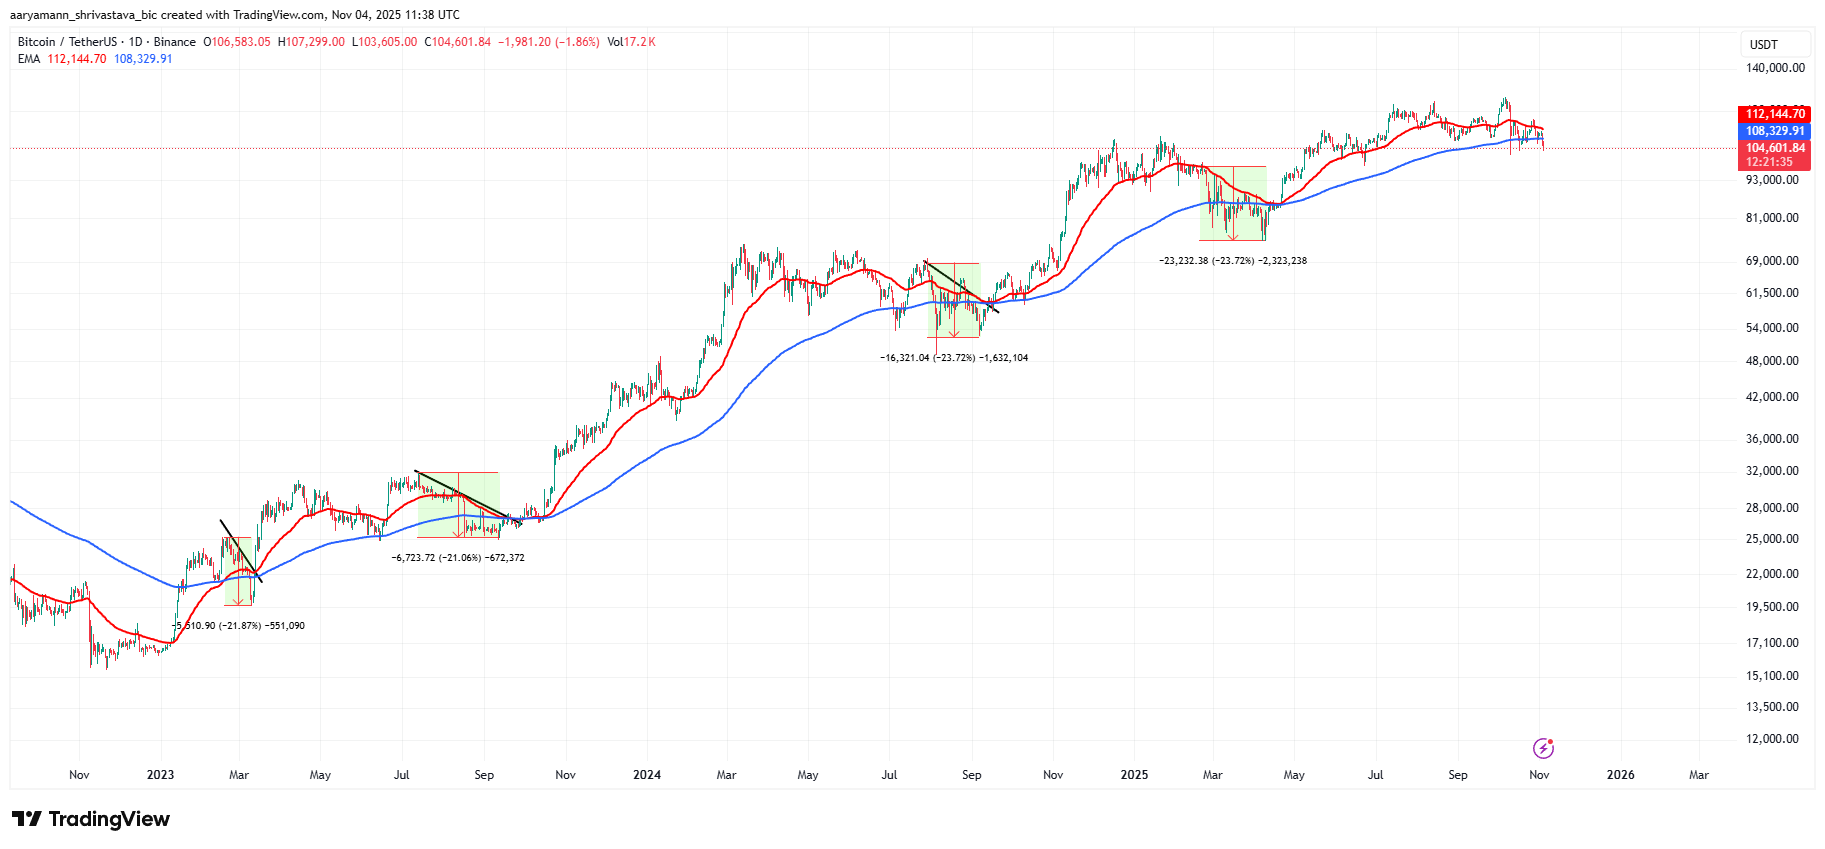
From a broader perspective, Bitcoin’s exponential moving averages (EMAs) are nearing a potential Death Cross formation. This occurs when the short-term EMA crosses below the long-term EMA, typically signaling a sustained downtrend. In the past two years, Bitcoin has narrowly avoided such a crossover four times.
However, each of those instances was followed by notable corrections, with average declines ranging between 21% and 23%. Given that Bitcoin is already under pressure, another retracement of this magnitude could easily send its price below $100,000, just 5% below current levels.
BTC Price Could Fall Much Below $100,000
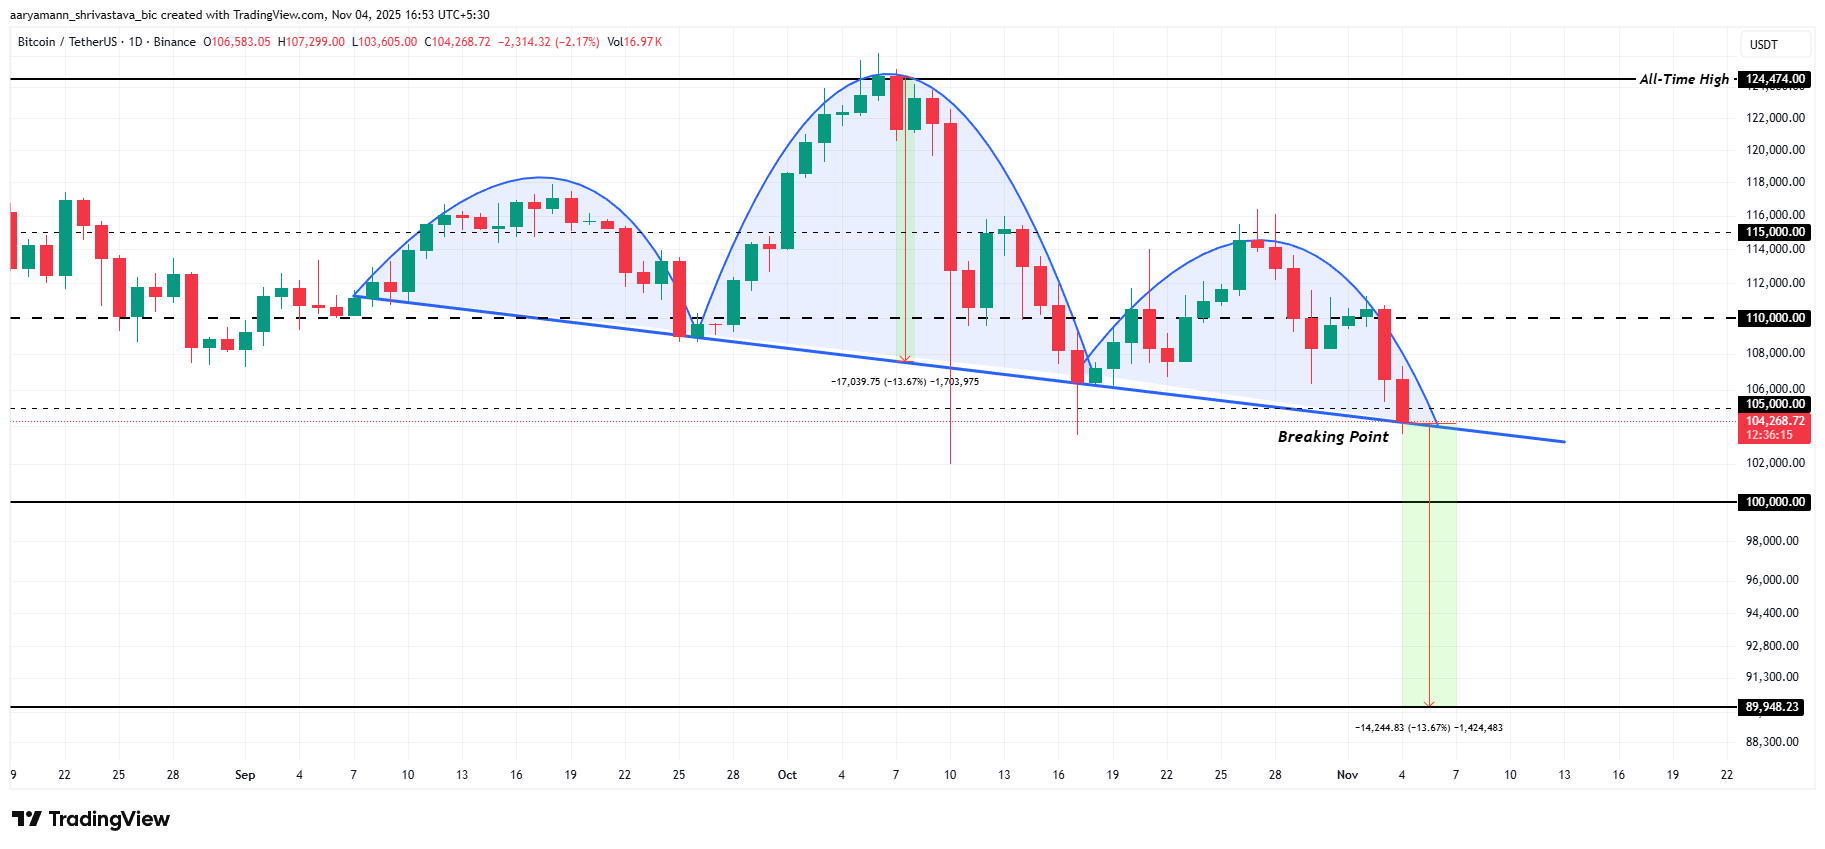
At press time, Bitcoin trades at $104,268, having slipped below the $105,000 support level. However, it has been holding above the $100,000 which it has since May this year.
Nevertheless, the crypto king continues to trace the head and shoulders pattern, which historically precedes a bearish breakdown.
If the pattern confirms, it could result in a 13.6% drop from its neckline, pushing Bitcoin toward $89,948. Combined with weakening inflows and potential EMA crossover, the risk of a sub-$100,000 correction appears high in the short term.
However, a quick recovery could still prevent this outcome. If Bitcoin finds investor support and reclaims $105,000 as a stable floor, it could rebound toward $110,000. Surpassing this resistance would invalidate the bearish outlook and restore short-term market confidence.
