Cardano (ADA) Highlights
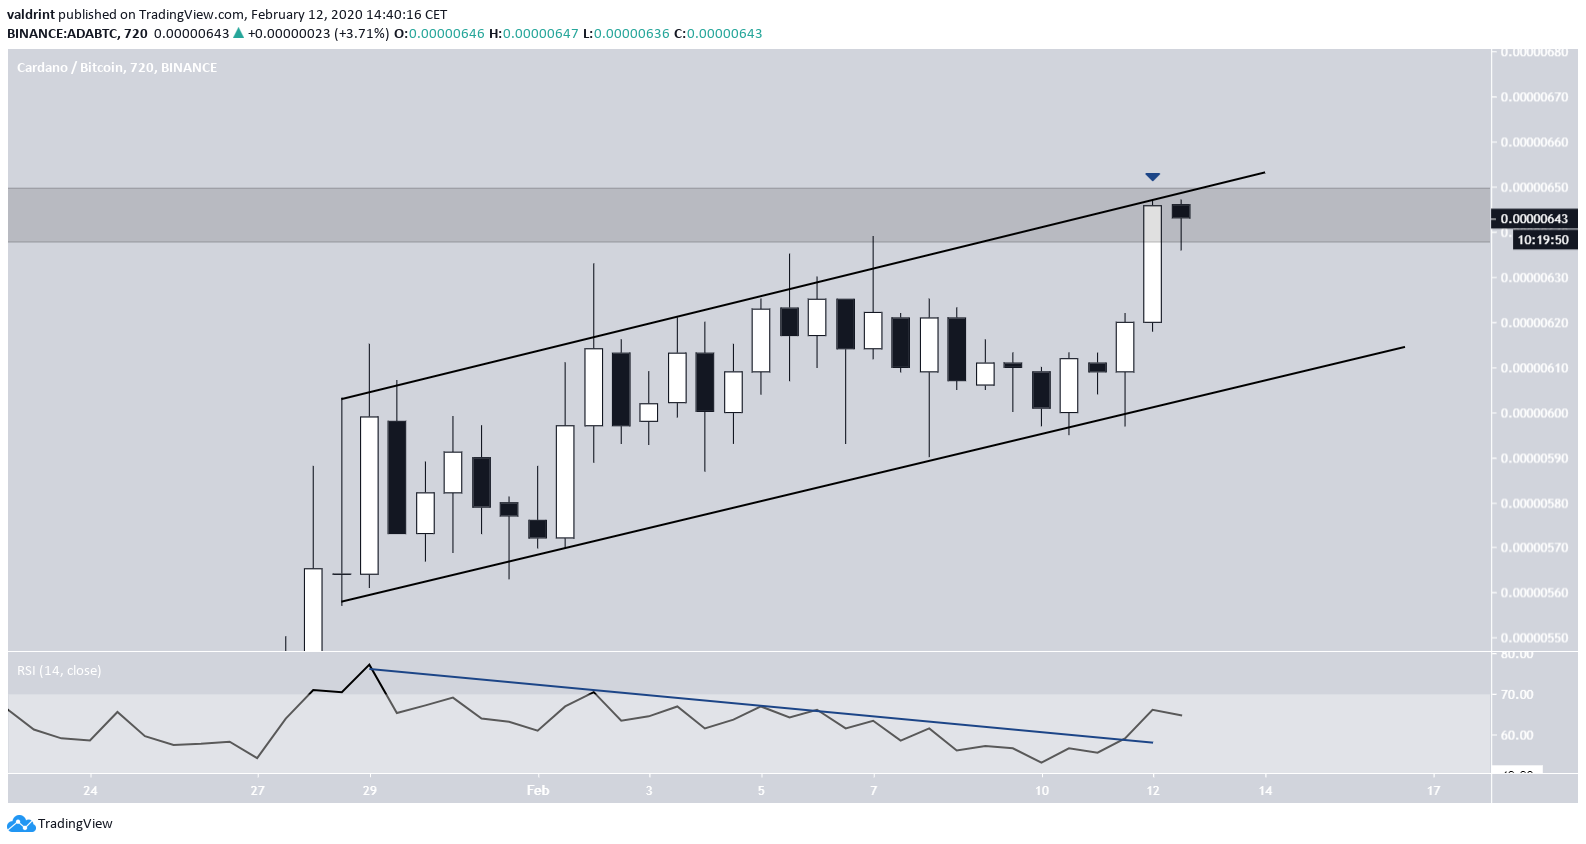
- ADA is trading inside an ascending channel.
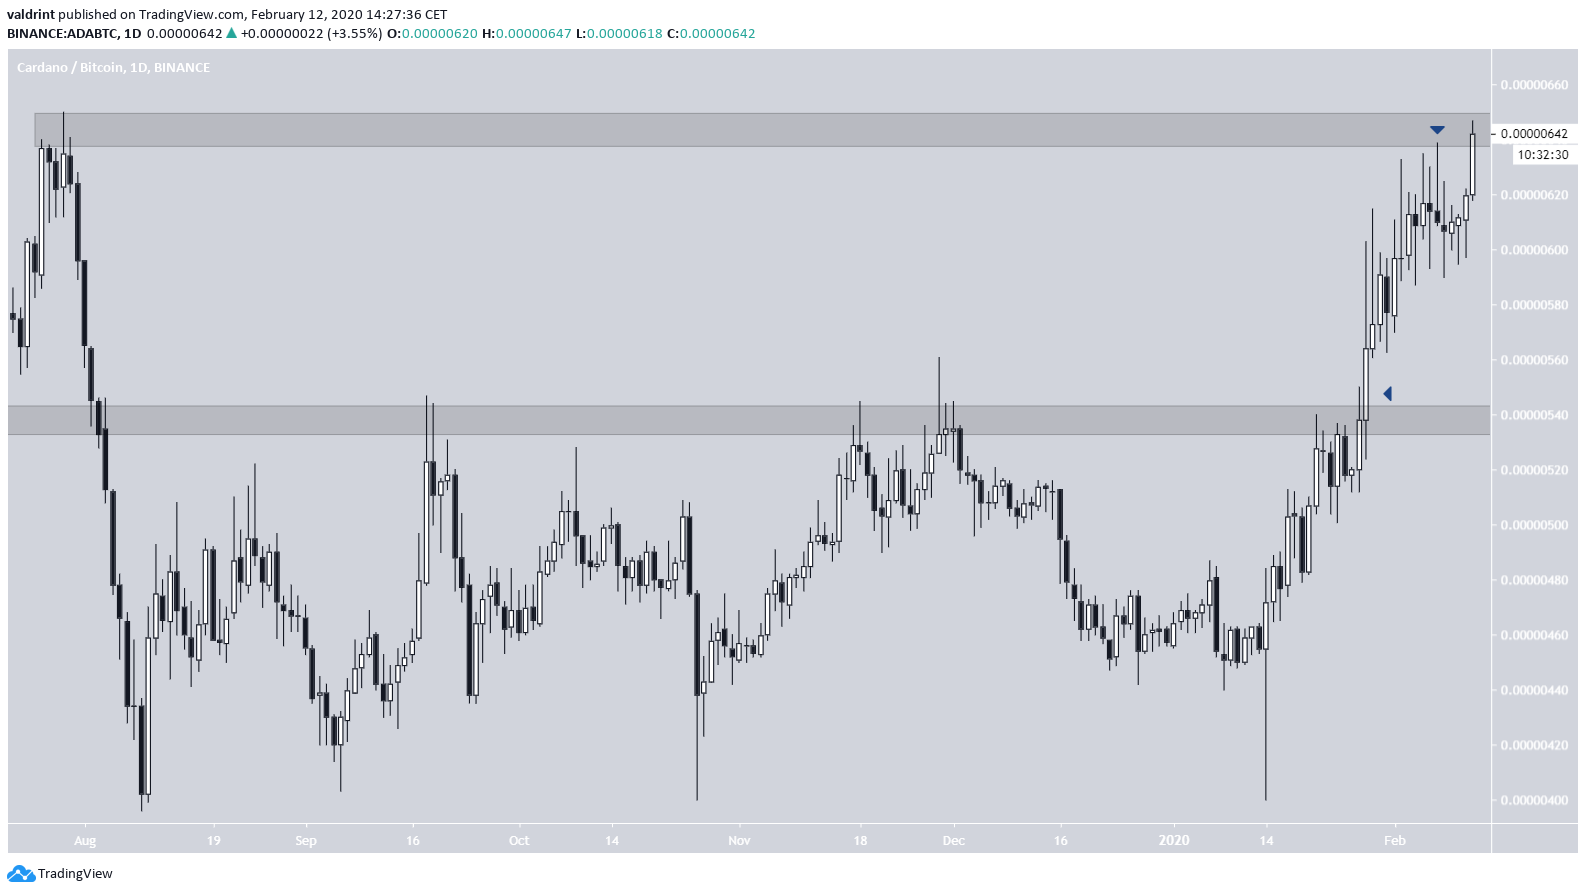
- There is resistance at 640 satoshis.
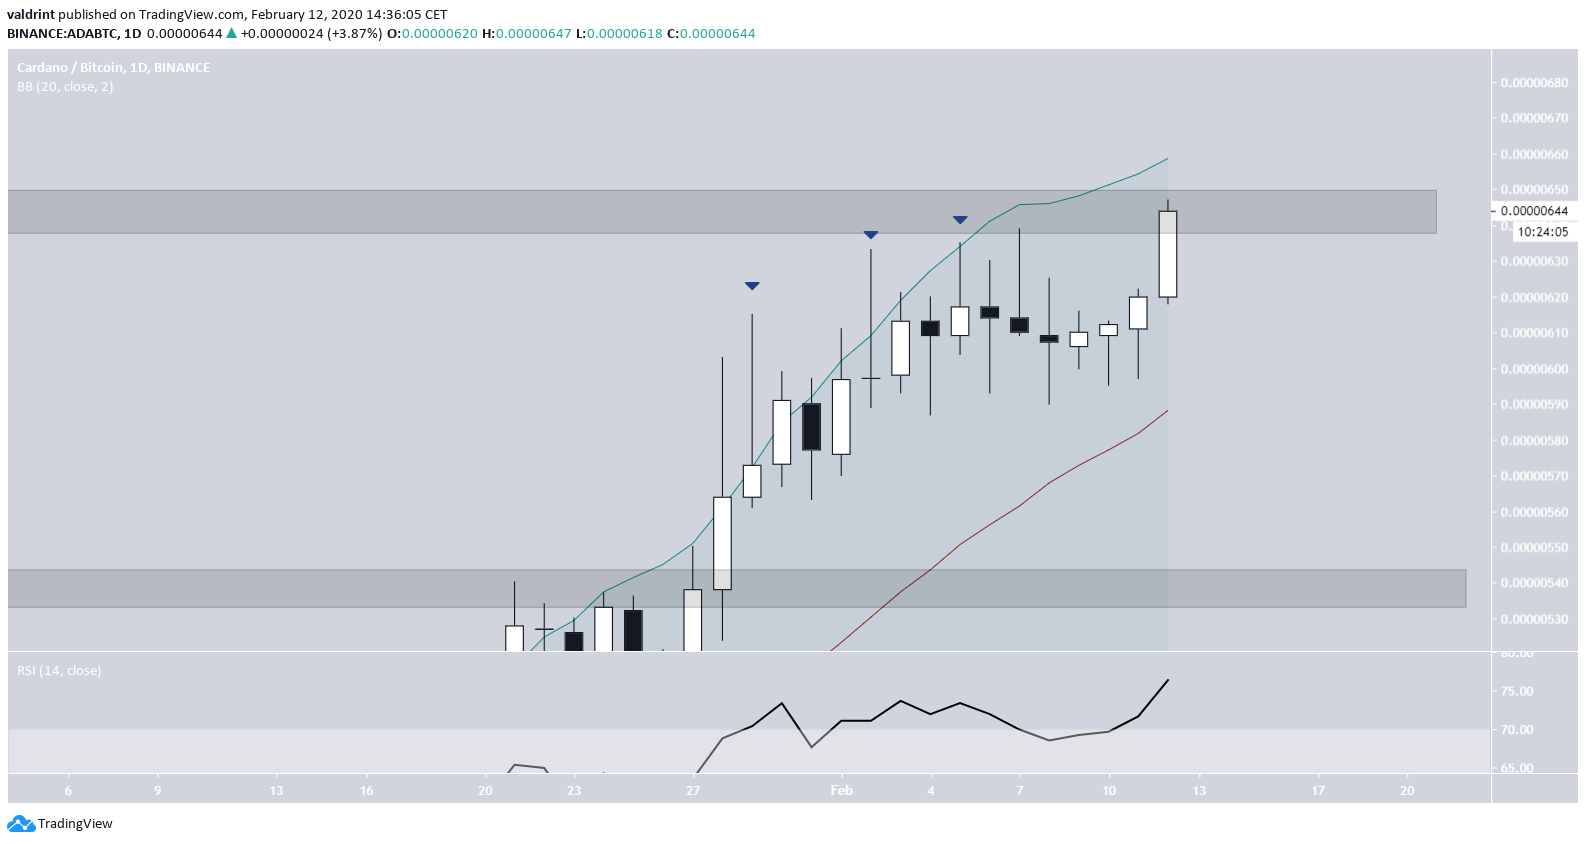
- Technical indicators have yet to show any weakness.
-Will the ADA price be successful in breaking out? -Is it more profitable to buy into resistance or wait for the flip? Keep reading below if you are interested in finding out.$ADA
— Posty (@PostyXBT) February 12, 2020
I'm ready for the break out here.
You know I'm bullish when I start setting bids below resistance rather than waiting for the flip.
Sometimes when things are this bullish, we miss the flips.
Disclaimer – I don't go all in below resistance. pic.twitter.com/d1H50kKkBM
Current Breakout
On January 28, the ADA price broke out from the 540 satoshi resistance area and has been increasing since. At the time of writing, it was trading inside the closest resistance area, which is found at 640 satoshis. The price has been at this level several times since February 8 but has failed to reach a close above it. If the daily were to close at the current level or higher it would mark the highest price close since July 2019. There were several hours left until the daily close, so it is possible that the price creates a similarly long upper wick and decreases towards support. Technical indicators have not shown any weakness that would suggest the price will decrease.
While the daily RSI is overbought, it has yet to generate any bearish divergence. In addition, the previous wick highs near the resistance line were outside of the scope of the upper Bollinger band, something that is not the case currently.
So, we are presuming that the price is in an upward trend.

Ascending Channel
In the short-term, the ADA price is trading inside an ascending channel. It is currently right at the confluence of the resistance line of the channel and the resistance area. While there was a bearish divergence in the RSI, it recently broke out from its descending trend-line, which negates it to a degree.
ADA Trade Setups
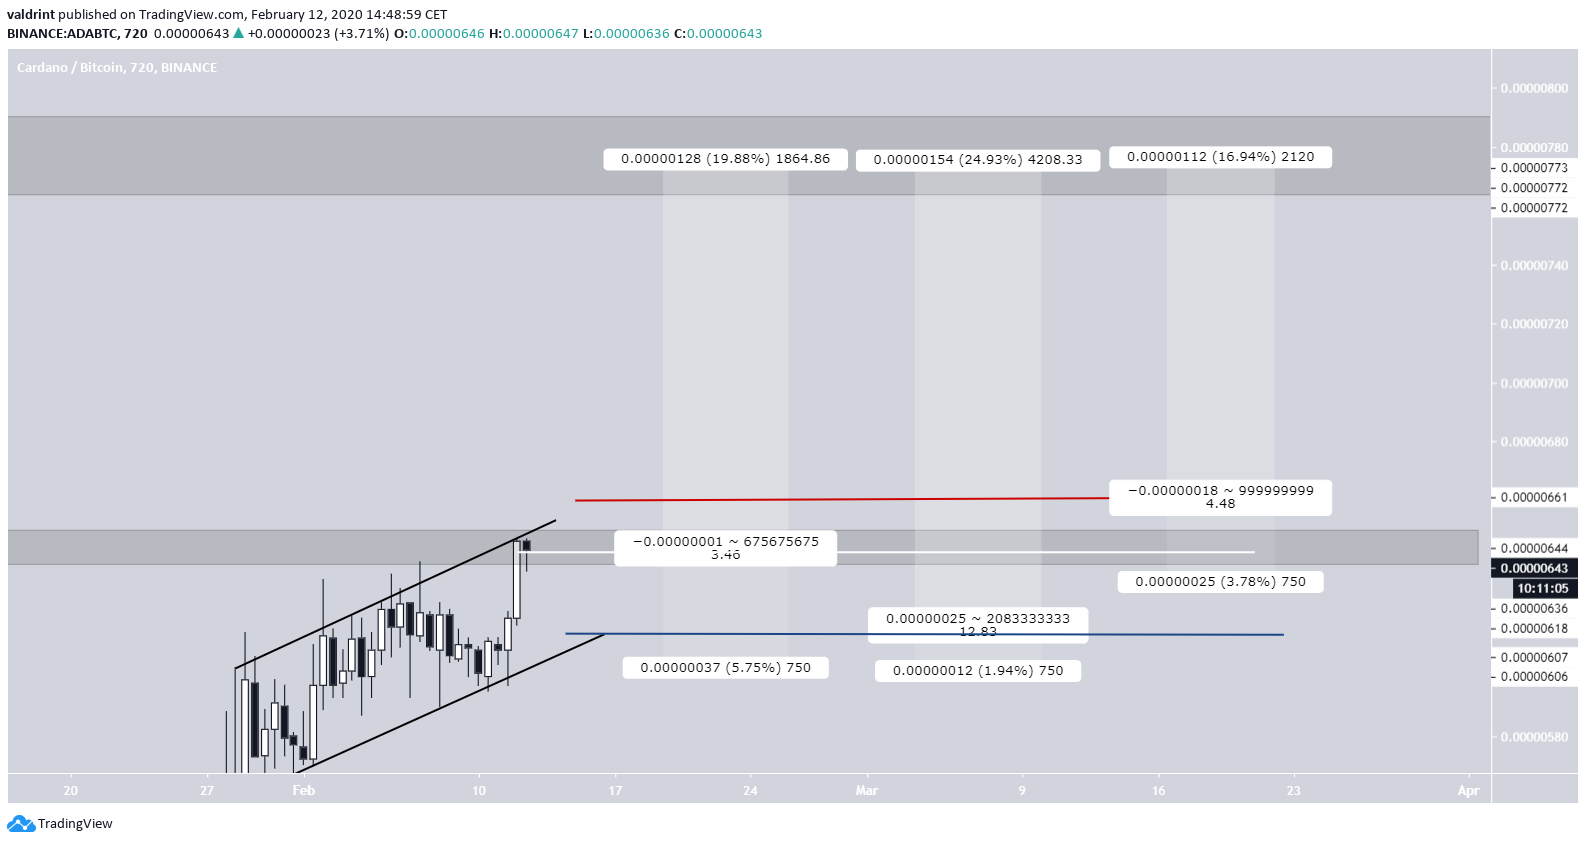
The tweet states that @PostyXBT wants to enter the trade prior to breaking out from the resistance. That would mean entering near 645 satoshis (white line). Using a target at the next resistance area at 770 satoshis, that would be a 20% increase from the current price. One issue with this using this entry point would be that the optimal level to place a stop loss would be below the ascending support line at 606 satoshis, an almost 6% below the current price. Another method would be to wait until the ADA price falls to the ascending support line. While this is not certain to occur, it would present the highest R:R ratio since the stop loss of 606 satoshis is only 2% below the entry price (blue line). So, while losses would be limited, you risk the chance of missing out on additional profits. The final method would be to wait until the price breaks out and attempt to buy the retracement at around 665 satoshis (red line). In this case, the stop loss would be moved upwards below the breakout level at 634 satoshis. The full setup is posted in the table below:
| Strategy | Entry | Stop Loss | Target | Risk:Reward |
| Buy Immediately | 645 | 606 | 770 | 3.5 |
| Wait For Decrease | 615 | 606 | 770 | 12.8 |
| Buy After Breakout | 665 | 636 | 770 | 4.5 |
Disclaimer
In line with the Trust Project guidelines, this price analysis article is for informational purposes only and should not be considered financial or investment advice. BeInCrypto is committed to accurate, unbiased reporting, but market conditions are subject to change without notice. Always conduct your own research and consult with a professional before making any financial decisions. Please note that our Terms and Conditions, Privacy Policy, and Disclaimers have been updated.

