


The IOTA price has made another unsuccessful attempt to break out above a yearlong resistance area. Until the price successfully does so, we cannot state that the trend is bullish.
Unsuccessful Breakout Attempt
Cryptocurrency trader @ACXtrades stated that he is waiting for a re-test of the breakout level at 3500 satoshis, giving a target of 54% above the current price.
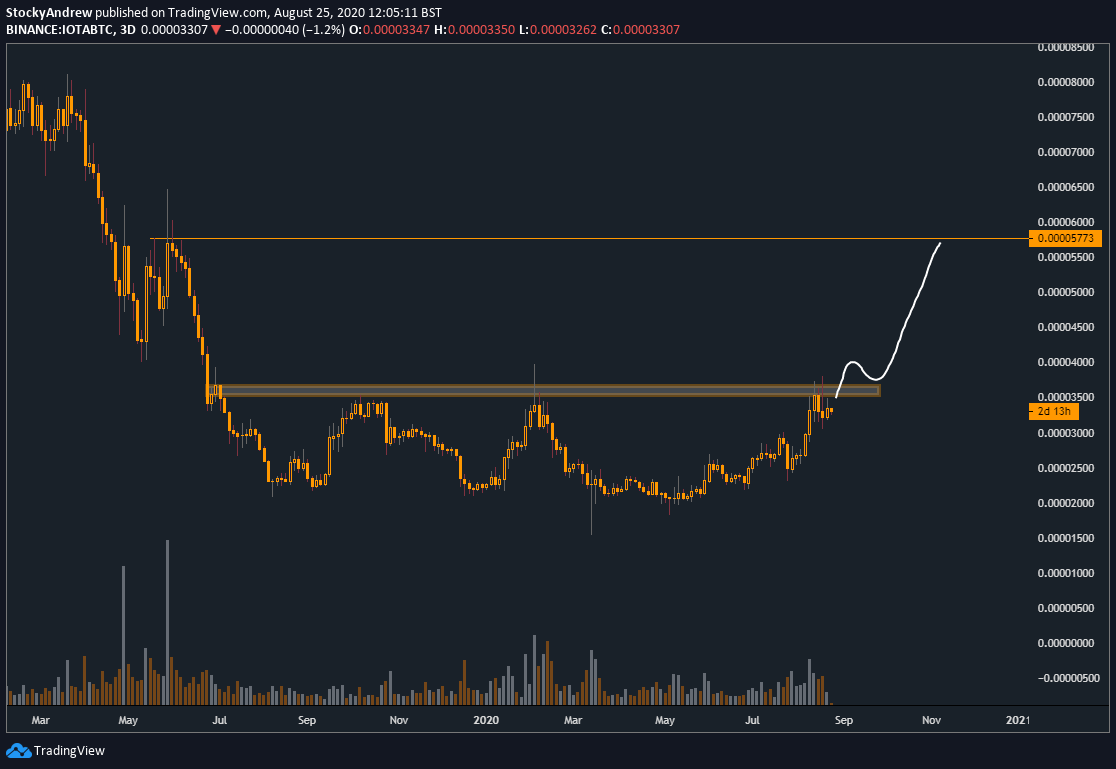
However, the price failed to break out above the aforementioned 3500 satoshi resistance area, and instead fell back below it.
This is a bearish sign, both because IOTA could not sustain the higher prices and because it’s the third time that the price has failed to close above this level. The resistance area has stood since September 2019.
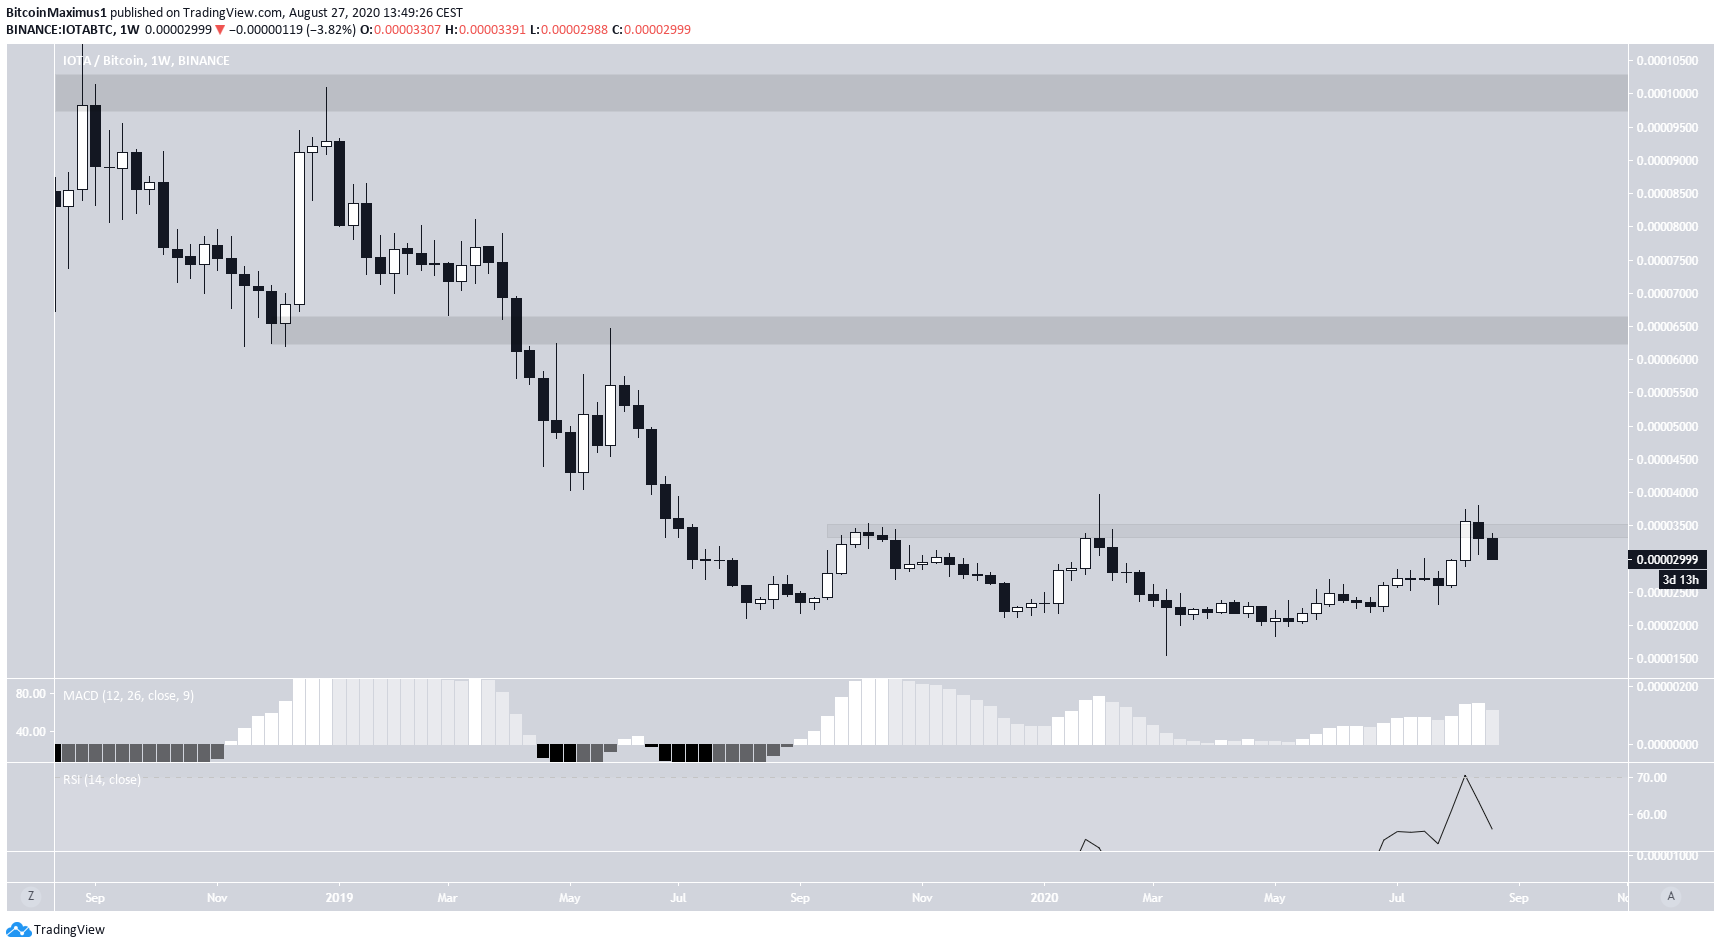
However, technical indicators have yet to show any weakness. Both the RSI and MACD are increasing, and there is no bearish divergence in place.
If the price were to break out, the next closest resistance areas would be found at 6500 and 10,000 satoshis, respectively.
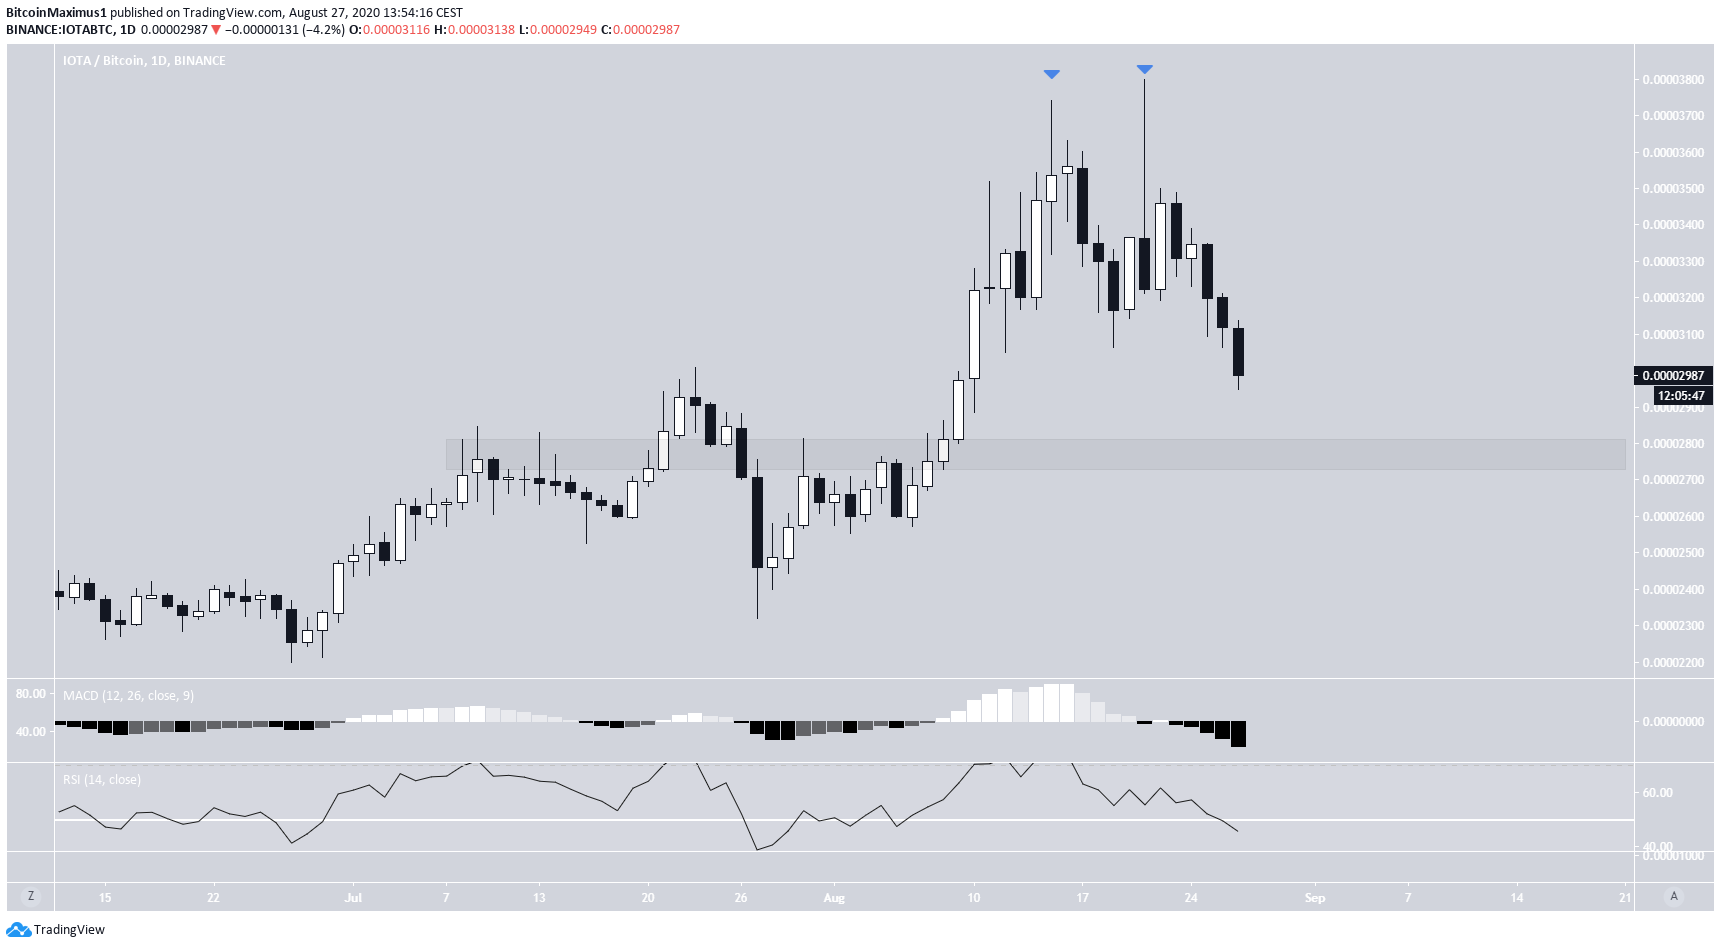
IOTA Double Top Leads to a Fall
The daily chart shows a completed double top on August 21 and 25, the latter of which had a very long upper wick. The double top is a bearish reversal pattern.
The price has been falling since August 25, and technical indicators are bearish. both the MACD and the RSI are declining, and neither is oversold nor have they formed any bullish divergence.
Therefore, the price should decrease at least to the closest support area at 2800 satoshis, before possibly bouncing.
The shorter-term chart shows that the previously-mentioned 2800 satoshi support area is also the 0.618 Fib level of the entire upward move, making it a likely spot for a reversal.
However, there are no reversal signs yet, and the price is following a descending resistance line. A breakout from the line would indicate that the corrective period for IOTA is over, and the price might make another attempt to break out above 3500 satoshis.
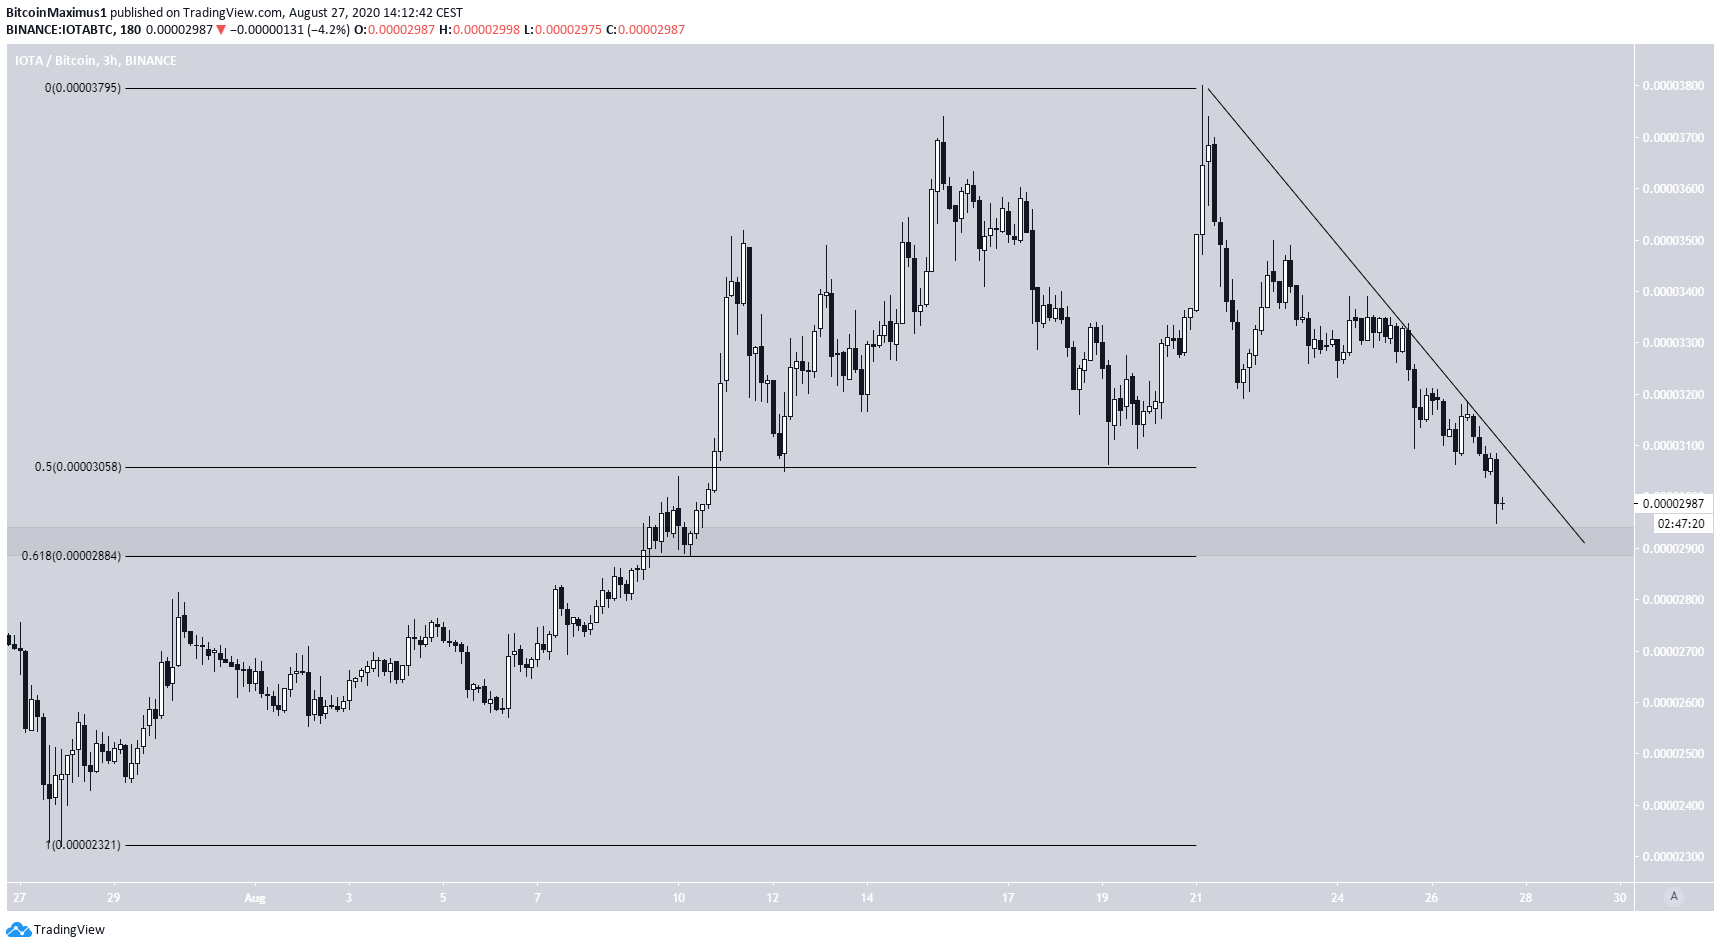
To conclude, the IOTA price looks primed for a short-term bounce, but the trend is not bullish until the price breaks out above the long-term 3500 satoshi resistance area.


