


In this article, BeInCrypto takes a look at the seven altcoins that decreased the most over the past seven days, more specifically from Dec 3 – 10.
These altcoins are:
- Qtum (QTUM) : -31.17%
- THORChain (RUNE) : -30.11%
- Fantom (FTM) : -29.84%
- Internet Computer (ICP) : -28.55%
- THETA (THETA) : -28.36%
- Harmony (ONE) : -27.85%
- Chiliz (CHZ) : -27.18%
QTUM
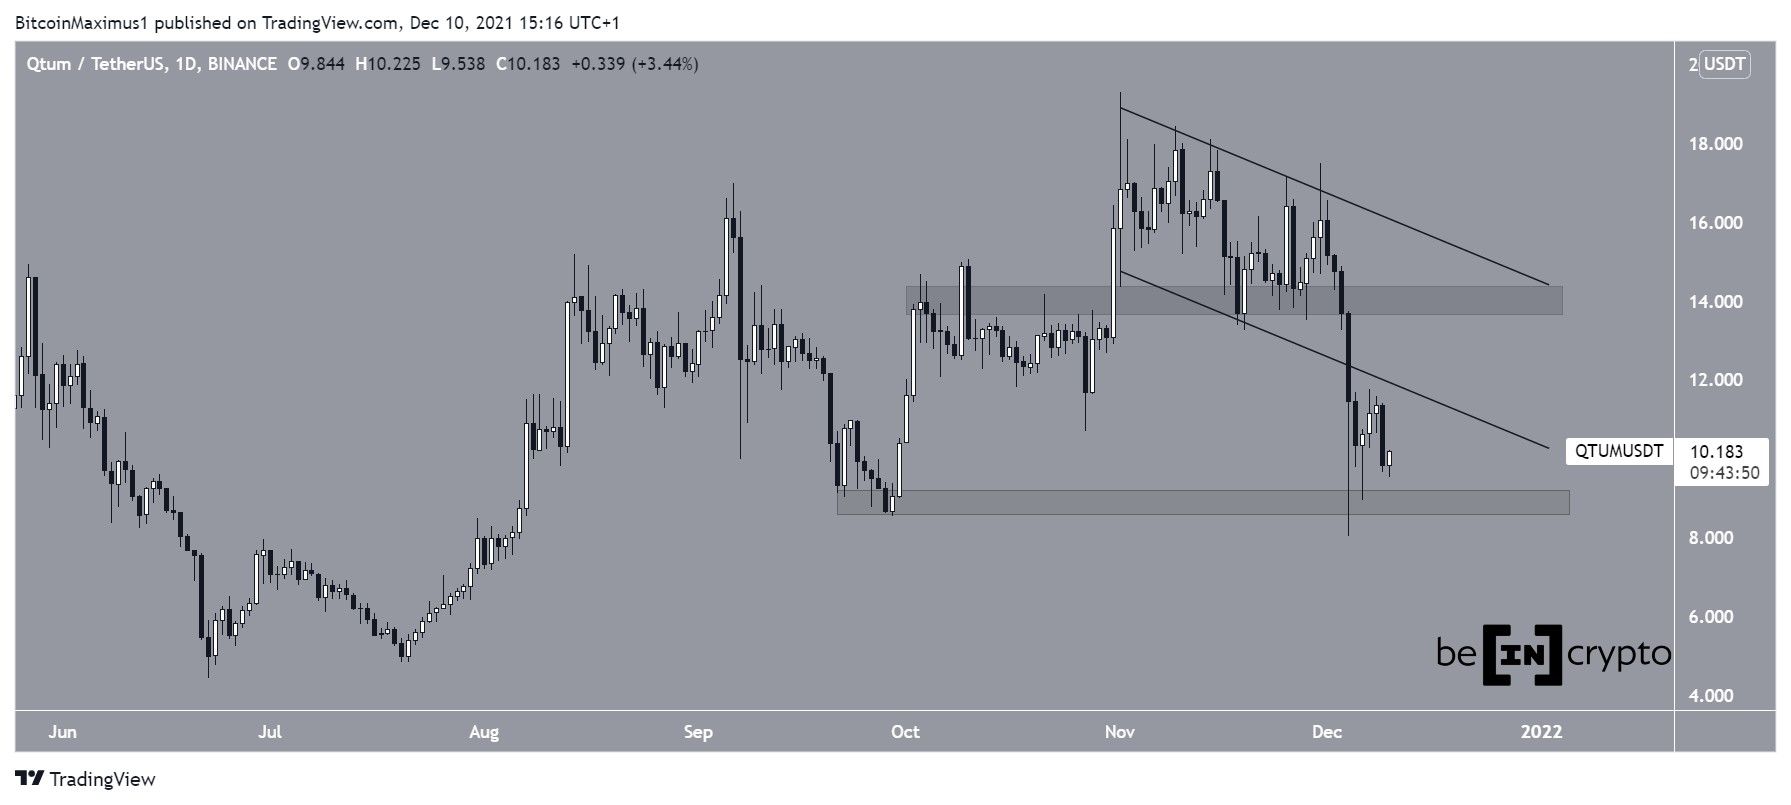
On Oct 31, QTUM purportedly broke out from the $14.10 horizontal area. This led to a high of $19.30 the next day. Afterwards, the token began a gradual descent inside a descending channel.
However, on Dec 4, it broke down from both the $14.10 area and the channel, falling to a low of $13.25.
While it has bounced since, the upward movement has not been significant. Both the previous support line of the channel and the $14.10 area are expected to act as resistances if QTUM continues to increase.
RUNE
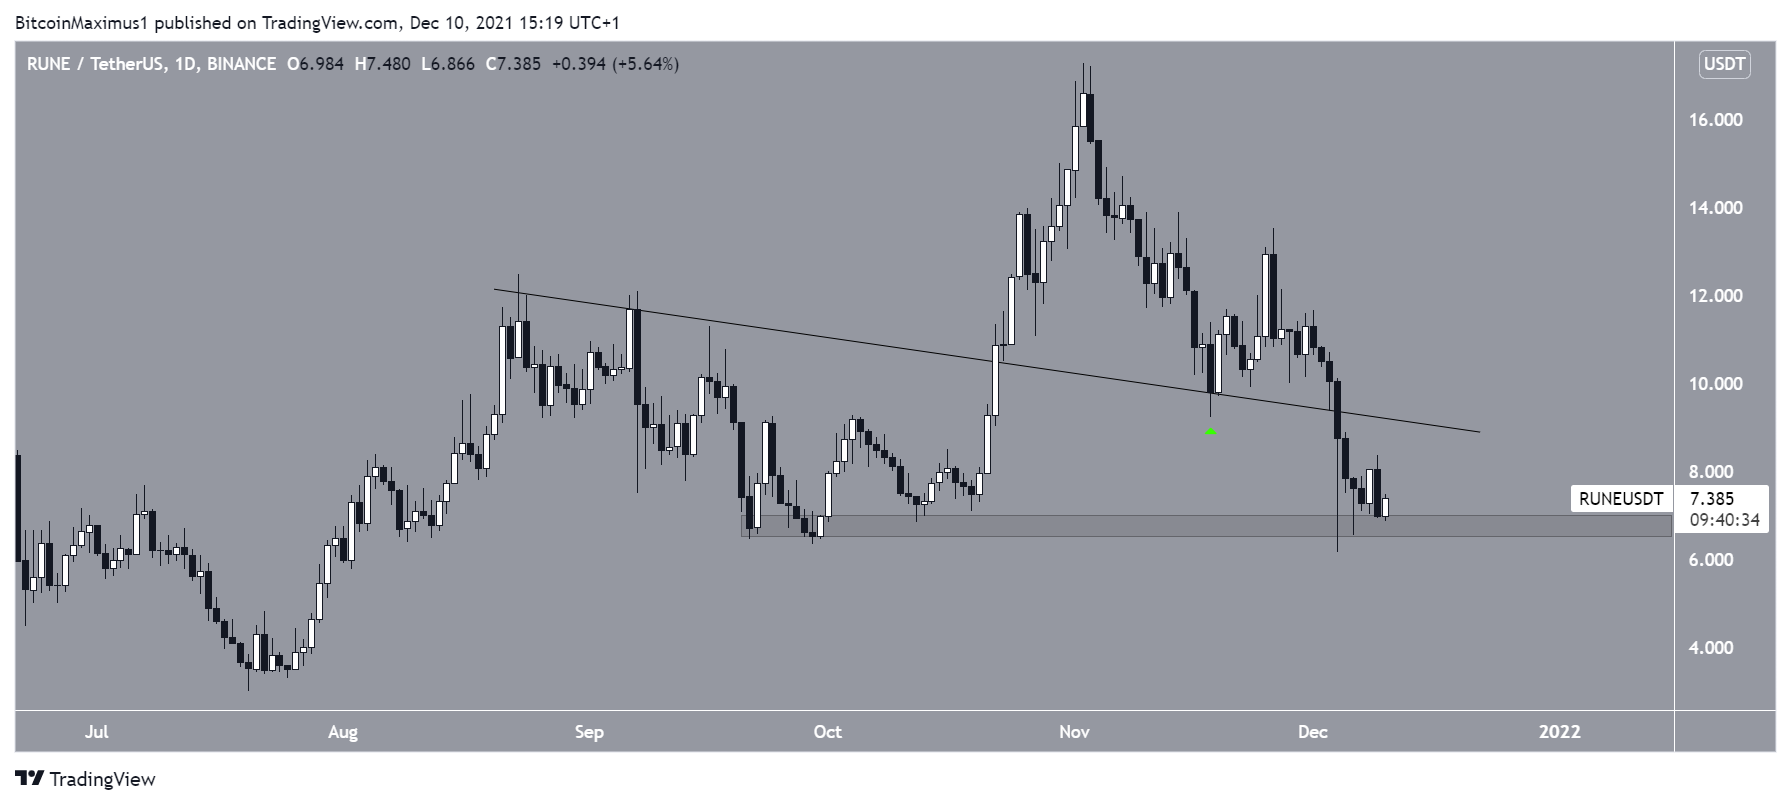
On Oct 22, RUNE broke out from a descending resistance line. It proceeded to reach a high of $17.27 on Nov 2.
However, it has been falling since. While it initially bounced above the previous resistance line (green icon), it broke down below it on Dec 4.
Currently, the token is hovering just above the $7.15 horizontal area. The descending line is expected to act as resistance once more.
FTM
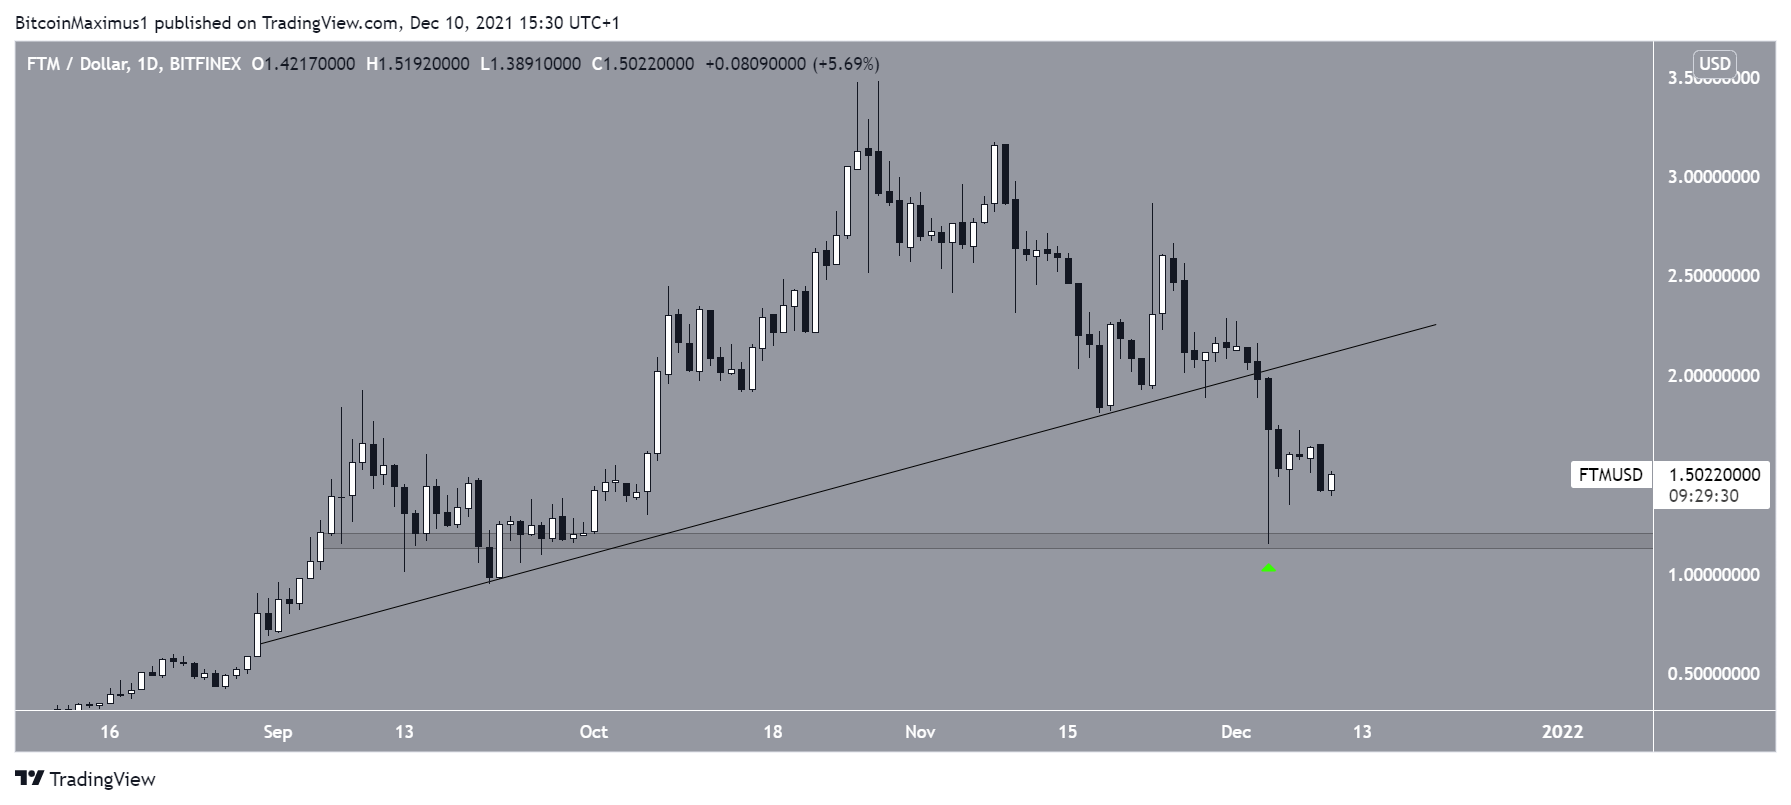
FTM has been decreasing since Oct 28, when it reached a high of $3.48. On Dec 3, it broke down from an ascending support line, and reached a low of $1.14 the next day.
The ensuing bounce served to validate the $1.15 area as support. It also created a long lower wick, which is considered a sign of buying pressure.
ICP
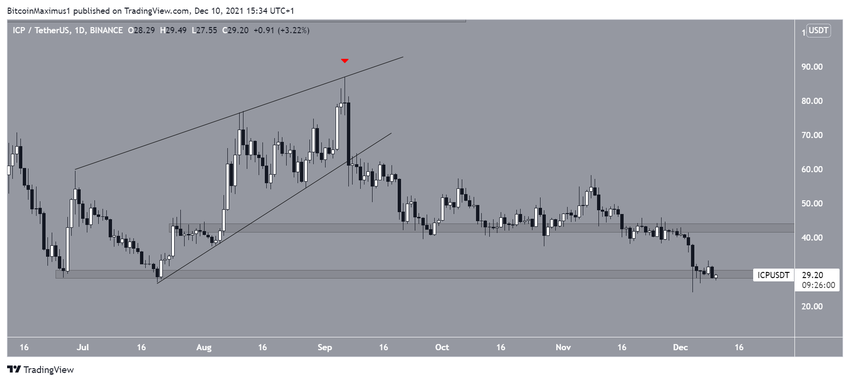
ICP has been falling since Sept 6 (red icon), when it had just reached a high of $87.
The next day, it broke down from an ascending wedge. While it initially managed to hold on above $42, it broke down from this area on Nov 16.
On Dec 4, the token reached a new all-time low of $24. However, the ensuing bounce took it back above the $30 horizontal support area.
Whether ICP manages to hold on above this area or breaks down will likely determine the direction of the future trend.
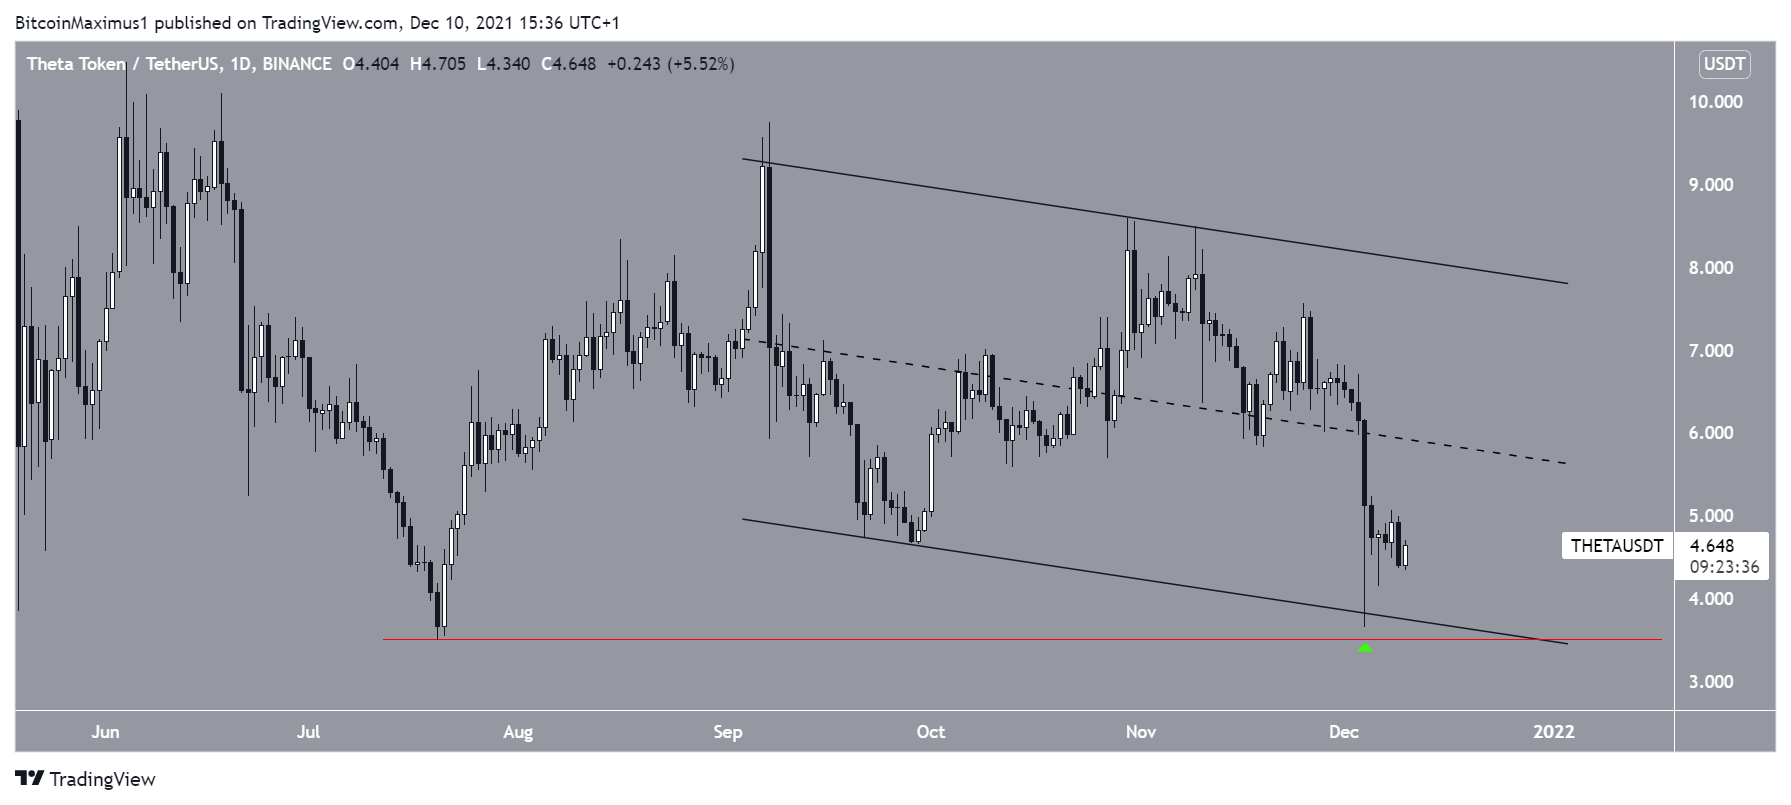
THETA
THETA has been decreasing inside a descending channel since Sept 7. On Dec 4, it reached a low of $3.65. The ensuing bounce served to validate the support line of the channel and create a long lower wick (green icon).
More importantly, THETA has yet to fall below its July lows at $3.49. This means that it is possible that the bullish structure is still intact.
A reclaim of the middle of the channel at $5.50 would be an extremely bullish development that would suggest an eventual breakout is likely.
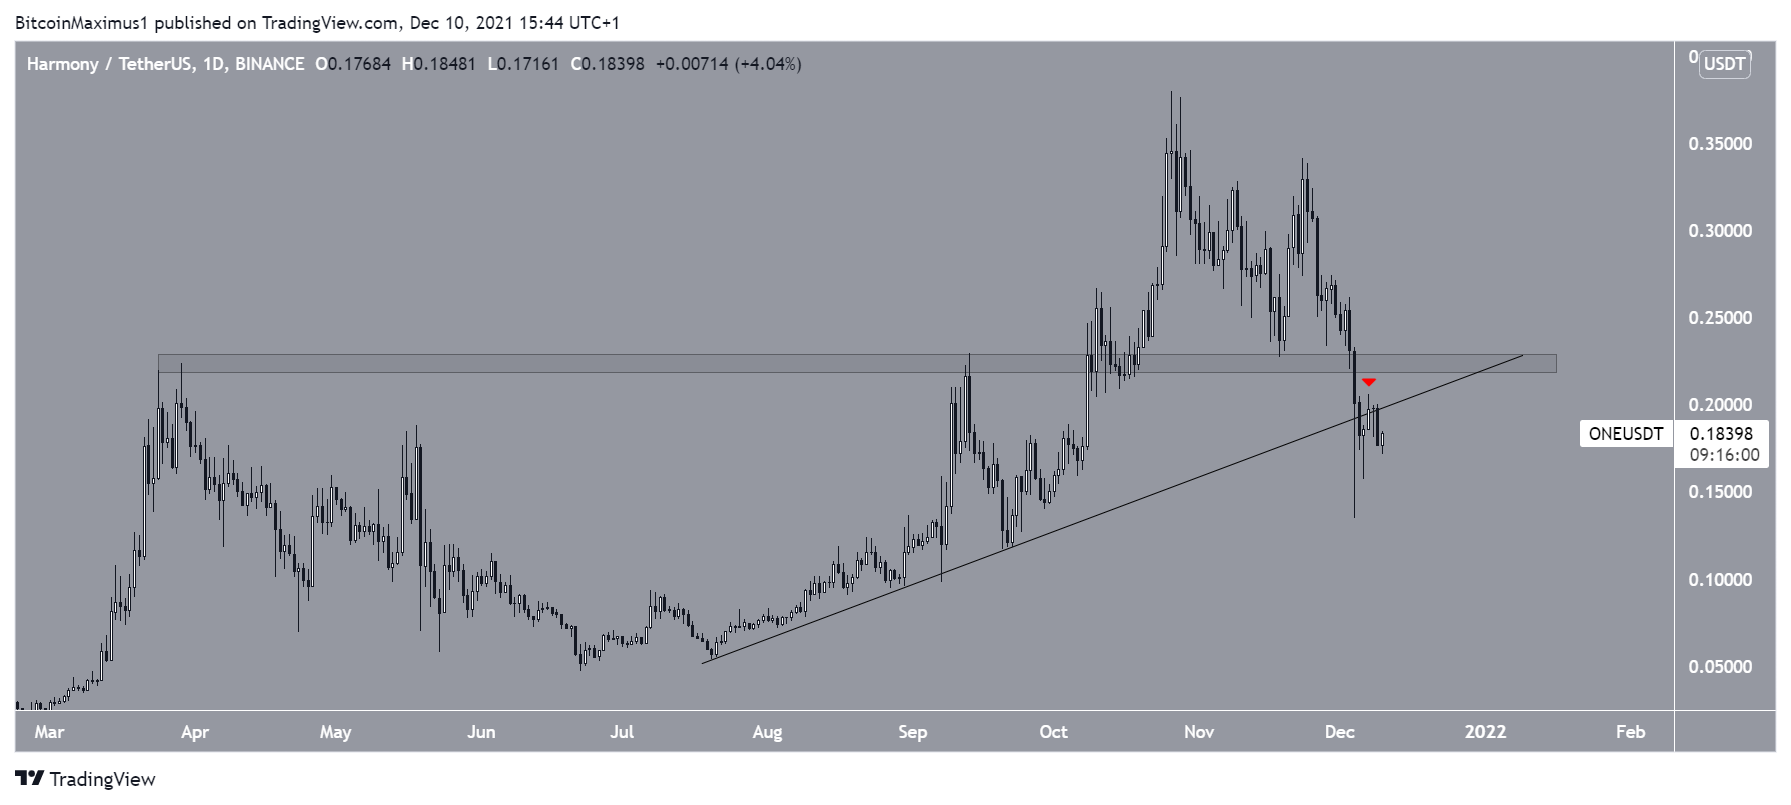
ONE
ONE has been falling since Oct 26, when it reached an all-time high price of $0.38. On Dec 4, the rate of decrease accelerated and the token broke down from both the $0.22 horizontal are and an ascending support line.
The breakdown was crucial, since the area had previously acted as the all-time high resistance, while the support line had been in place since July 20.
Since the breakdown, ONE has validated the previous support line as resistance (red icon). Until this line is reclaimed, the trend cannot be considered bullish.
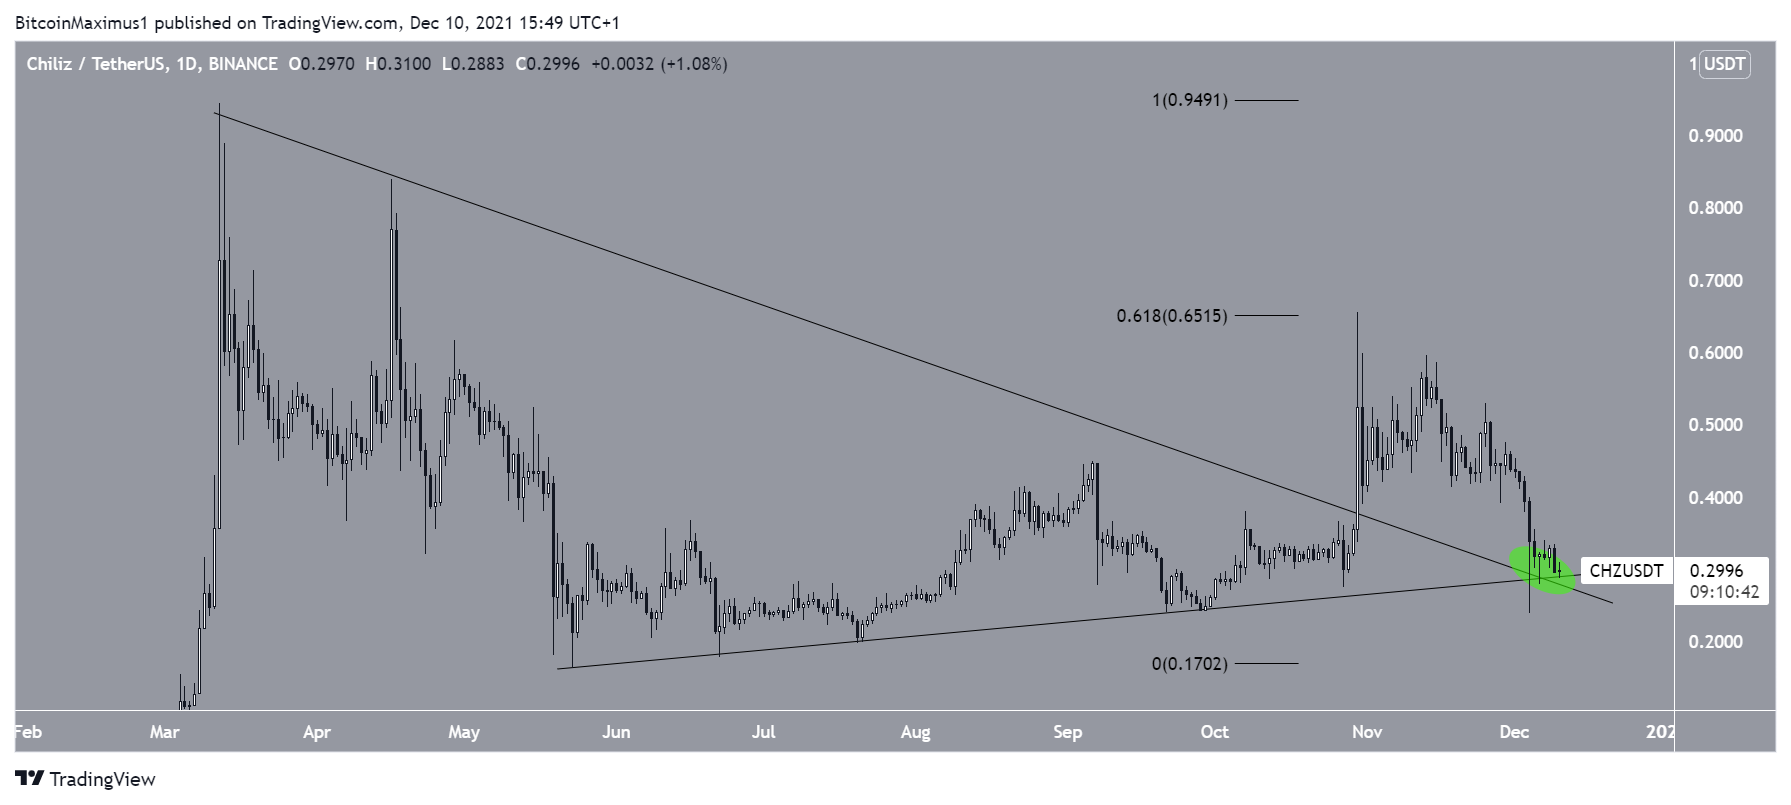
CHZ
CHZ has been falling since reaching a high of $0.65 on Oct 31. The high was made right at the 0.618 Fib retracement resistance level.
Despite the considerable drop, CHZ has bounced at a confluence of support levels (green circle), created by a long-term ascending support line and the previous descending resistance line.
Therefore, the bullish structure still remains intact.
For BeInCrypto’s latest Bitcoin (BTC) analysis, click here.
