


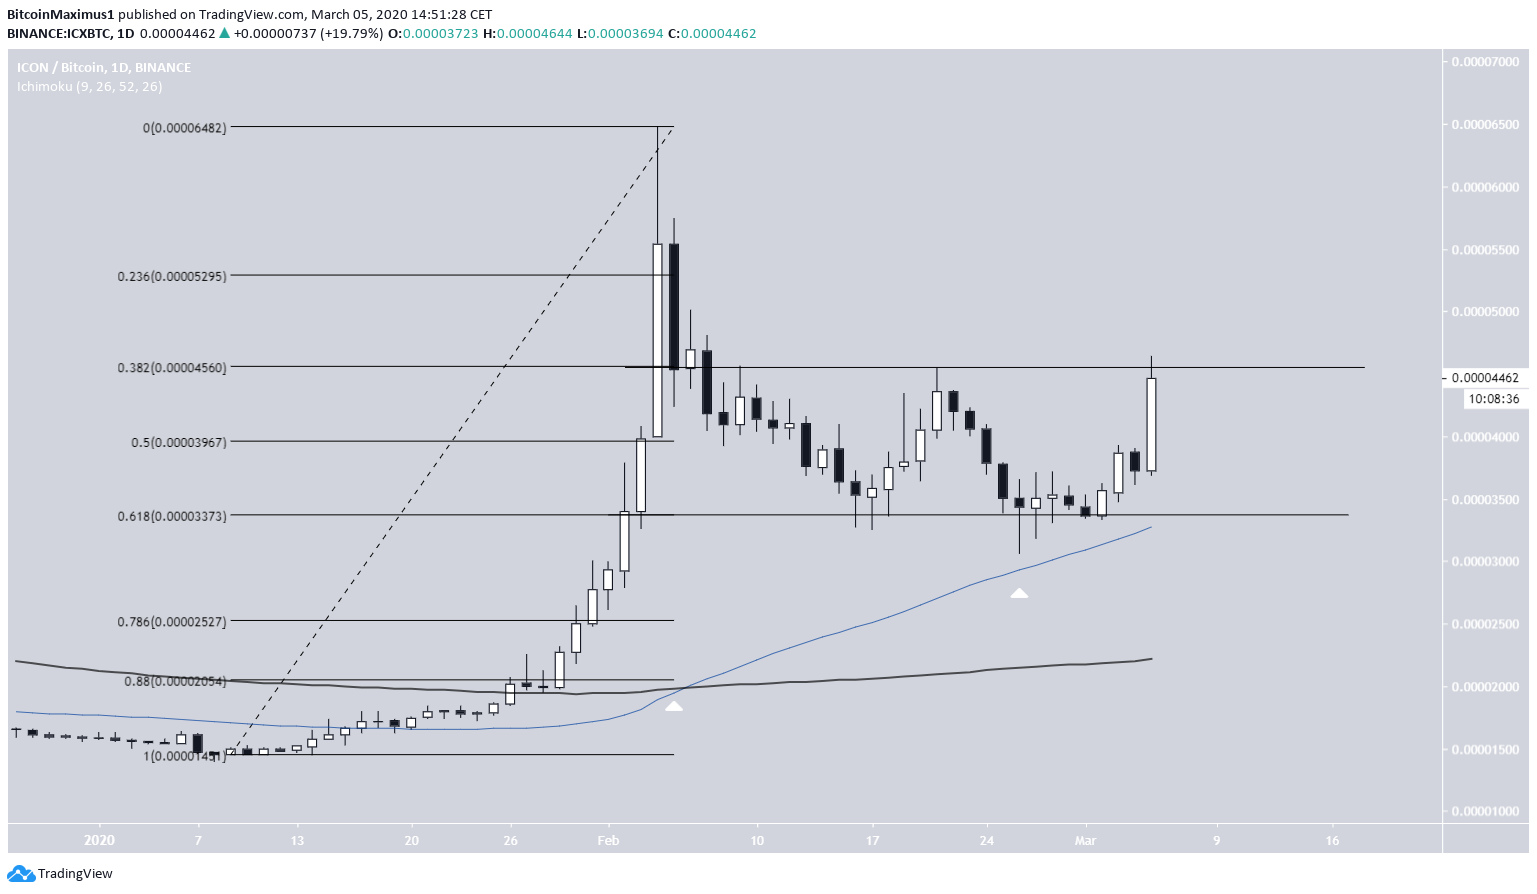
The ICX price has been trading in a range since Feb. 6. It reached the bottom of the range on Feb. 26 and began an upward move toward the range high. On March 5, the price created a massive bullish engulfing candlestick.
ICON (ICX) Price Highlights
- ICX is trading in a range between 3,350 and 4,550 satoshis.
- A golden cross has transpired on Feb. 5.
- There is major support at 3,000 satoshis.
- There is resistance at 5,500 satoshis.
On March 5, the South Korean National Assembly passed regulation that resulted in a restructuring of cryptocurrency exchanges, with the aim of reducing money laundering. ICX, which is a coin based in South Korea, known by some as the “South Korean Ethereum” pumped shortly after. This was noted by crypto trader @CryptoNTez, who outlined an ICX chart that shows a massive bullish engulfing candle measuring an almost 30% increase.
$ICX
Falling wedge breakout followed by South Korea legalizing Crypto (🍀) https://t.co/TRxLZYeBxr …Currently up almost 30% as it crossed over ~4000 sats resistance
While a retest & potential R/S may happen (entry), I would expect continuation toward ~5200sats
UCTS 🚀#ICX pic.twitter.com/pdY9YG243z— Nico (@CryptoNTez) March 5, 2020
How long will the ICX increase continue? What is the next target for the price to reach? Continue reading below if you are interested in finding out.
Trading Range
On Feb. 4, the ICX price reached a high of 6,479 satoshis but began a rapid decrease the very next day. The price reached the 0.618 Fib level at 3,350 satoshis on Feb. 7 and revisited it on Feb. 17, creating a double bottom. Afterward, it began to increase and created a bullish engulfing candlestick on March 5. These characteristics are akin to a bullish formation and suggest that the price will move upward.
Currently, ICX is trading in a range of between 3,350 and 4,550 satoshis, which are the 0.618 and 0.382 Fib levels of the entire upward move.
On another positive note, a bullish cross between the 50- and 200-day moving averages (MA) transpired on Feb. 3. The former is providing support to the price. Let’s take a closer look at a different time-frame in order to determine whether the price will break out from this range.
Long-Term Breakout
The weekly chart gives us two additional important areas, being found at 3,000 satoshis (support) and 5,500 satoshis (resistance).
The price has broken out above the 3,000 satoshi area with very significant volume and validated it as support afterward. Therefore, the customary movement would be another attempt at breaking out above 5,500 satoshis, aligning with the daily chart.
However, the 5,500 satoshi area is the previous breakout level, so we cannot confidently make a prediction that the price will break out above it.
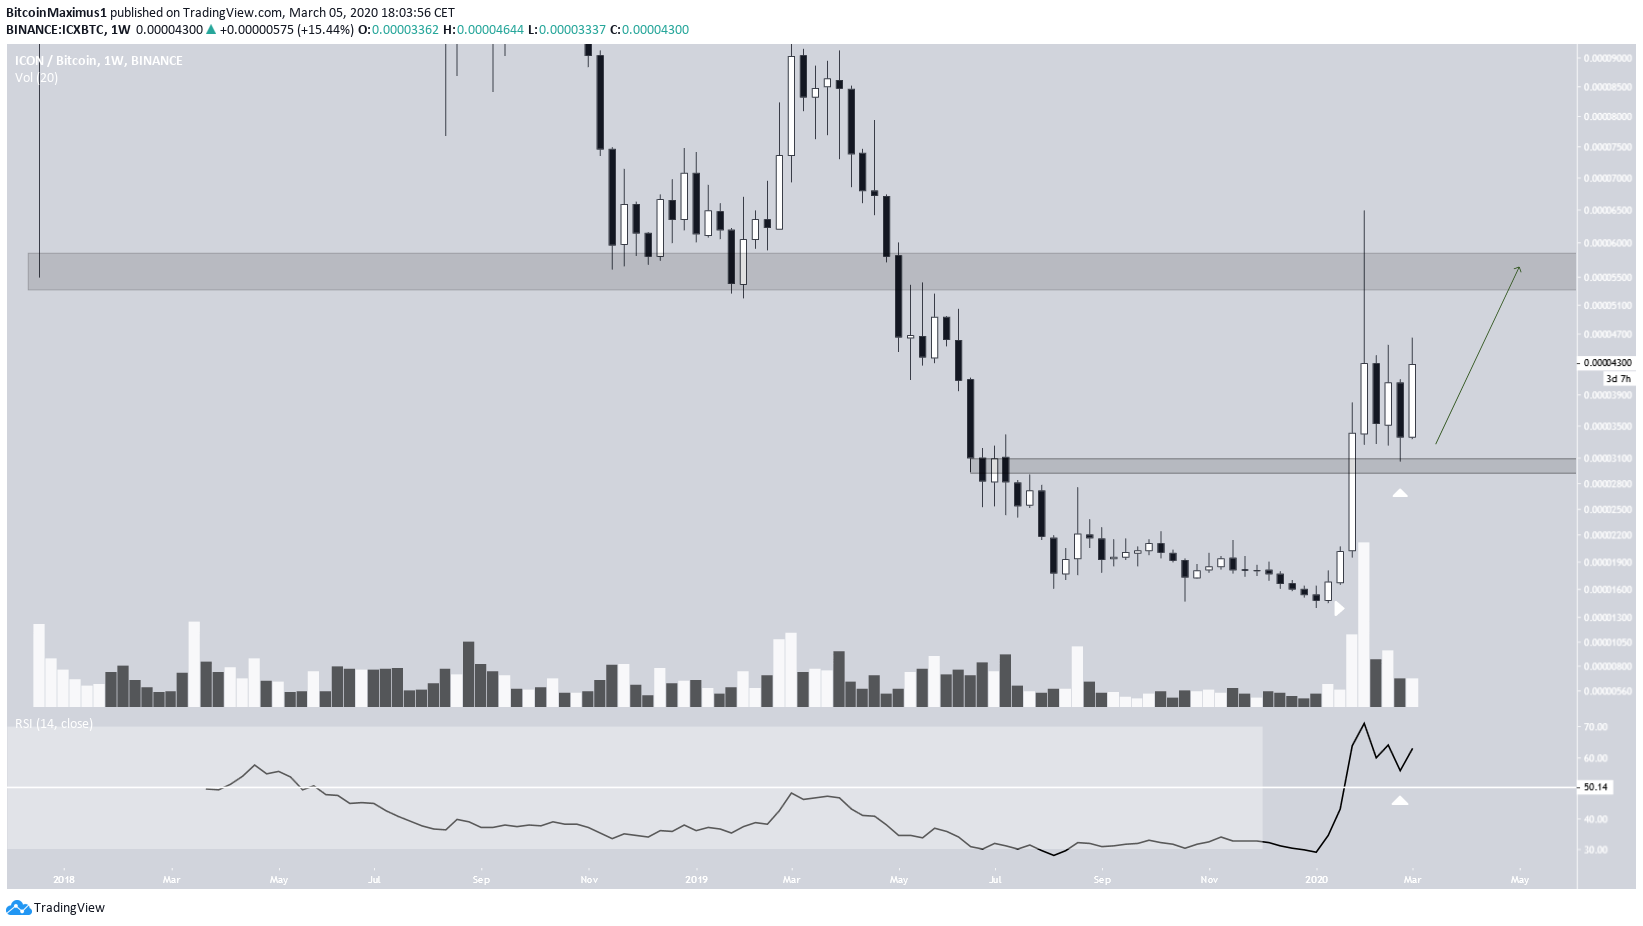
To conclude, the ICX price has broken out above a significant resistance area and validated it as support afterward. The price is expected to test the 5,500 satoshi resistance area once more.


