


The Icon (ICX) price is struggling to break out above the $3.10 long-term resistance area. It has been attempting to do so, over the past two months.
Currently, ICX is trading inside a short-term bullish pattern, from which a breakout is expected.
Long-term ICX movement
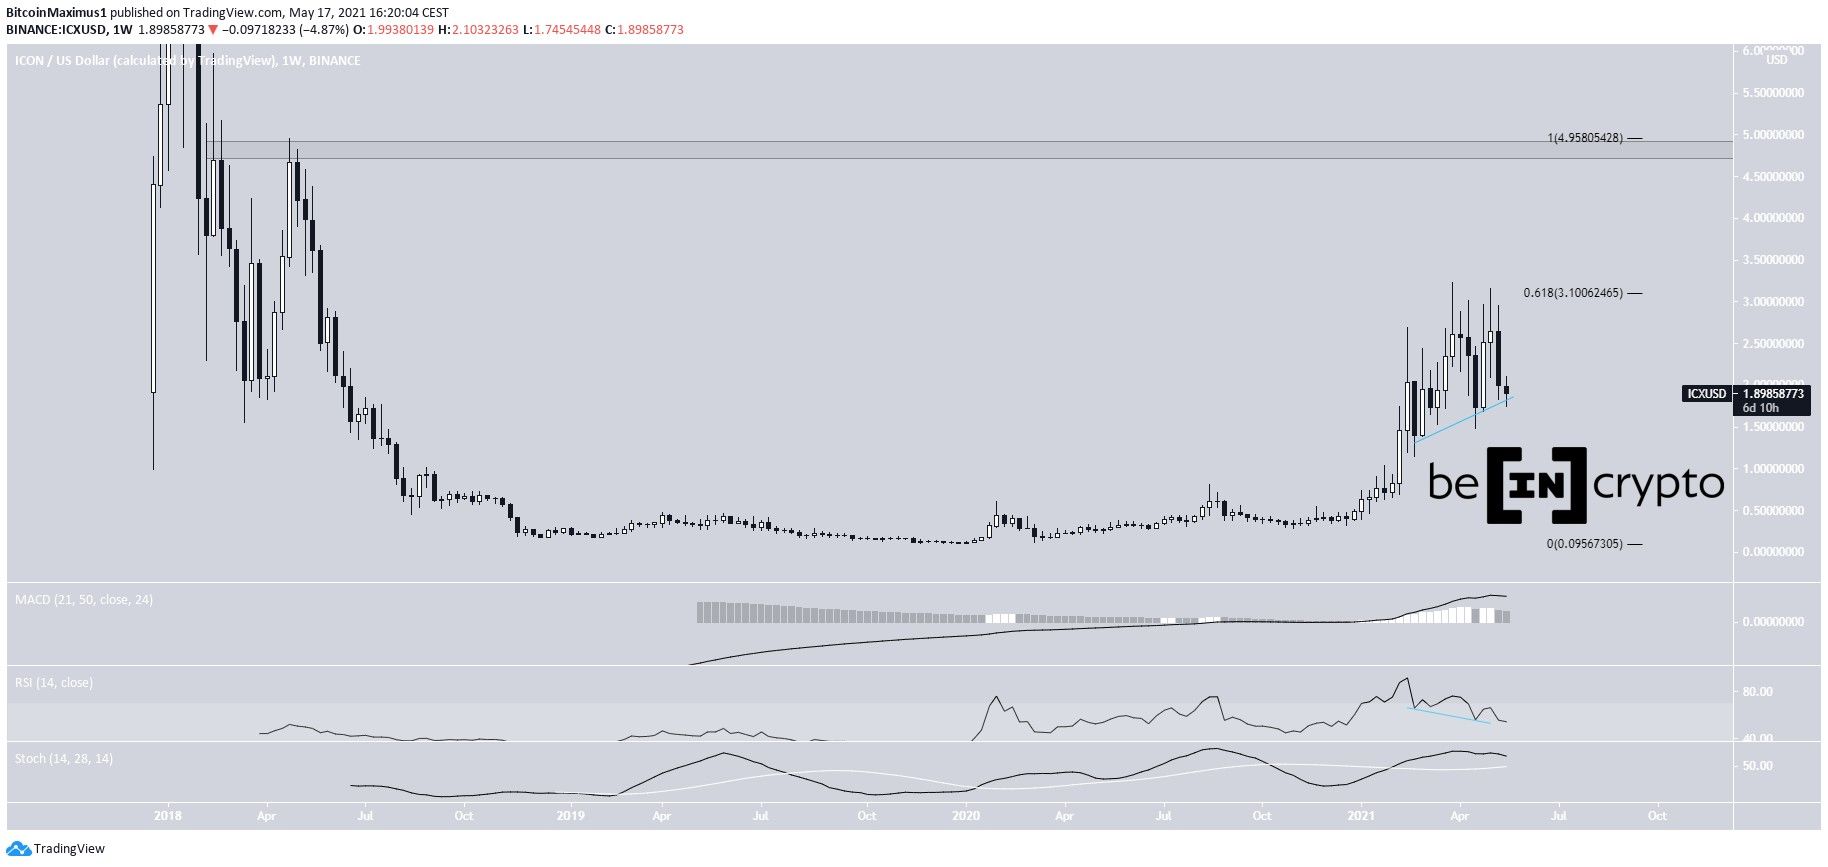
The weekly chart shows that ICX has been struggling to move above the $3.10 resistance area since March 28. The resistance is created by the 0.618 Fib retracement level of the previous downward movement.
Despite the decrease, technical indicators are still bullish. Both the MACD & Stochastic Oscillator are positive. In addition, the RSI has generated hidden bullish divergence.
Therefore, the token is expected to continue moving upwards. A breakout from the $3.10 resistance could occur. If so, the next resistance level would be found at $4.90.
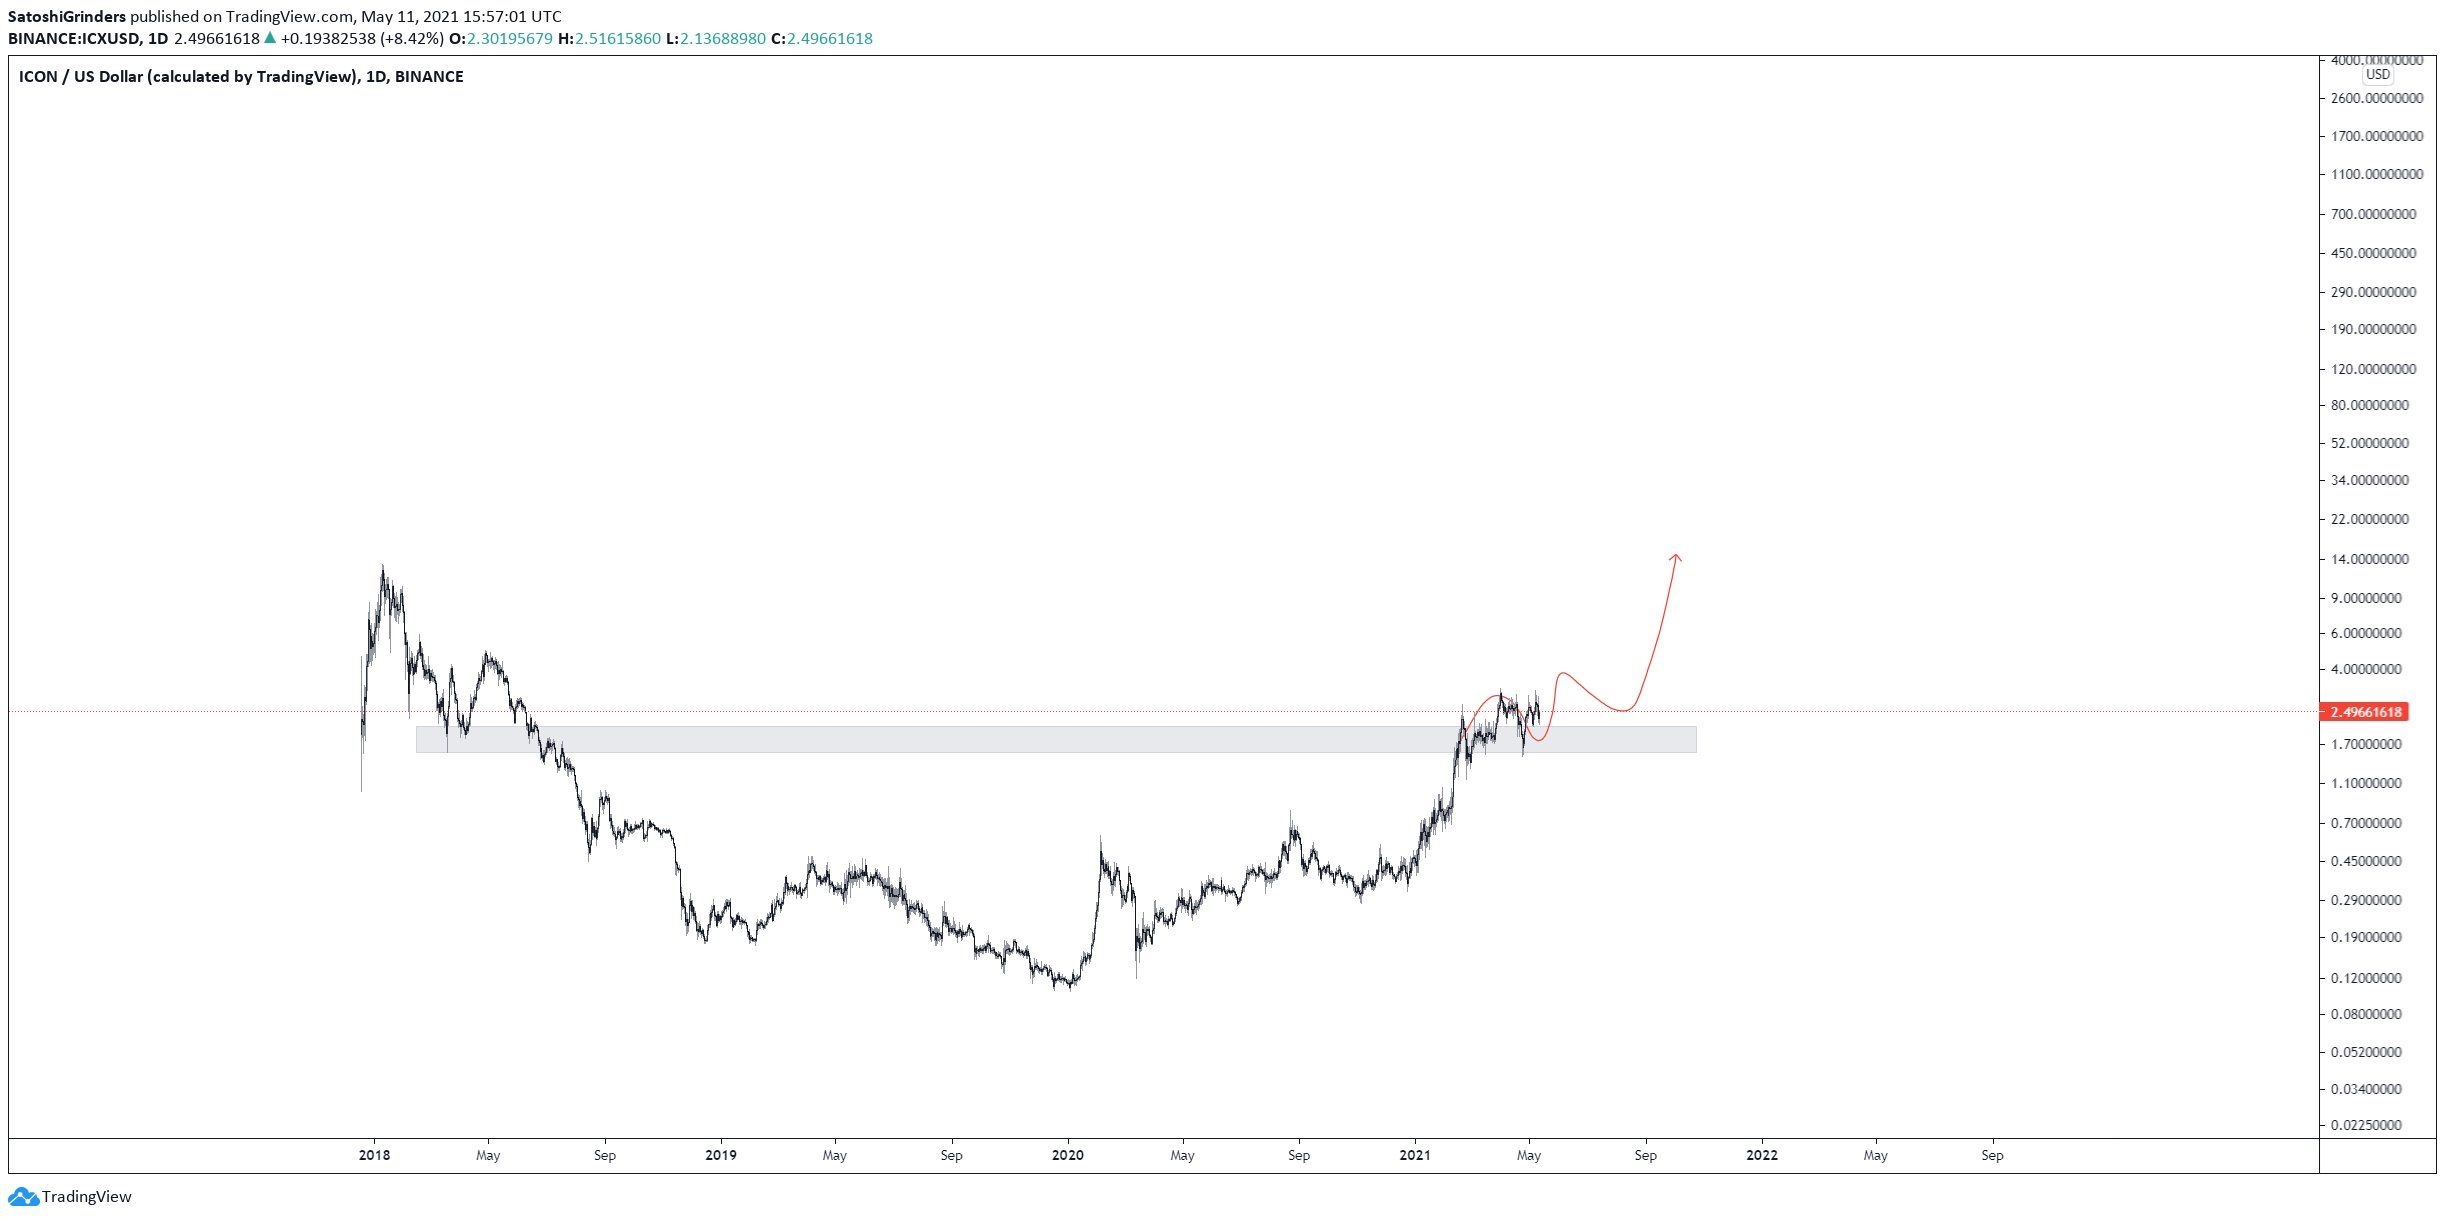
Cryptocurrency trader @Thebull_crypto outlined an ICX chart. He stated that he believes a new all-time high price is in the horizon. This is indeed a possibility, mostly due to the long-term bullish readings.
However, the current all-time high is still more than 500% above the current price. Therefore, the initial reclaim of the $4.90 area is crucial in order to allow for the price to continue moving upwards.
Short-term movement
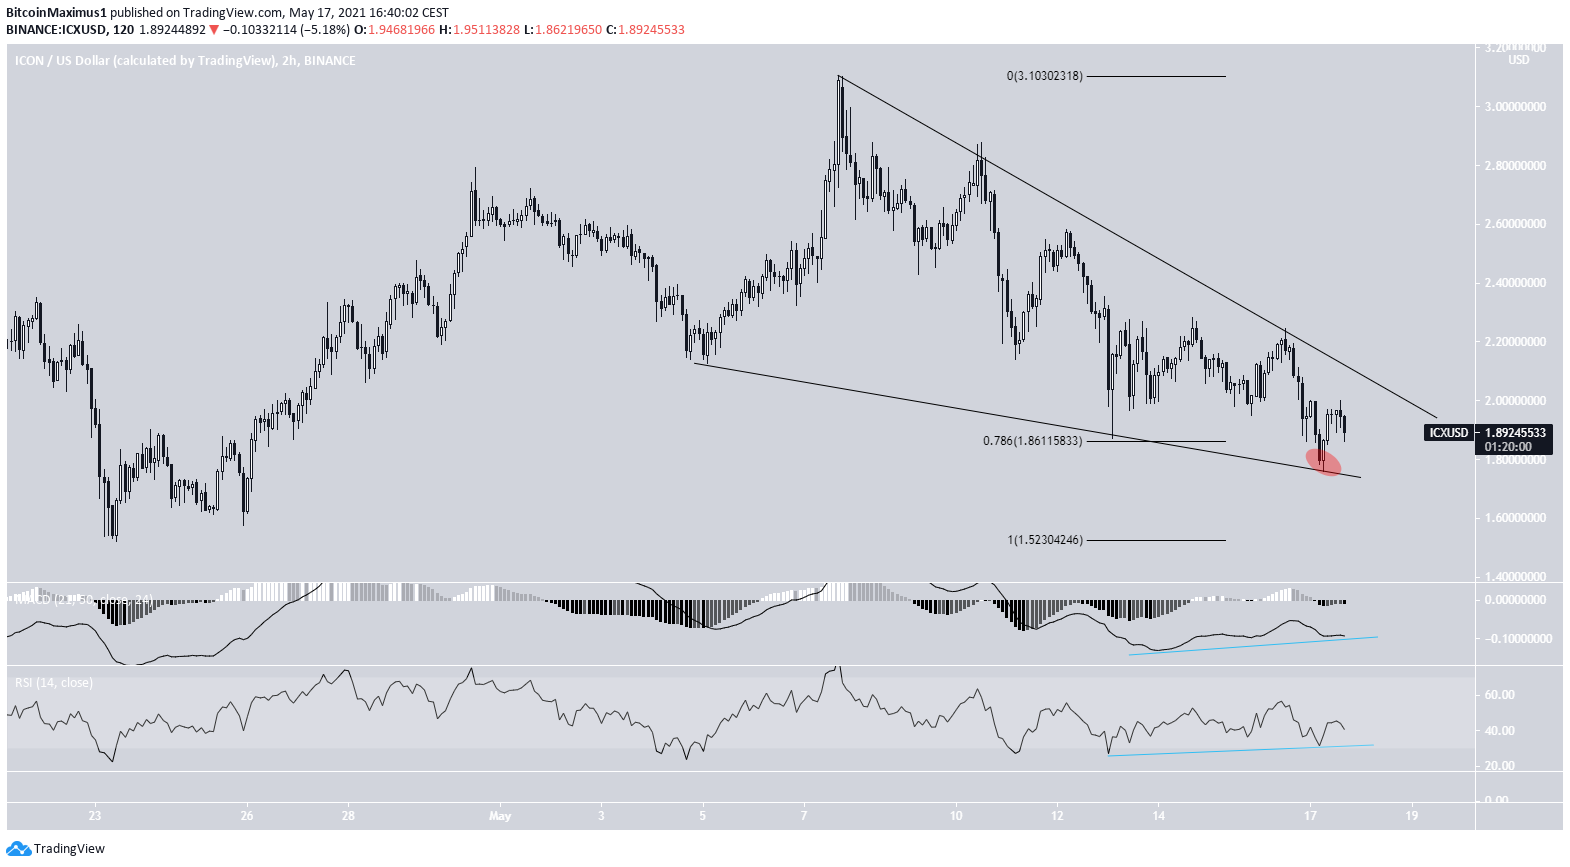
The short-term chart provides a bullish outlook. While the token has been decreasing since May 7, it is trading inside a descending wedge. This is considered a bullish reversal pattern.
In addition, it is in the process of reclaiming the 0.786 Fib retracement support at $1.86. This is a bullish sign, since it is occurring after an initial deviation (red circle).
Finally, technical indicators are bullish. Both the RSI & MACD are increasing. In addition, they have generated bullish divergence. Therefore, a breakout from this pattern is expected.
ICX/BTC
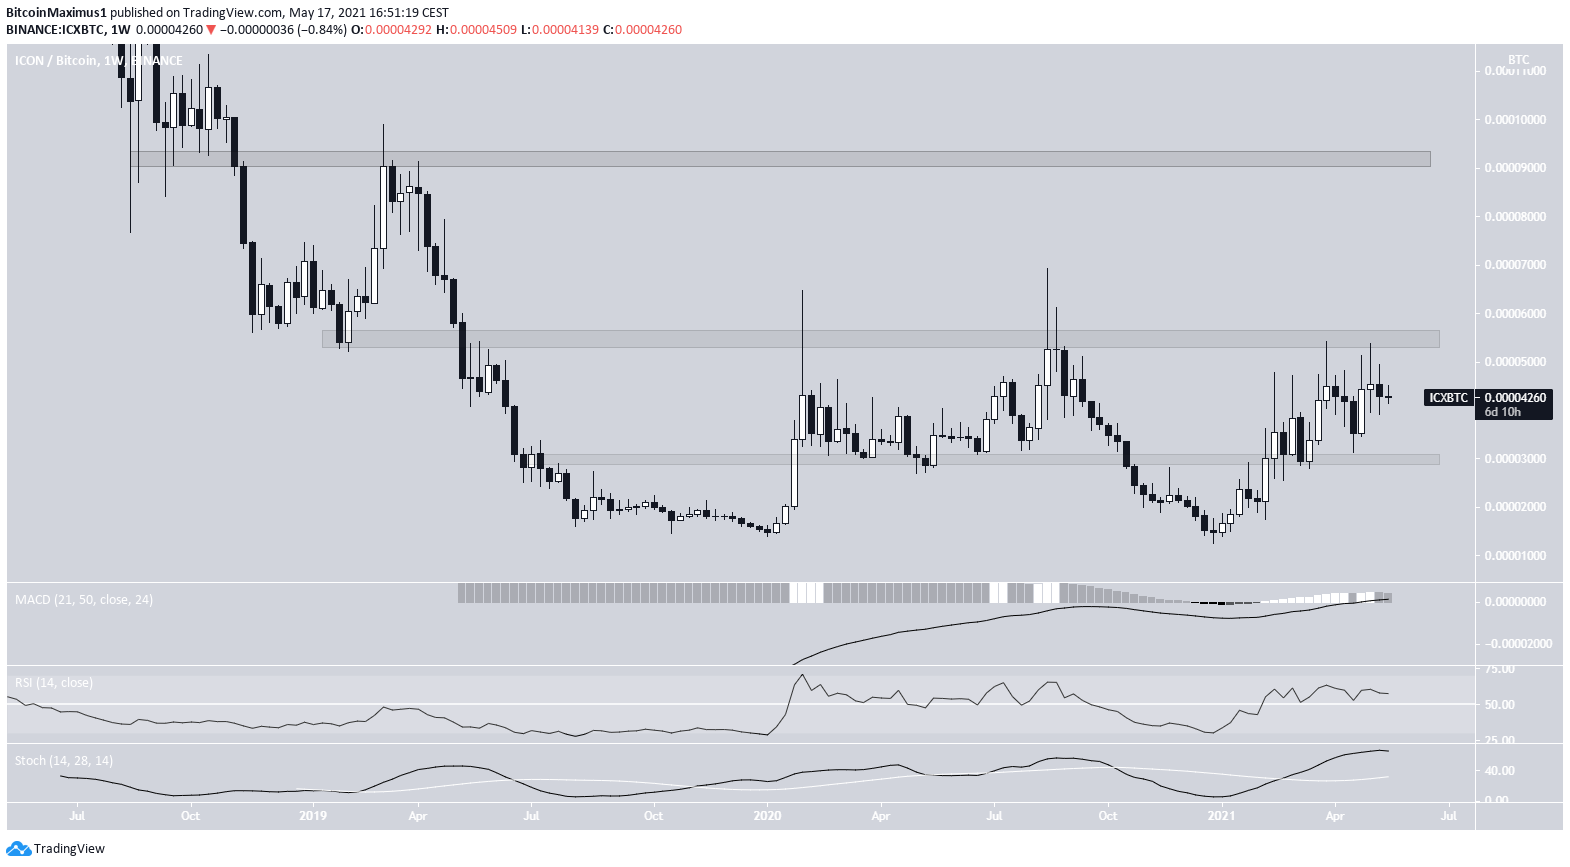
Similar to the USD pair, ICX/BTC has been struggling to move above the 5,500 satoshi resistance area.
However, it has been making higher highs since March 15. Also, the MACD, RSI, and Stochastic Oscillator are increasing.
As a result, a breakout from the 5,500 satoshi area is expected. If so, the next resistance would be found at 9,000 satoshis.
To conclude, ICX is expected to break out from its current short-term pattern. Afterwards, another attempt at moving above $3.10 is probable.
For BeInCrypto’s latest bitcoin (BTC) analysis, click here.


