


The ICON (ICX) price has been decreasing since February 4. On February 17, it reached the halfway line of the entire upward move and bounced upwards.
Trader @CryptoMichNL tweeted an ICX chart and stated that, as long as the price is trading above $0.30, it will likely make another run at $0.55 and, possibly, continue towards $0.95.
Frontrunning on the level I first watched, but a 42% bounce so far.
As long as we hold the green zone for support, I assume we'll see continuation towards $0.55 and might even be able to continue towards $0.95. pic.twitter.com/s8ZLWfAnaD
— Michaël van de Poppe (@CryptoMichNL) February 19, 2020
Will ICX reach the first target? What about the second? Continue reading below if you are interested in finding out.
ICX/USD
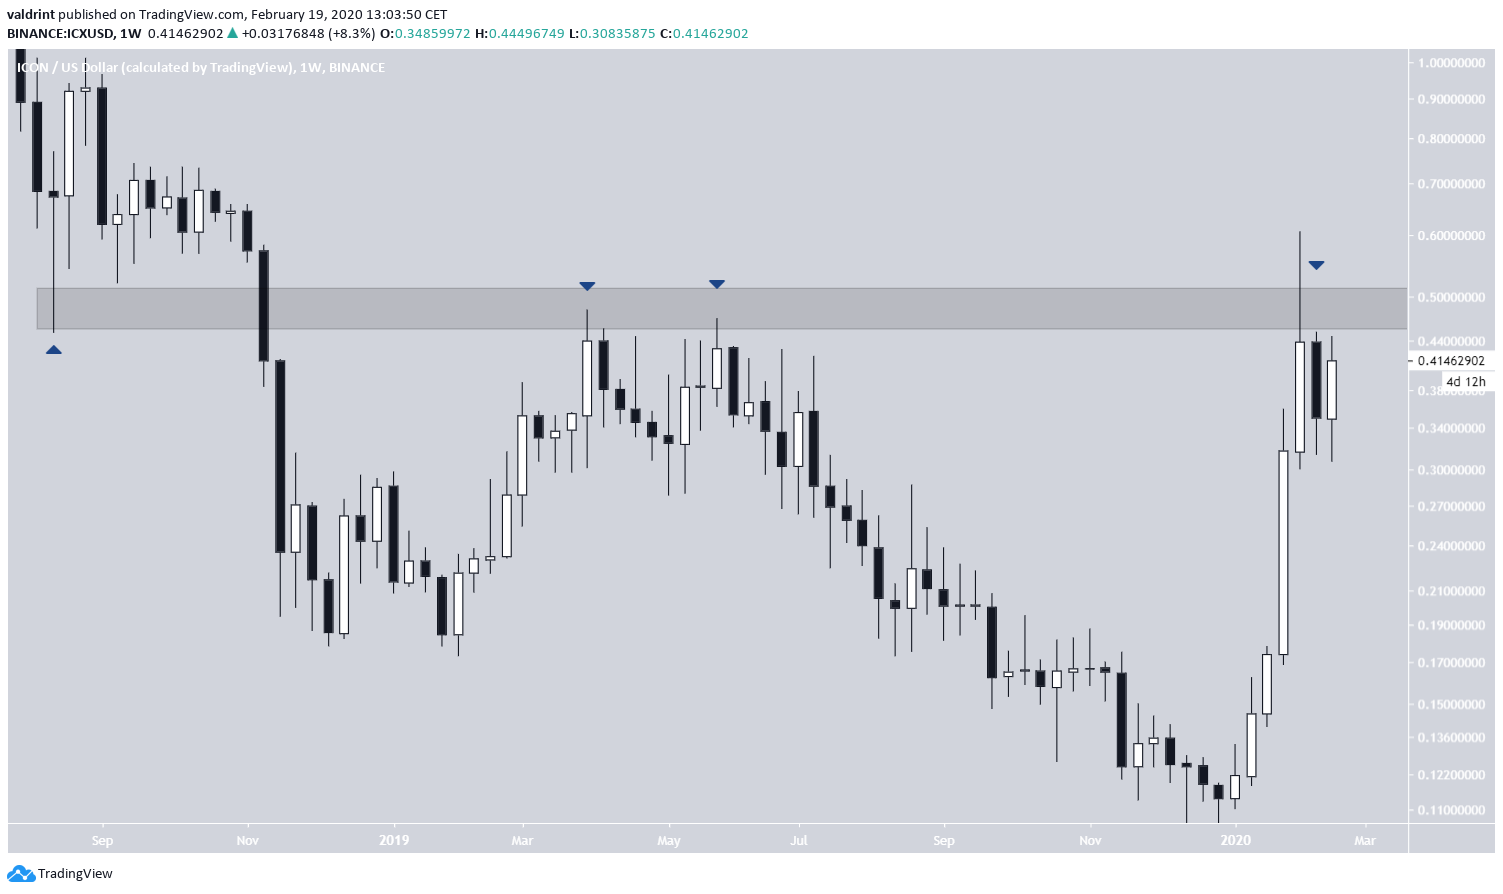
When looking at the logarithmic weekly chart for ICX, the most important area is revealed to be at $0.45-$0.50. After the ICON (ICX) price broke down from this area in November 2018, it made two failed attempts at reclaiming it and accelerated its rate of decrease afterward, leading to the all-time low price of $0.103 reached in December 2019.
The price then began a rapid price increase and briefly moved above this resistance area but failed to reach a close above it. Instead, it created a long upper wick and decreased below once more.
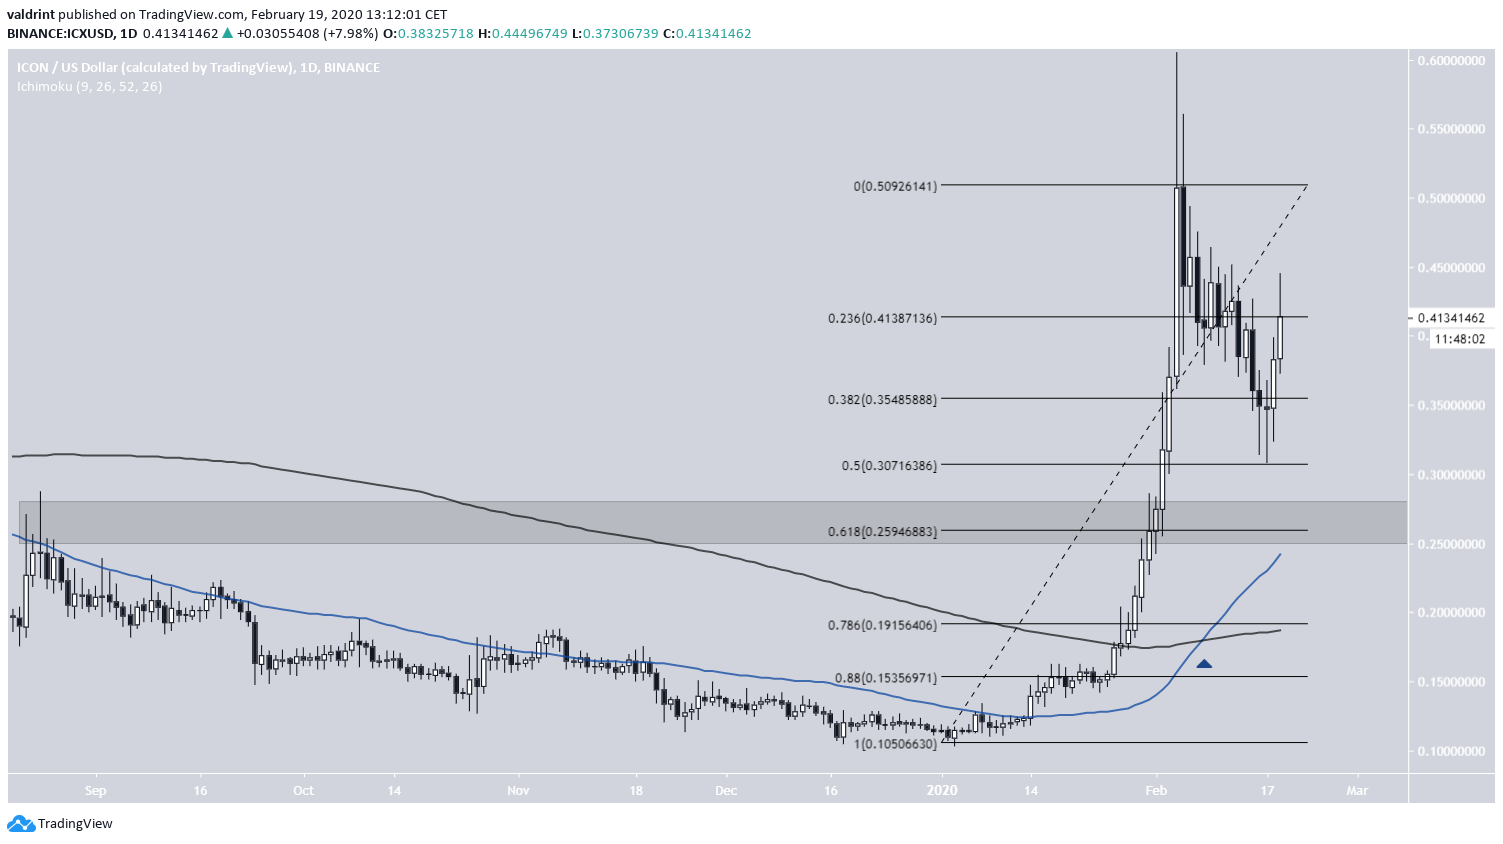
The daily chart reveals one support area, found between $0.25-$0.28, which also coincides with the 0.618 Fib level of the entire upward move that began on January 17. In addition, we can see that the February 17 bounce occurred right at the 0.5 Fib level.
A bullish cross has transpired between the 50- and 200-day moving averages (MAs), both of which are strengthening our previously mentioned support area.
Therefore, we are willing to say that, as long as the ICON price stays above this area, its movement can be considered bullish. If the price breaks out above $0.55, we would expect its rate of increase to greatly accelerate.
ICX/USD Highlights
- There is strong resistance between $0.45-$0.5
- There is support at $0.25-$0.28.
- A golden cross has transpired.
ICX/BTC
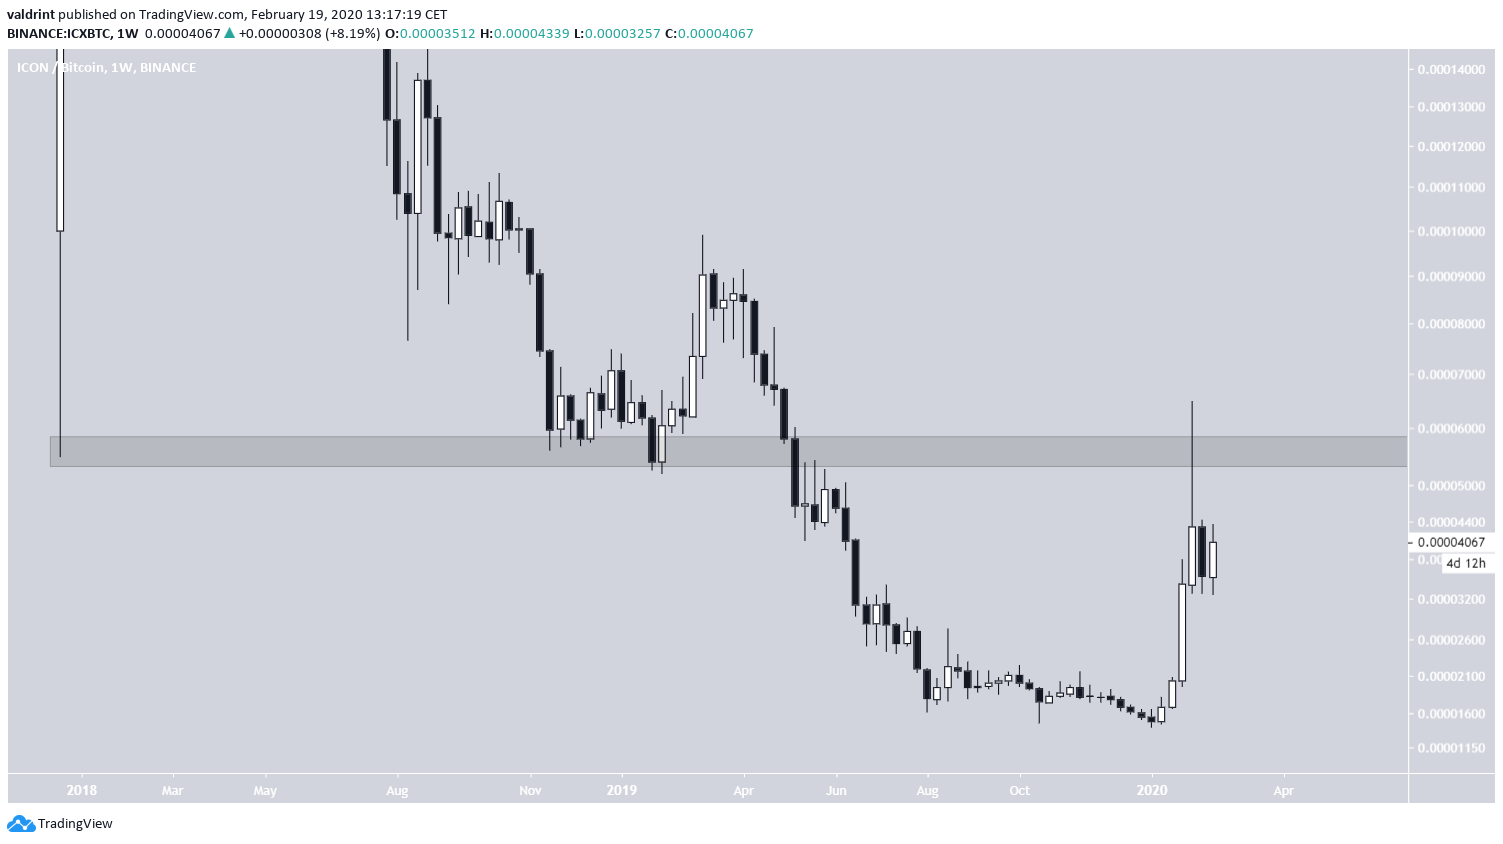
Similar to the USD chart, the main resistance area for ICX/BTC is found at 5500 satoshis — which is the previous breakdown level. The rejection is even more pronounced since the price created a very long upper wick once it reached this area.
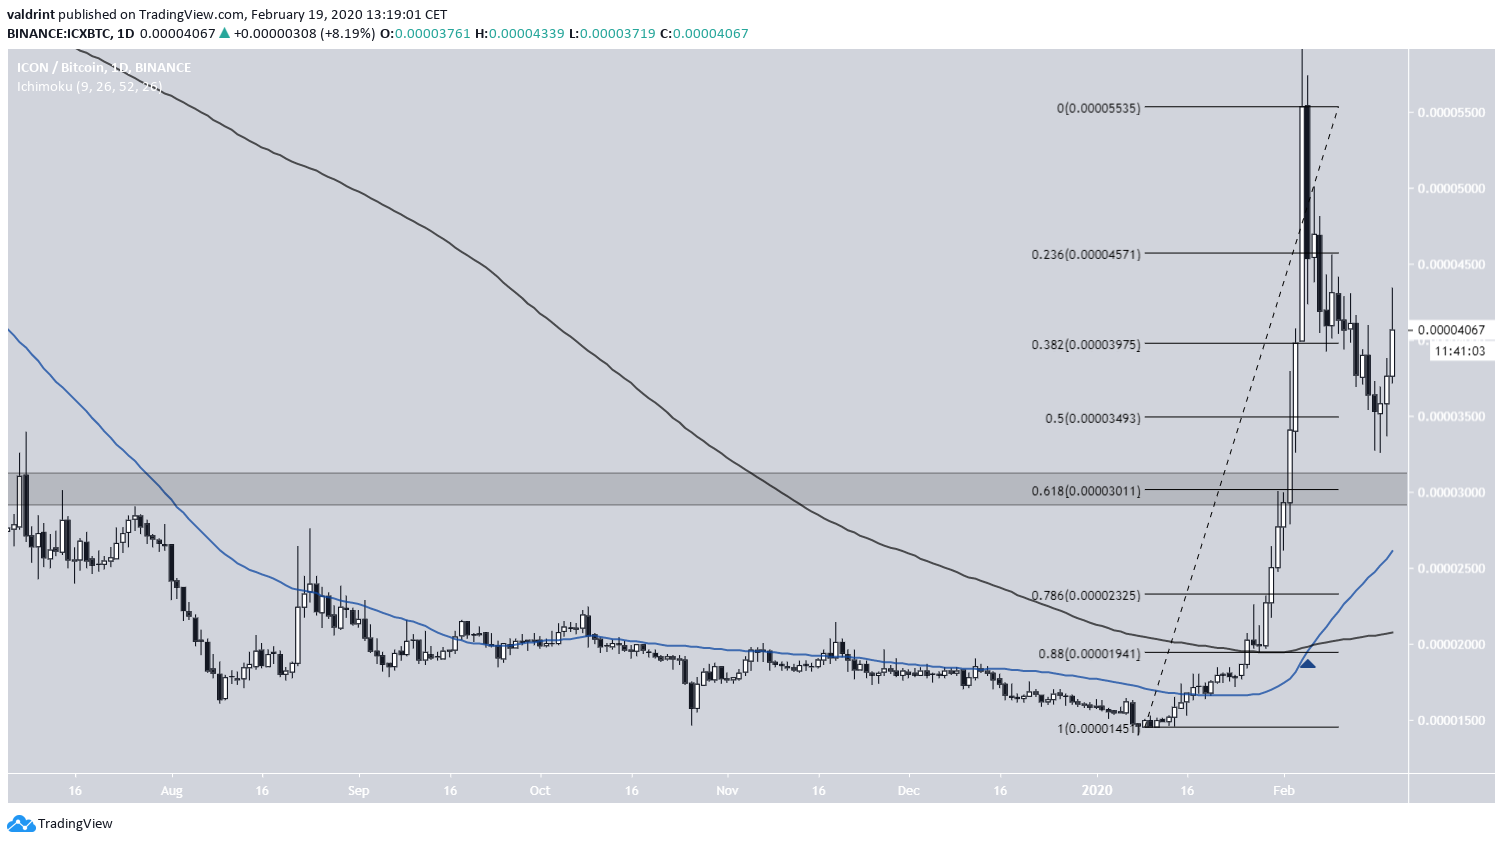
Likewise, a golden cross has transpired in the daily chart, strengthening the 3000 satoshi support area.
In addition, the ICON price has bounced at the 0.5 Fib level and is moving towards the previous high near 5500. As long as the price is trading above this area, we are considering its movement bullish and presuming that the price will make another attempt at breaking out above 5500 satoshis.
ICX/BTC Highlights
- There is resistance at 5500 satoshis.
- There is support at 3000 satoshis.
- A golden cross has transpired.
Conclusion
To conclude, the ICX price has been correcting since February 4. It has made a bounce at the 0.5 Fib level and has been moving upwards since. While it is possible that the price makes another slightly lower low at $0.28/3000 satoshis, we believe it will soon make another attempt at breaking out above its February 4 high.


