


ICON (ICX) could soon move towards a new all-time high price due to its ongoing breakout and bullish readings from technical indicators.
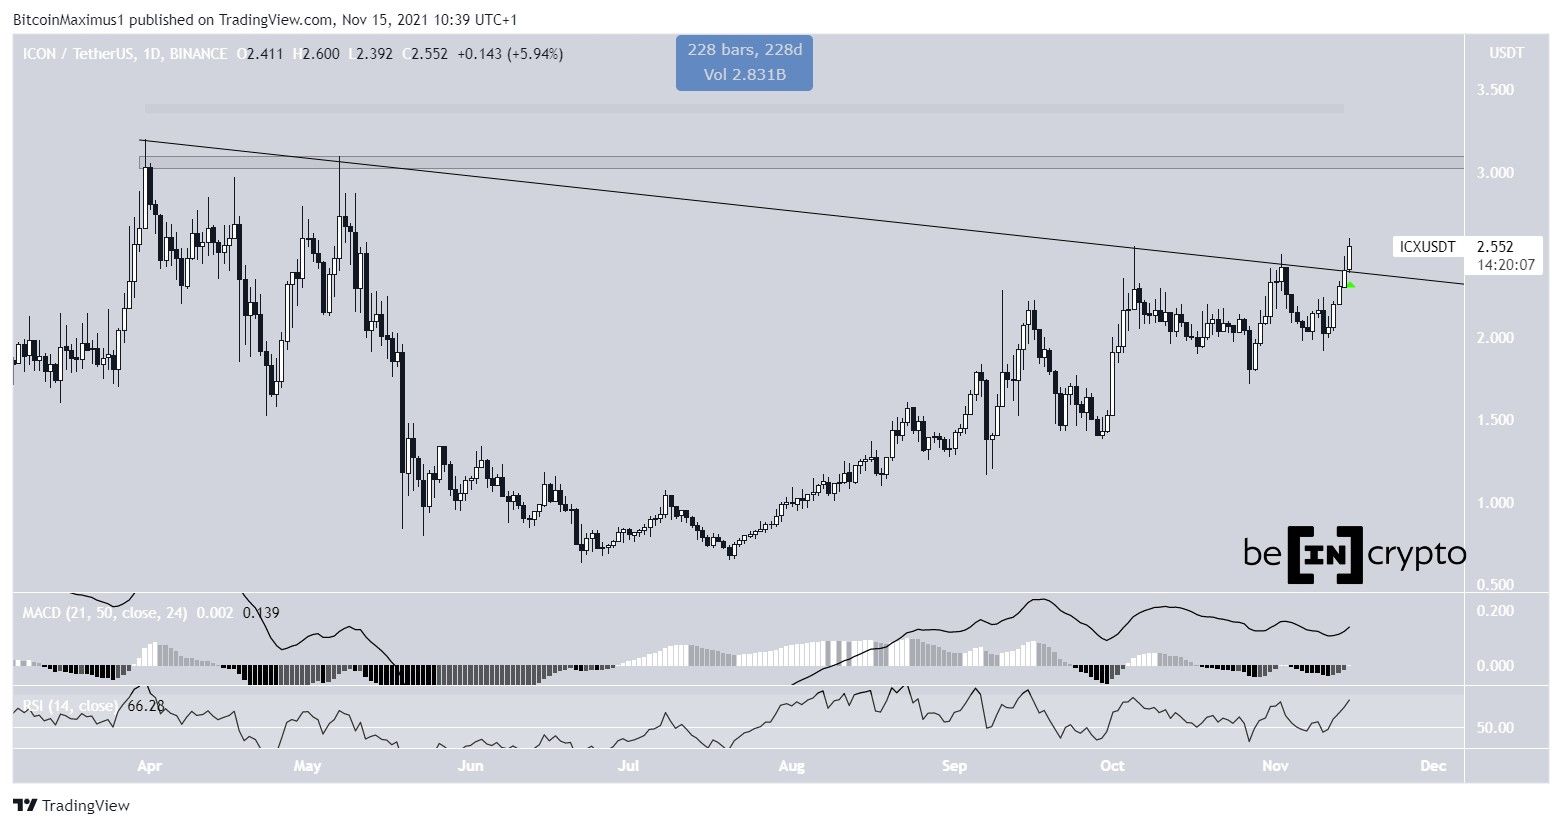
ICX has been decreasing beneath a descending resistance line since March 31, when it reached an all-time high price of $3.20. This led to a low of $0.63 on June 22.
However, ICX has been moving upwards since then and was finally able to successfully break out above the line on Nov 15. This was its fifth attempt at doing so after 228 days of trading below the line.
The breakout is supported by multiple technical indicators. The MACD, which is created by a short and long-term moving average (MA) is positive and moving upwards.
The RSI, which is a momentum indicator, has moved above 50. This usually transpires during strong upward movements.
Therefore, both the price action and technical indicator readings are bullish, supporting the continuation of the rally.
The all-time high resistance area is the next target at $3.05.
Future ICX movement
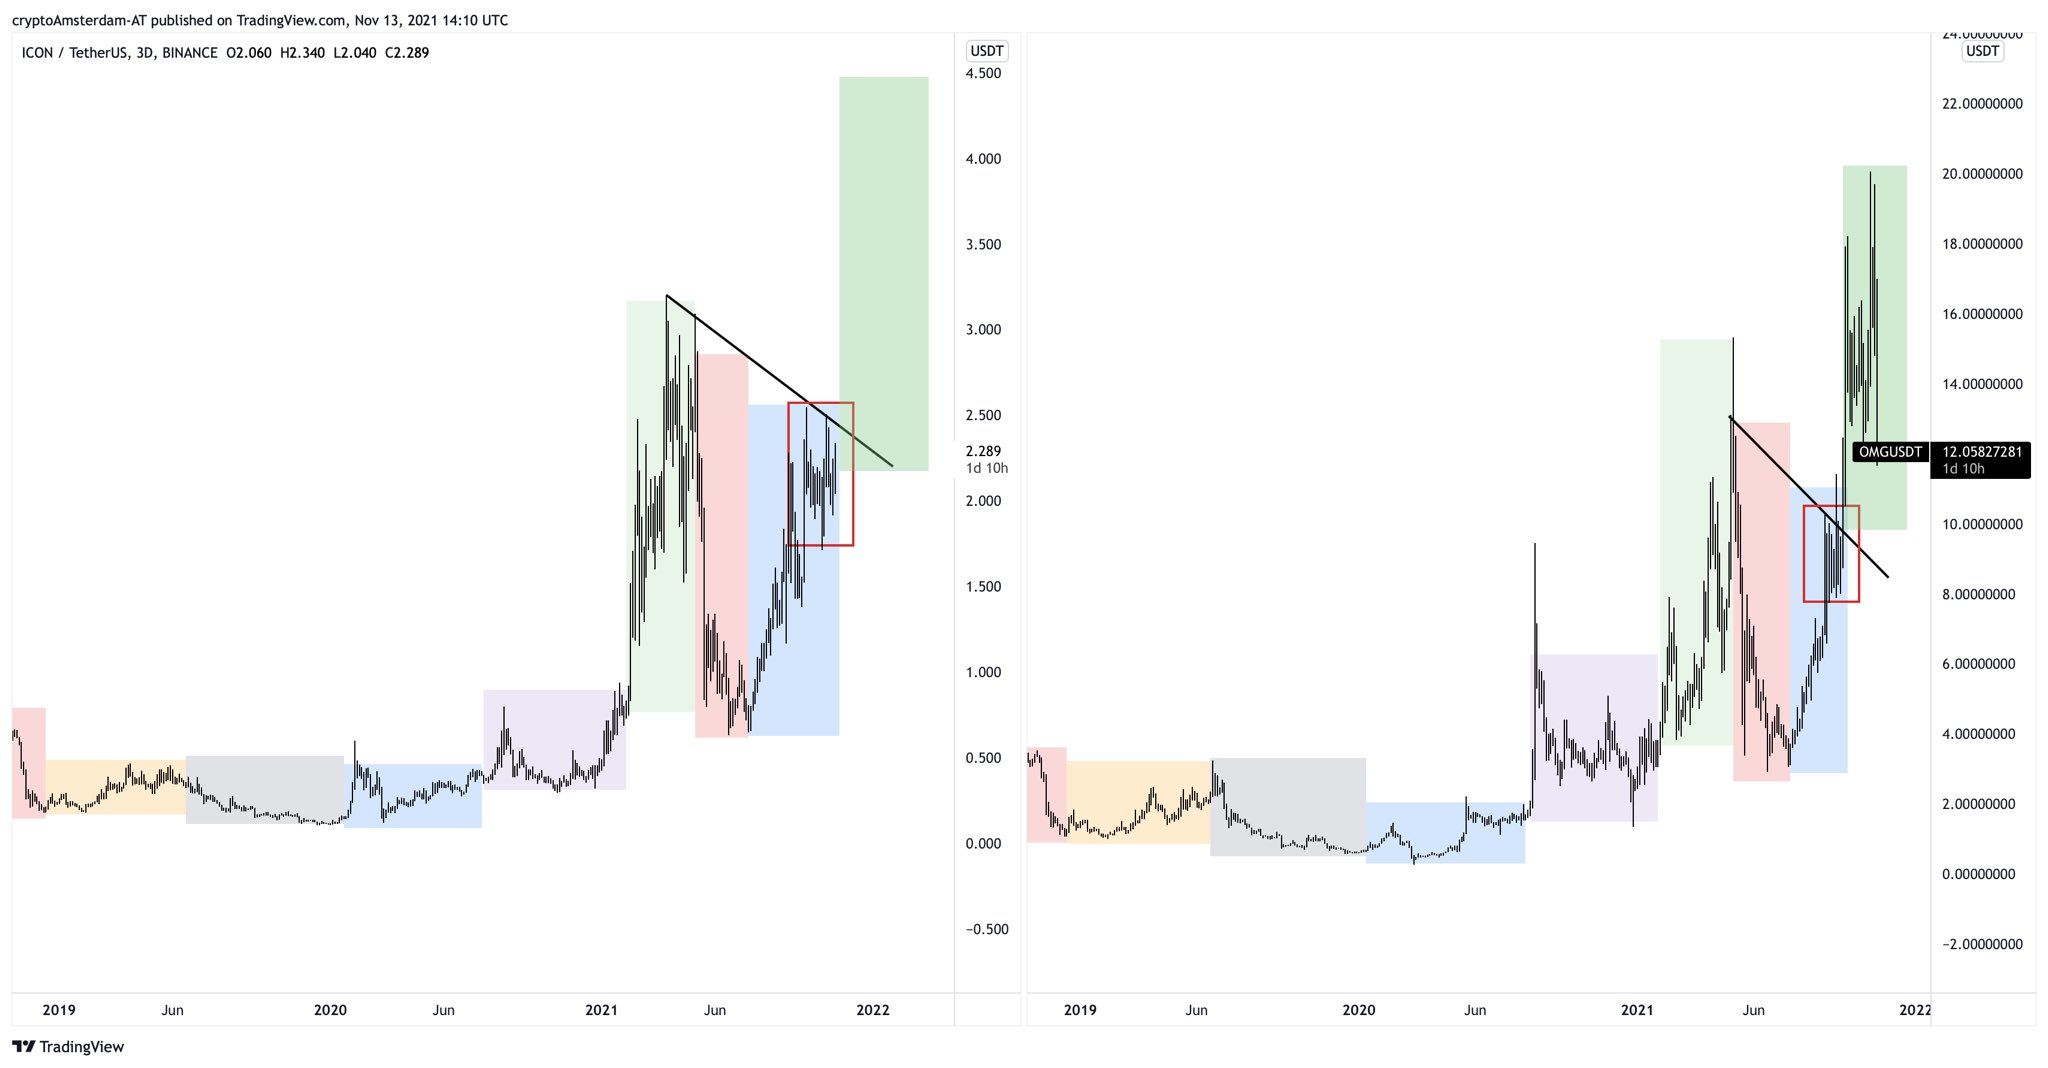
Cryptocurrency trader @Damskotrades outlined an ICX chart, stating that the token could initiate a movement similar to that of OMG, which could take it above $4.
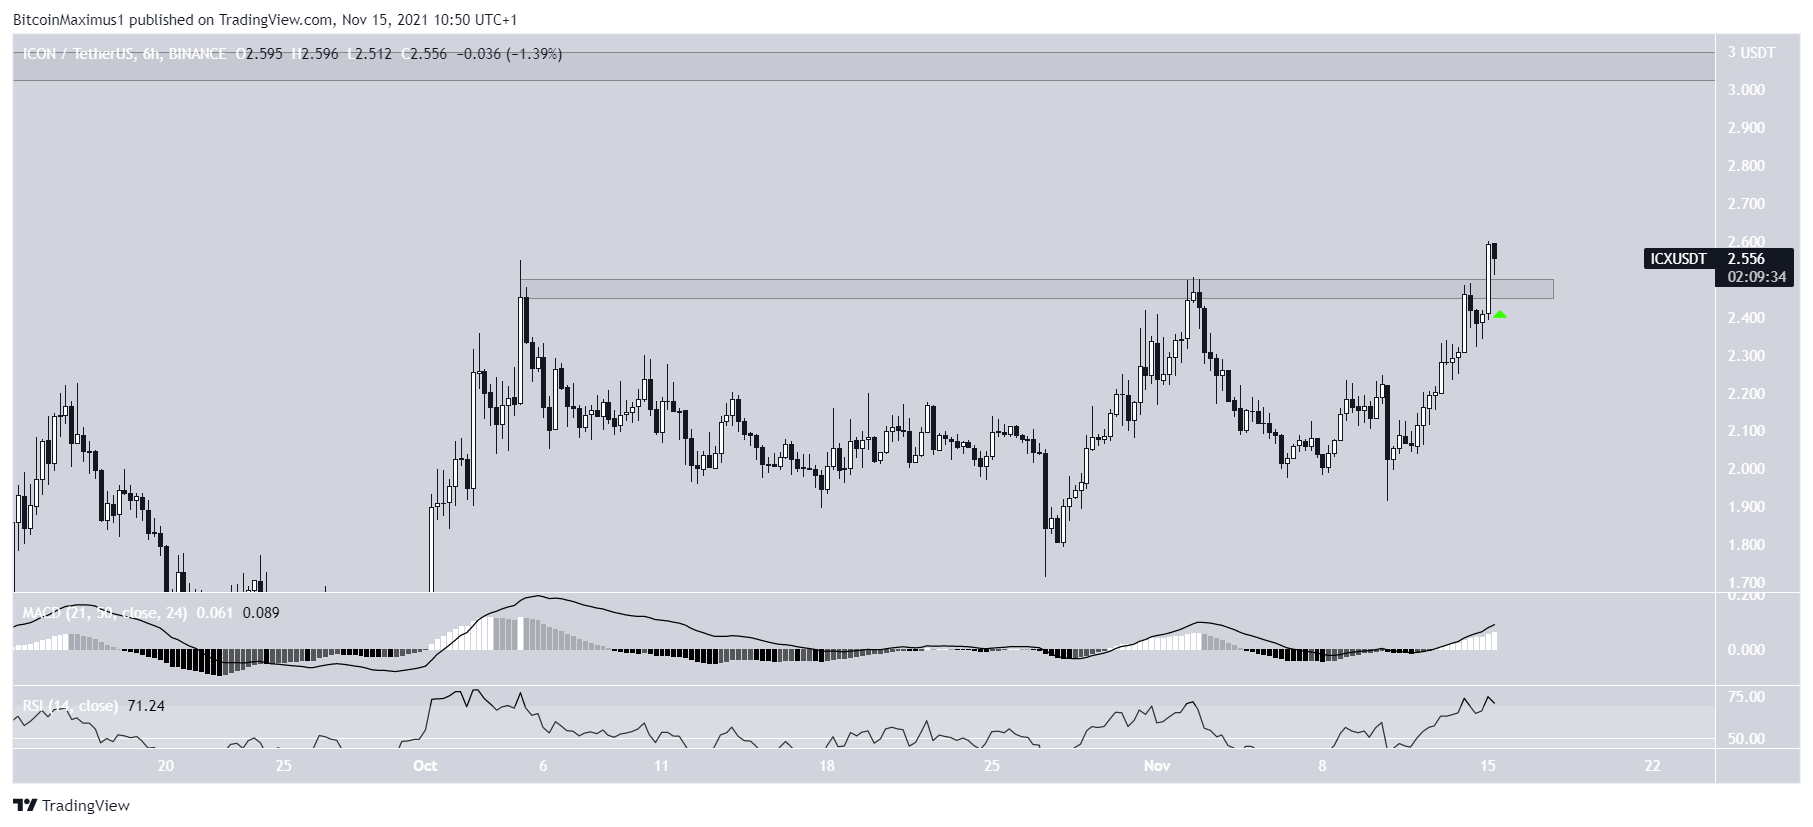
In addition to the long-term breakout previously outlined, ICX has also moved above the horizontal short-term $2.50 resistance area. This is another sign of a bullish trend that often leads to significant increases.
The breakout is also supported by both the RSI and MACD, which are moving upwards.
If ICX manages to hold on above this area, it could increase towards the all-time high resistance of $3.05.
Wave count
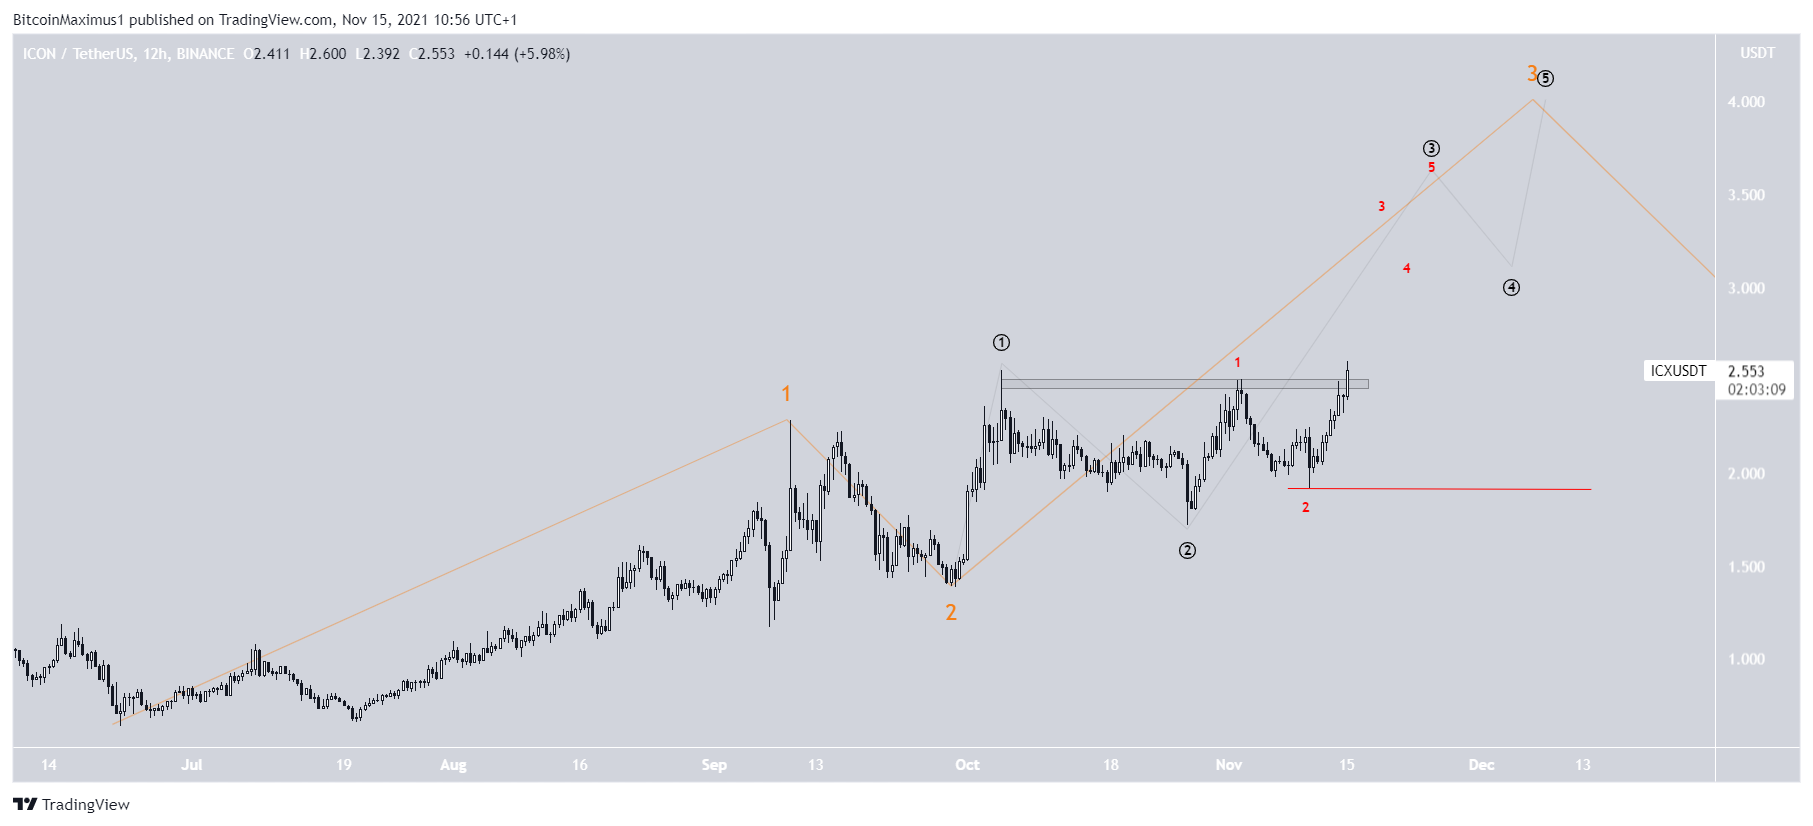
The movement since the aforementioned June 23 low resembles a massive 1-2/1-2 wave formation. This is a type of bullish structure in which the price accelerates greatly during wave three (orange). This would likely take ICX to a new all-time high price.
The sub-wave and minor sub-wave counts are shown respectively in black and red.
A decrease below the Nov 10 low at $1.91 (red line) would invalidate this particular count.
For BeInCrypto’s latest Bitcoin (BTC) analysis, click here.


