
Hyperliquid (HYPE) price has dropped nearly 16% in the last 24 hours, bringing its market cap down to $7.4 billion. Technical indicators suggest that sellers are gaining control, with Directional Movement Index (DMI) and BBTrend both weakening.
The EMA lines are also showing signs of a potential death cross, which could accelerate losses if key support at $21.1 fails. However, if buyers step in and momentum shifts, HYPE could rebound toward $24.39, with a breakout potentially pushing it to $27.
HYPE DMI Chart Shows Sellers Are In Control
Hyperliquid Directional Movement Index (DMI) chart shows a significant shift in momentum, with its Average Directional Index (ADX) rising to 20.3 from 9 in just four days.
The ADX measures trend strength on a scale from 0 to 100, where values below 20 indicate a weak trend, and readings above 25 suggest a stronger trend is forming. This recent increase suggests that HYPE’s ongoing downtrend may be gaining strength, but it’s still in the early stages of confirmation.
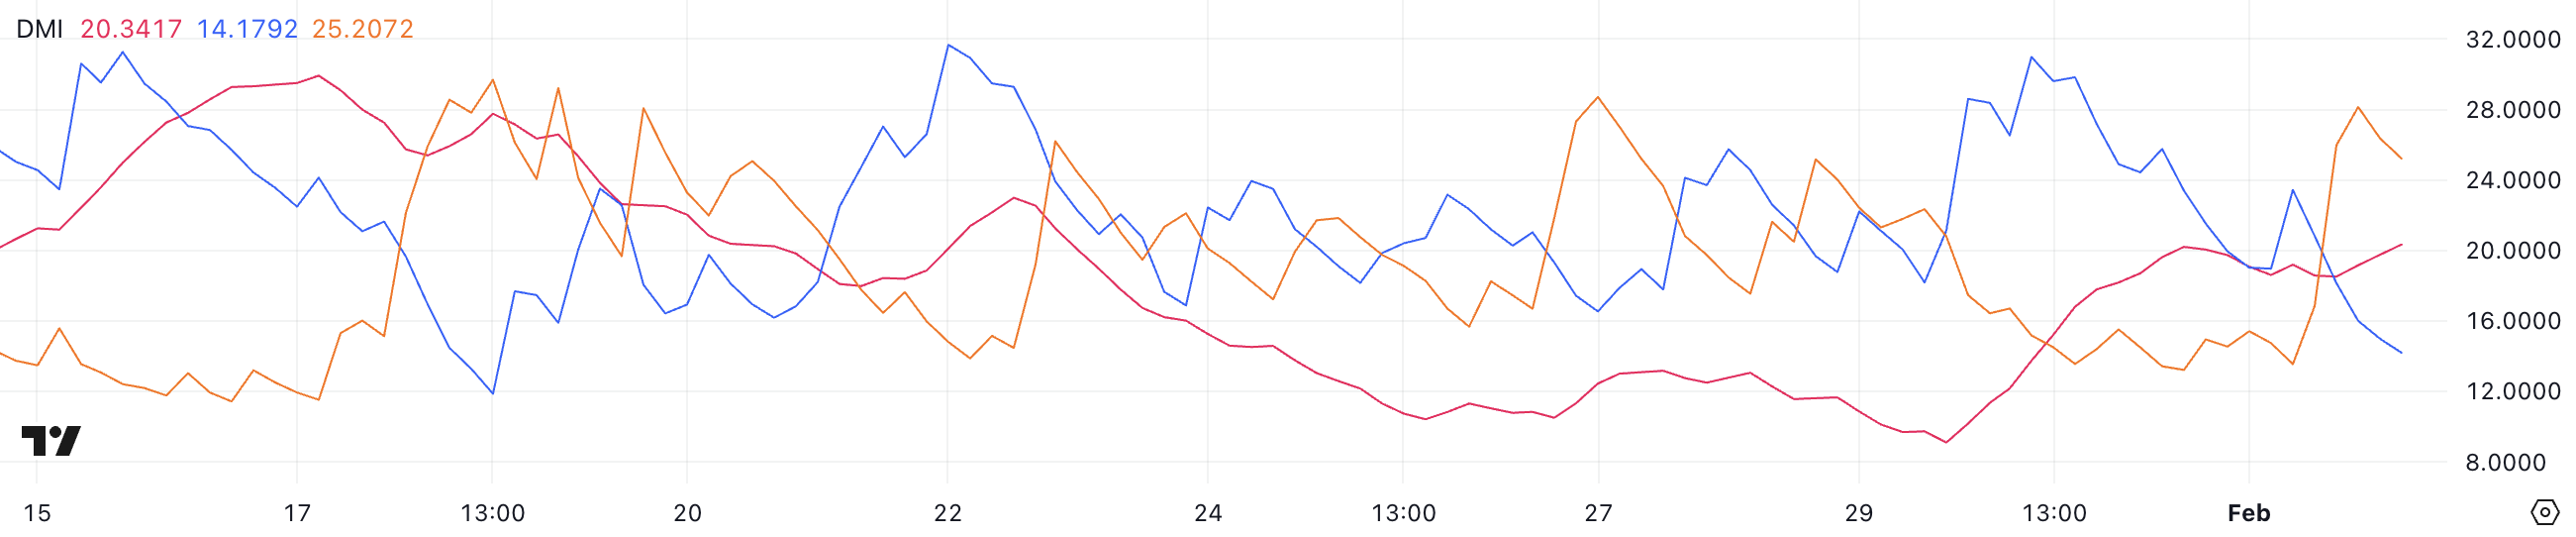
The +DI (Positive Directional Indicator) has dropped sharply from 30.9 to 14.1, while the -DI (Negative Directional Indicator) has surged from 13.5 to 25.2, signaling a shift in momentum toward the downside.
Since -DI is now above +DI, sellers are currently in control, reinforcing HYPE bearish trend. If ADX continues rising above 25, it would confirm a stronger downtrend, meaning further losses could be ahead unless buyers regain momentum.
BBTrend Is Still Positive, But Going Down
HYPE BBTrend has dropped significantly from 10.1 yesterday to 3.15 today, signaling a weakening bullish momentum. BBTrend (Bollinger Band Trend) measures the strength of a price trend based on Bollinger Bands, where positive values suggest an uptrend and negative values indicate a downtrend.
The higher the BBTrend value, the stronger the trend in that direction. While HYPE’s BBTrend remains positive, its sharp decline suggests that buying pressure is fading.
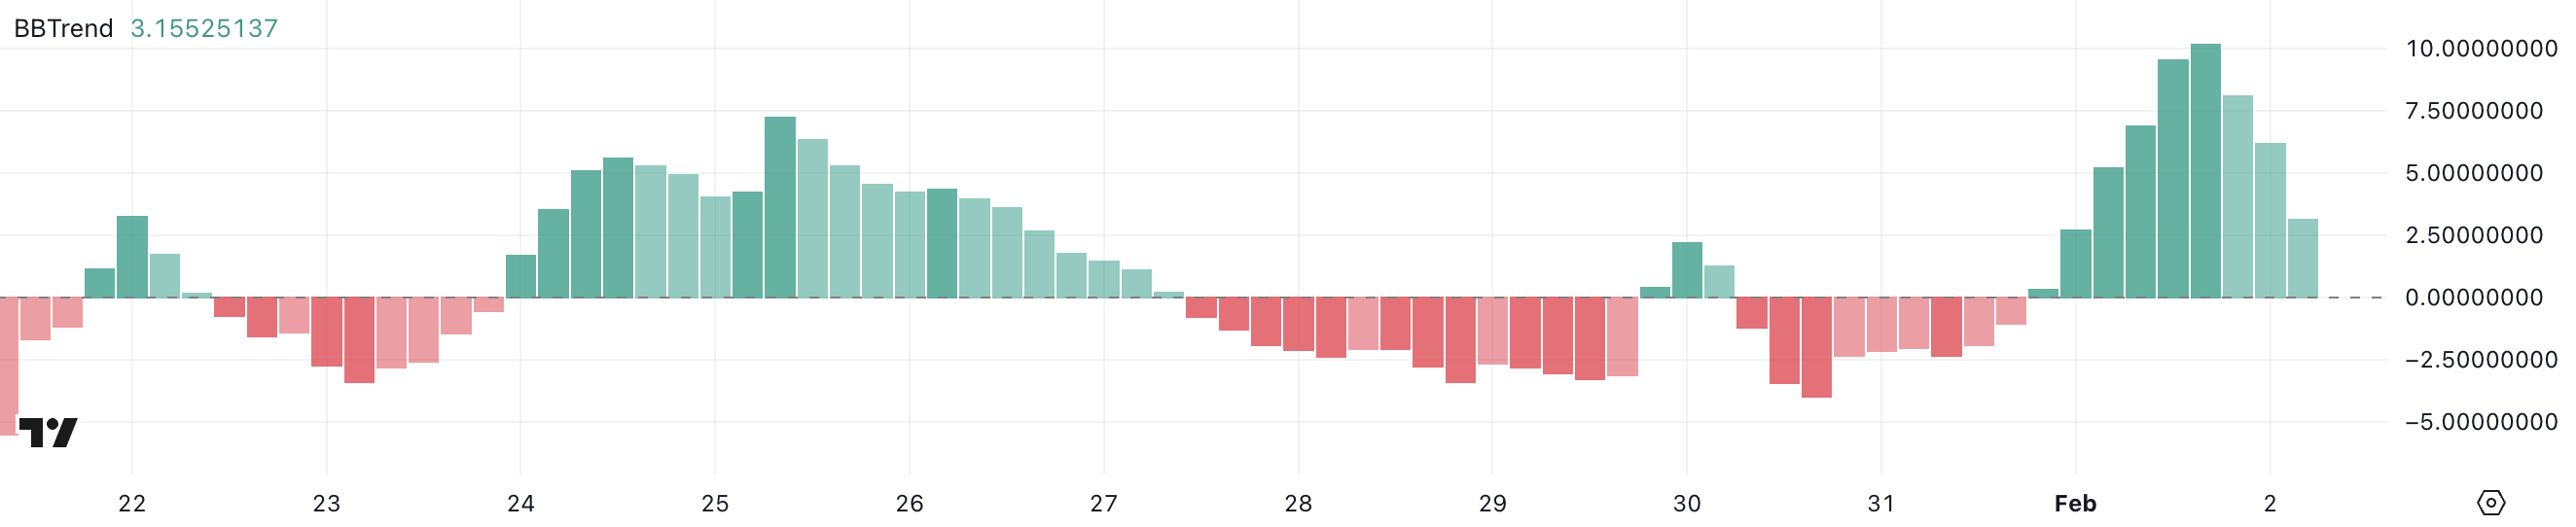
With BBTrend falling quickly, HYPE’s price momentum is slowing, increasing the risk of a potential reversal or deeper pullback. If the BBTrend turns negative, it could confirm a shift into a downtrend.
However, if buyers step in and stabilize the trend, HYPE price could attempt to regain bullish strength. The next few sessions will be crucial in determining whether this decline is a temporary dip or the start of a broader correction.
HYPE Price Prediction: Will HYPE Fall Below $20 Soon?
Hyperliquid Exponential Moving Average (EMA) lines indicate a crucial turning point, as short-term EMAs are still above long-term ones but are declining quickly.
If they cross below—a death cross—it would signal a stronger bearish trend. In that case, HYPE could test key support at $21.1. If that level breaks, further downside could push prices to $20.1 or even $18.89, the lowest level since January 13. This scenario would confirm increasing selling pressure and a prolonged downtrend.
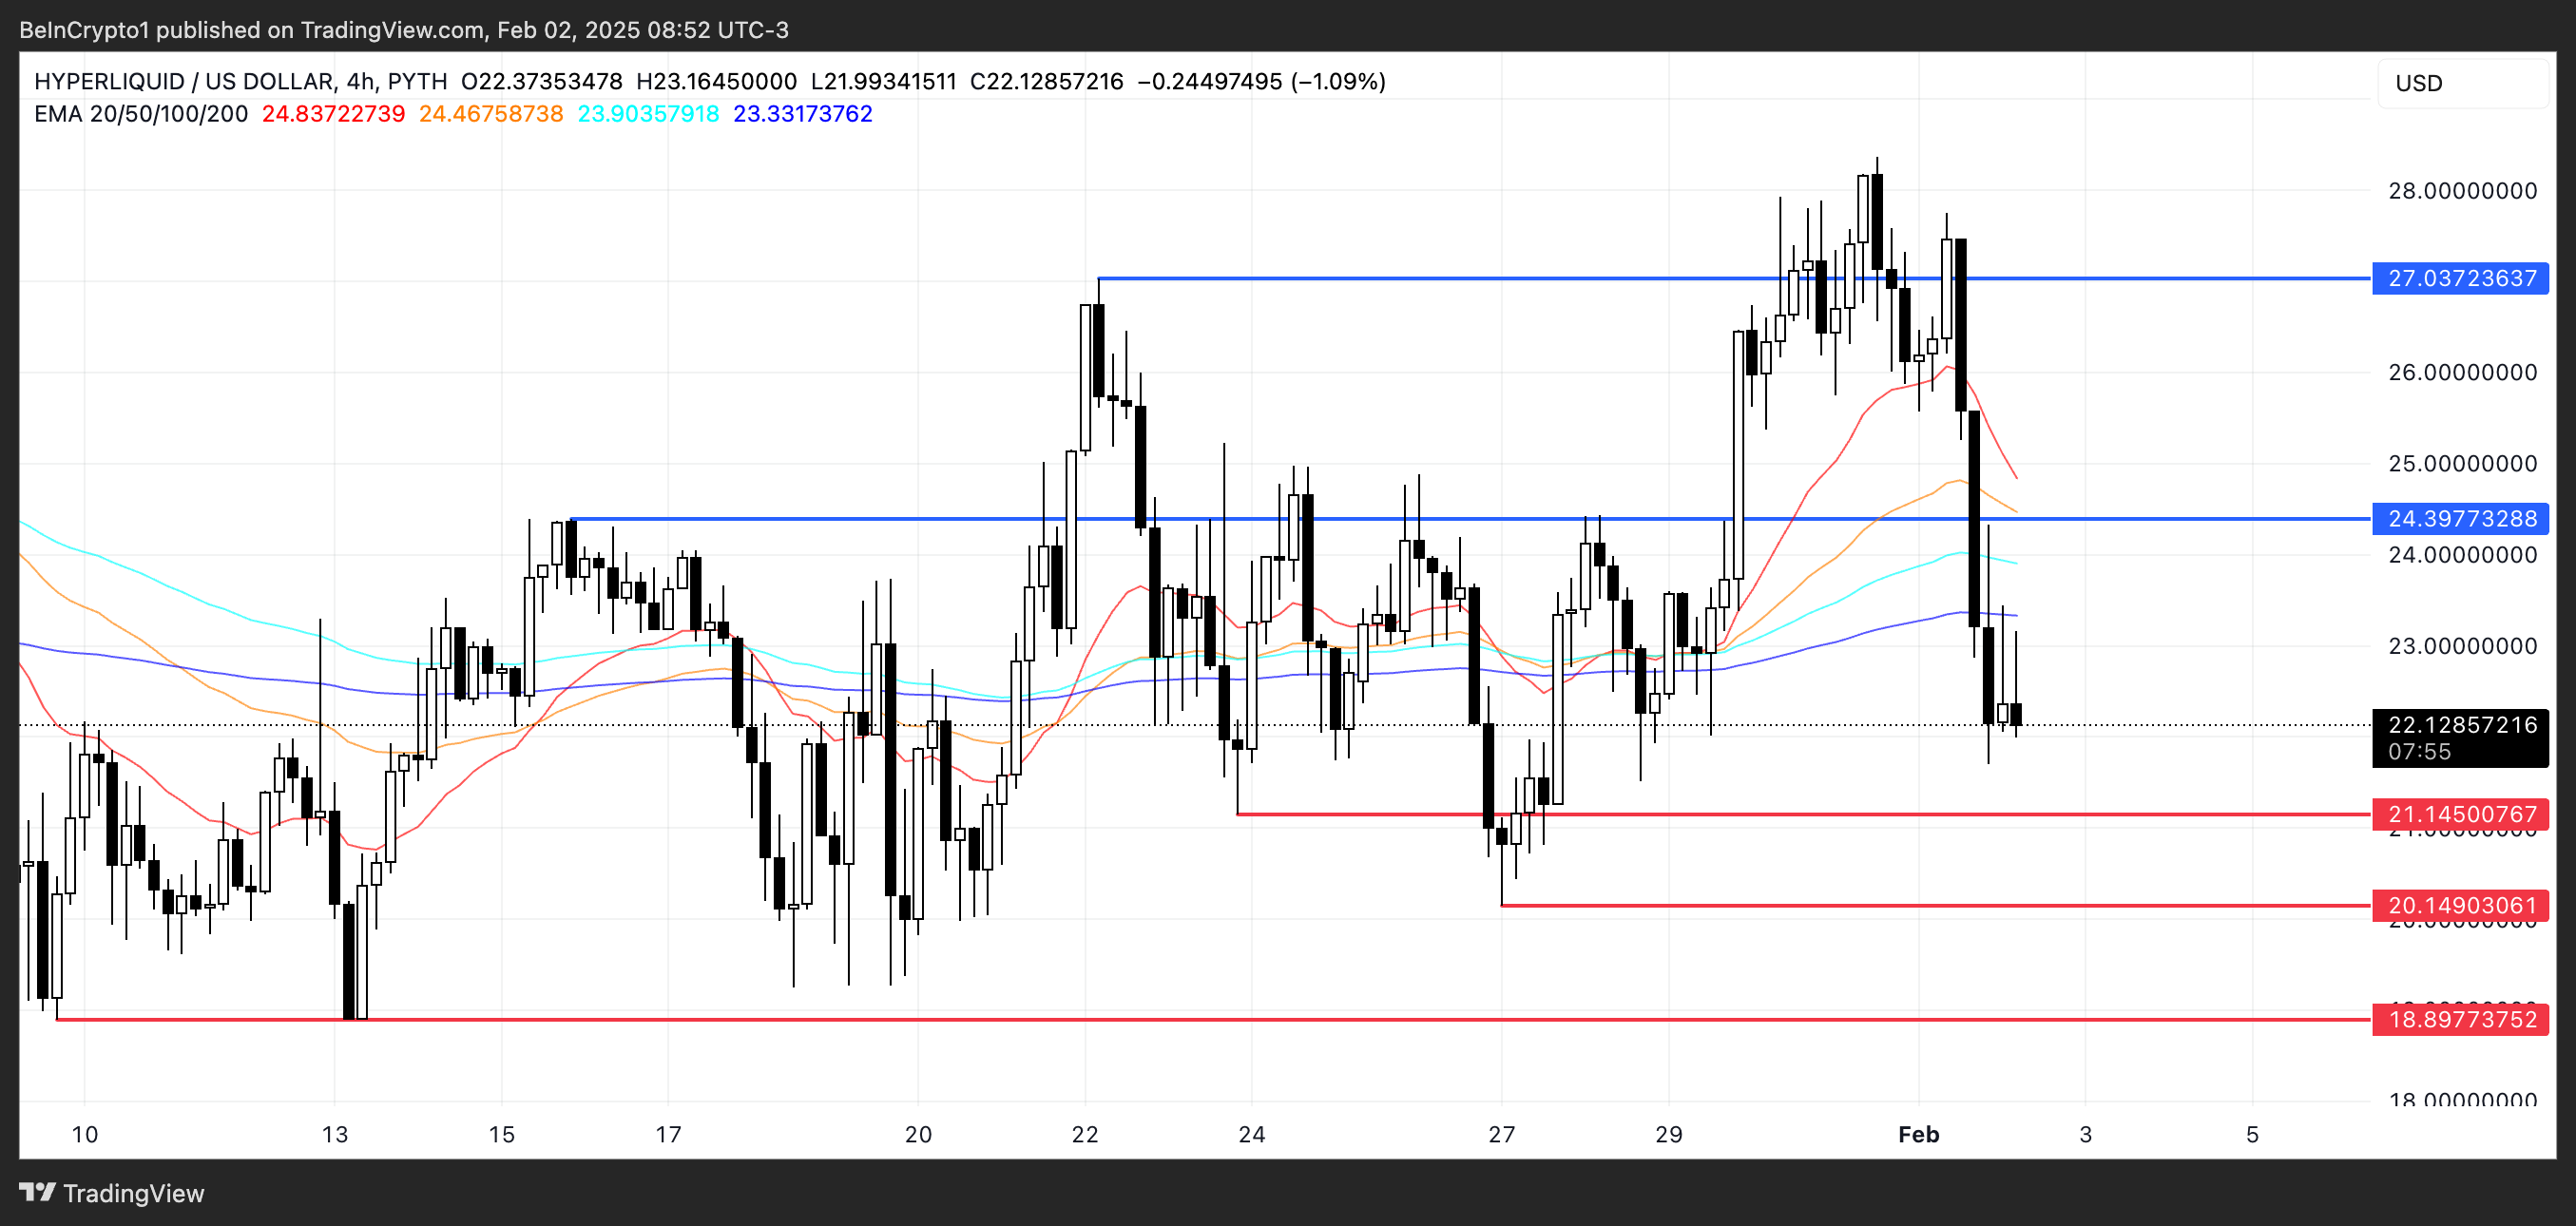
However, if HYPE price holds above support and momentum shifts, it could attempt a trend reversal.
A rebound from current levels might lead to a test of the $24.39 resistance, and breaking that could push the price toward $27.
