


The midterm U.S. elections preceded sharp crashes in the cryptocurrency market in 2014 and 2018. Whether the same will occur in the 2022 midterm elections is debatable.
In both 2014 and 2018, the price of cryptocurrencies crashed right after the midterm U.S. elections. However, several signs indicate the opposite will happen this time around.
These signs are mainly related to the total cryptocurrency market cap. Furthermore, cryptocurrency prices can become bullish if Republicans were to win a majority in the house and/or senate since Republicans are generally viewed as crypto-friendly. The same can be said for a potential 2024 Donald Trump candidacy.
In any case, the crypto market has decreased over the past 24 hours. Since today is election day, it is worth looking at the price movement and determining why this is occurring.
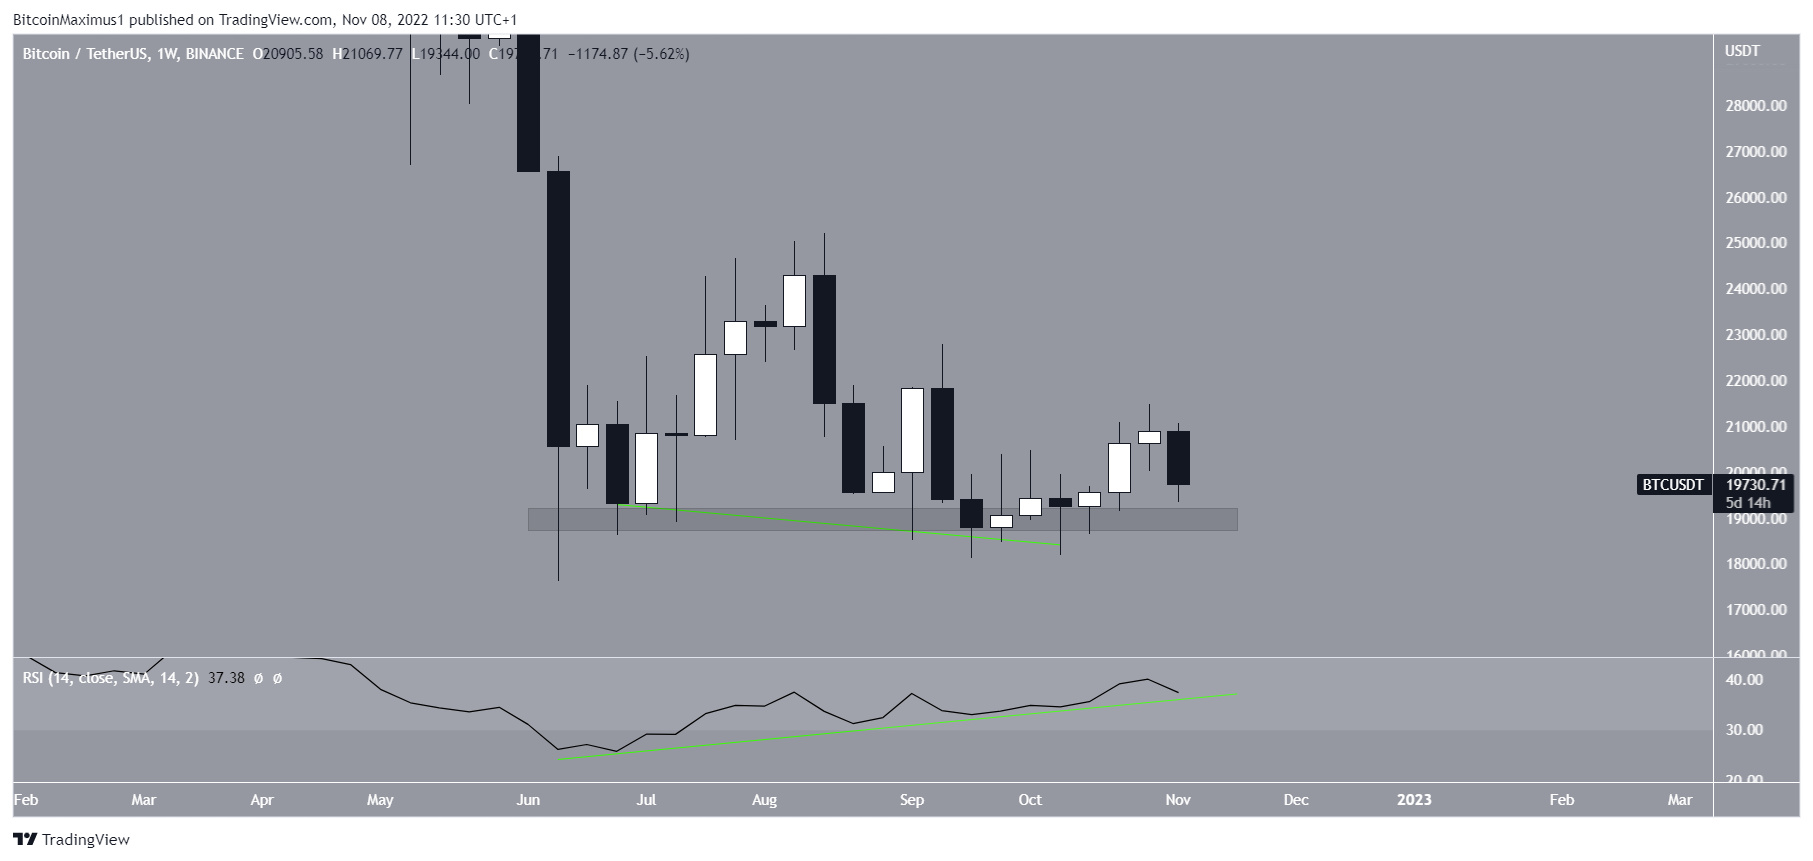
Bitcoin Price Holds Above Support
The Bitcoin (BTC) price has held above the $19,000 horizontal support area since June 2022. The area has been validated numerous times. Throughout this period, the weekly RSI generated bullish divergence (green line). Despite the ongoing decrease, the trend of the weekly RSI is still intact.
Therefore, the trend can still be considered bullish since the Bitcoin price is trading above the main support area and the RSI divergence is intact. A RSI breakdown and a weekly close below the $19,000 area would be required for the trend to turn bearish instead.
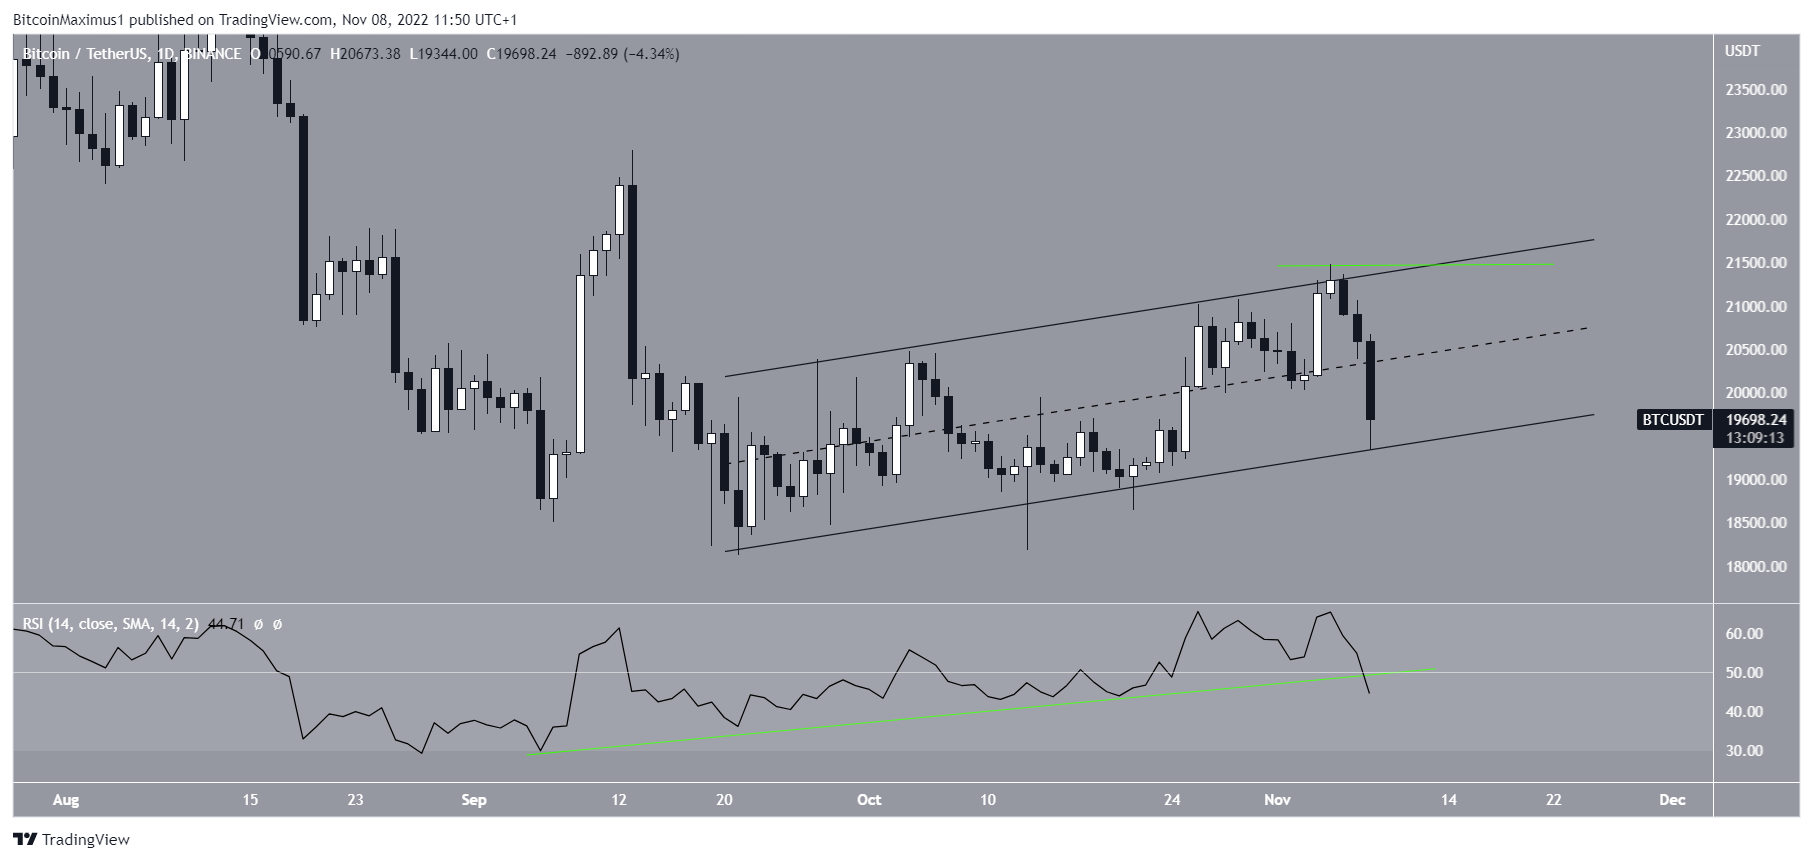
Key Levels For Continuation or Breakdown
The technical analysis for the daily chart shows that the Bitcoin price is trading inside an ascending parallel channel. After failing to break out on Nov. 5, it has returned to its support line.
Additionally, the daily RSI is barely holding on to its bullish divergence trend line, which has been in place since Sept. 5. A breakdown from these levels could accelerate the downward movement.
As a result, whether the BTC price breaks down from the channel, taking the RSI with it, or reverses and reclaims $21,470 (green line) instead will likely determine the direction of the future trend.
For BeInCrypto’s latest Bitcoin (BTC) analysis, click here.
Disclaimer: BeInCrypto strives to provide accurate and up-to-date information, but it will not be responsible for any missing facts or inaccurate information. You comply and understand that you should use any of this information at your own risk. Cryptocurrencies are highly volatile financial assets, so research and make your own financial decisions.


