


The Chainlink (LINK) price has been rallying since March 13. On July 6, the price broke out from its previous all-time high and has been moving upwards at an accelerated rate.
Current Move
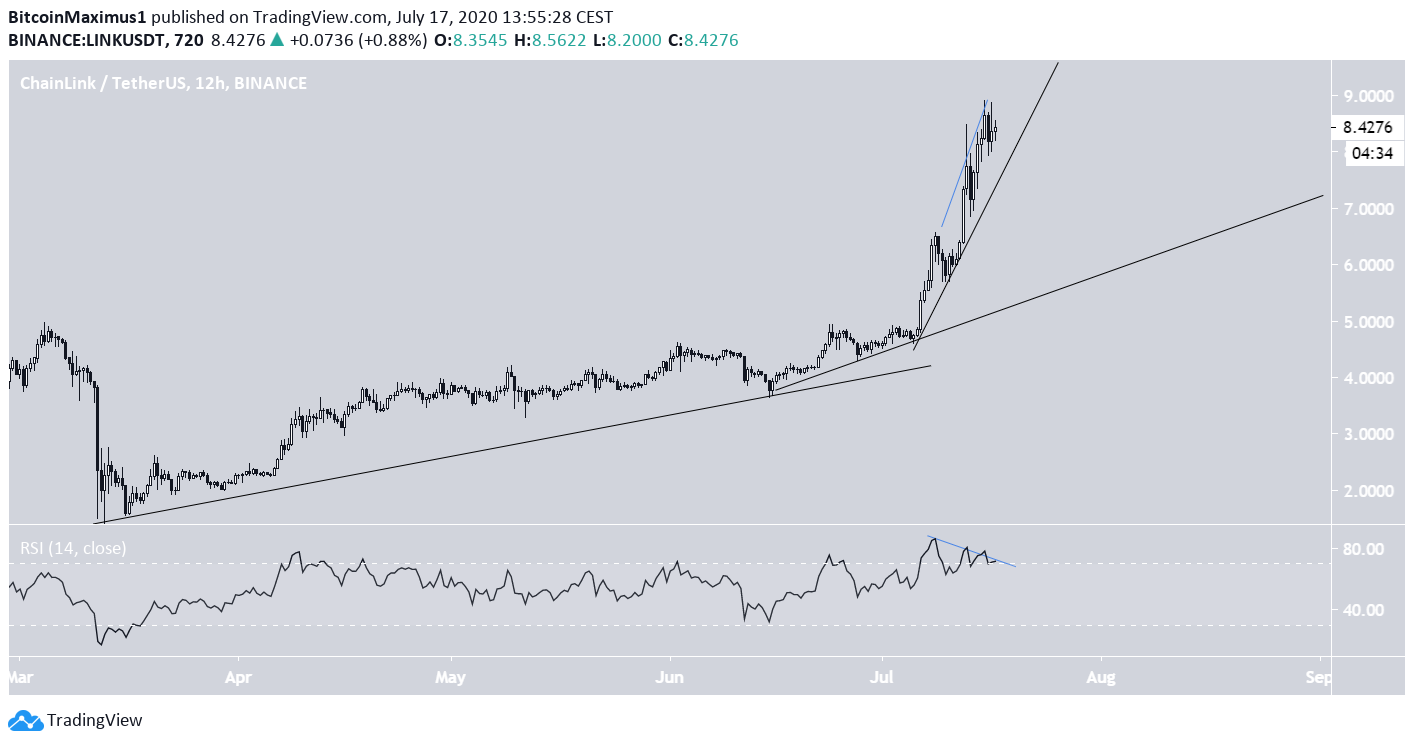
The LINK price has been increasing since it reached a bottom on March 13. After every drop, the rate of increase has intensified, and the price is currently in the third such cycle, creating a steeper rising support line each time.
The RSI has formed bearish divergence up to the 12-hour time-frame for the entirety of July. There are also numerous long upper wicks present, a sign of selling pressure.
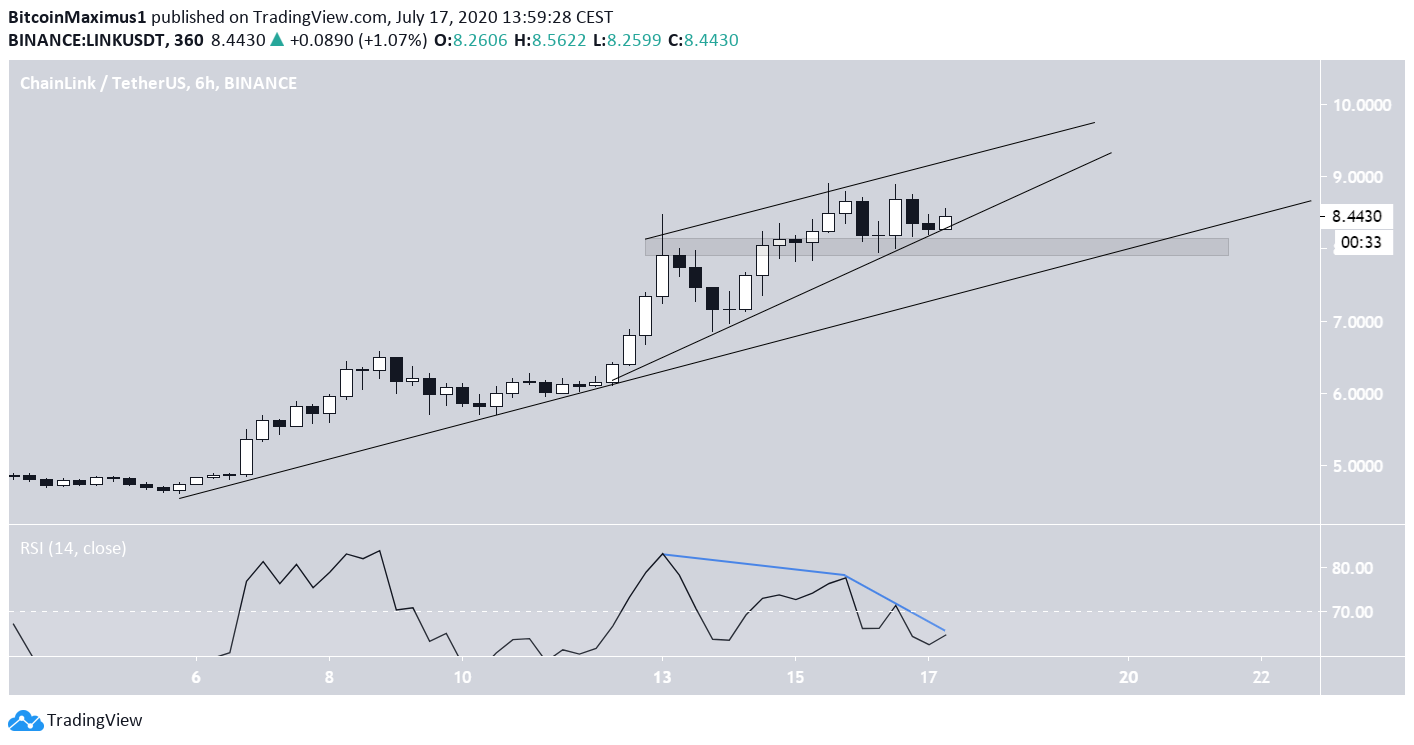
Over the shorter-term, the price has been trading inside an ascending wedge, which is a bearish reversal pattern. At the time of writing, the price was trading right at the support line of this wedge.
If the price breaks down, it would likely find support near $8, which is positioned at the gradual rising support line below.
Possible LINK Retracement
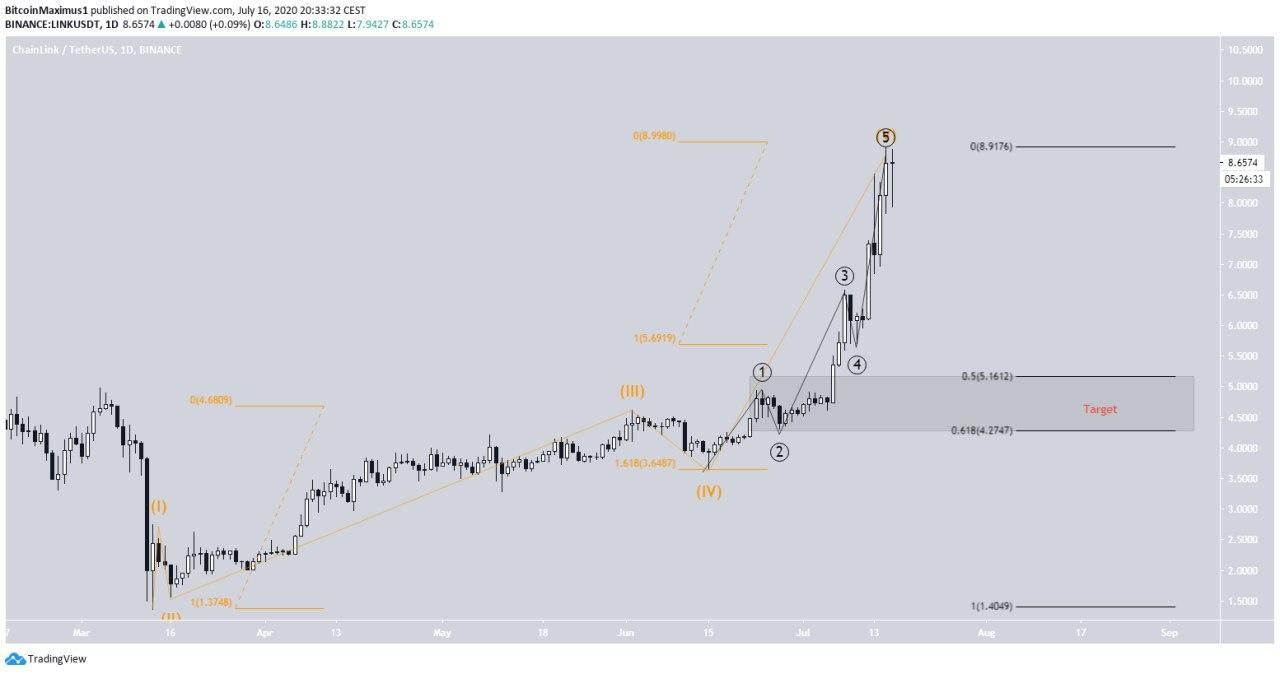
Cryptocurrency trader @PostyXBT outlined a LINK chart, stating that the price could fall back to its pre-breakout level.
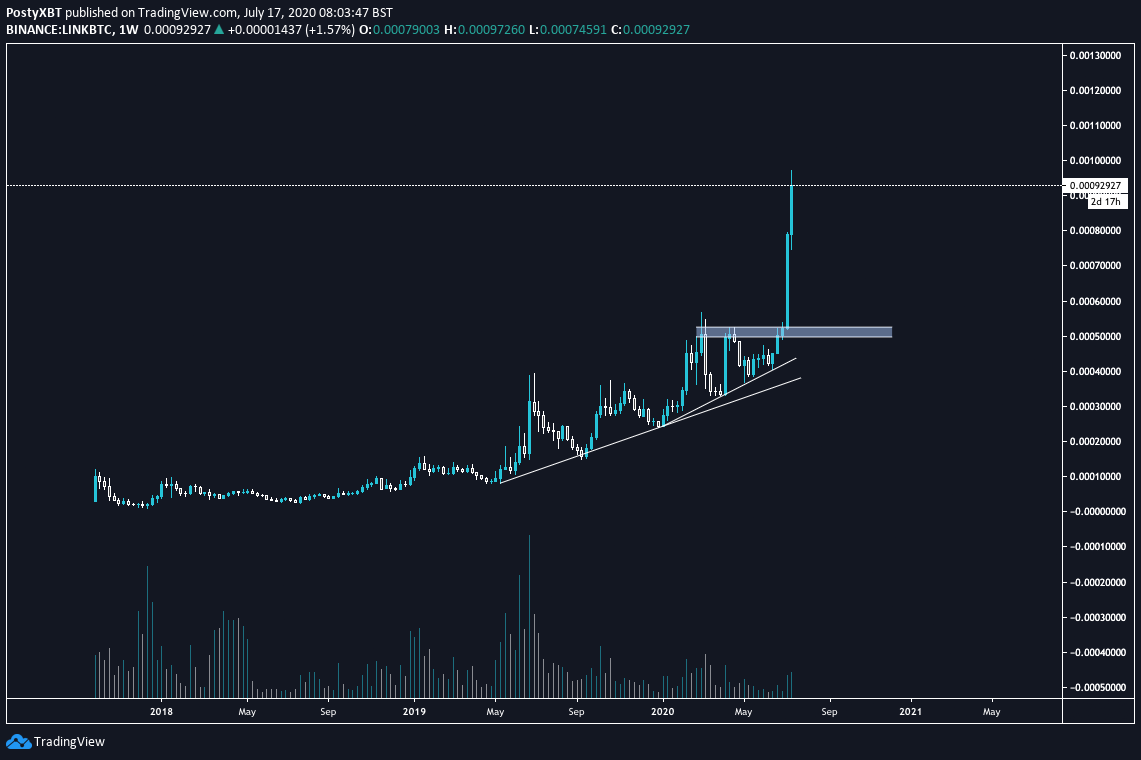
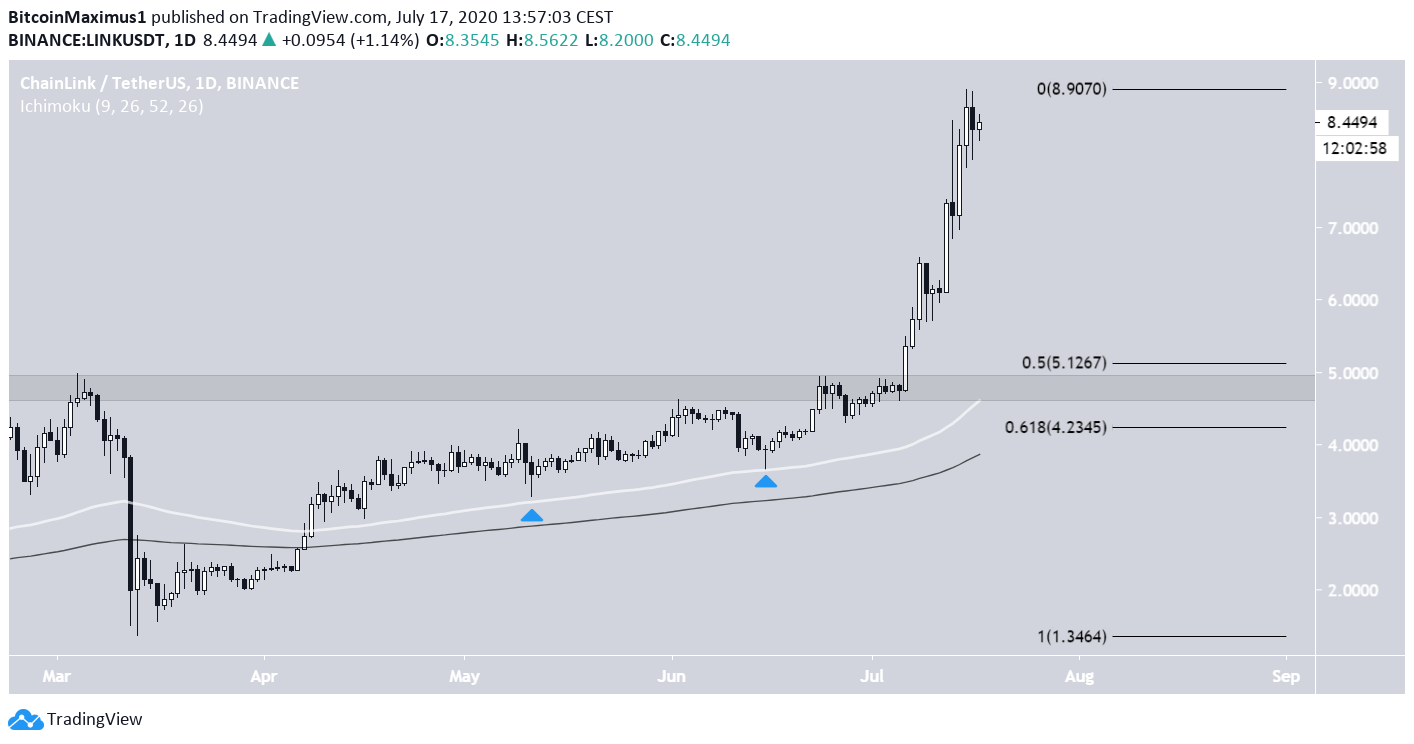
The pre-breakout level is found at $4.9 and is also between the 0.5 – 0.618 Fib levels of the entire rally, if we consider the current high as the top.
The $4.9 area is also strengthened by the 100-week moving average (MA), which has been a very good predictor of the trend, making it a very likely reversal level in case the price declines significantly. The 200-week MA may also come into play.
The wave count also supports such a decline. The price is in the process of finishing the fifth and final wave of an impulsive Elliott formation, after which a decline should follow.
Furthermore, measuring the length of waves 1 through 3, we find that the current wave 5 has extended to the 1.618 Fib level of waves 1 – 3, which is a common level for 5th wave extensions.
To conclude, the LINK price is nearing or has already reached a top, after which a corrective period is expected.


