


On March 23, the Digibyte (DGB) price reached a low of 52 satoshis. It immediately began an upward move which is still ongoing. To date, the price has increased by 462% since.
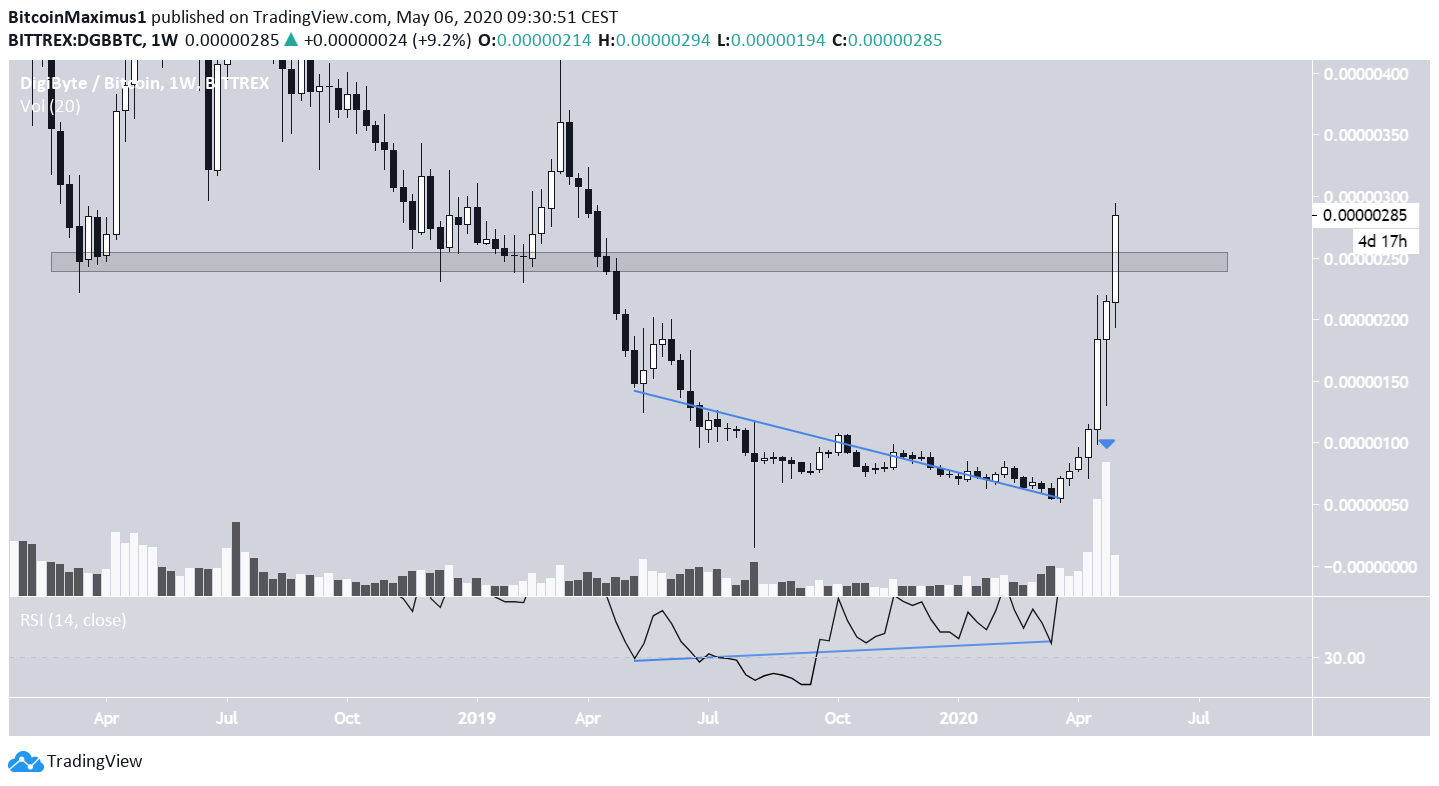
Using the weekly chart, we can see that the upward move was preceded by a very significant bullish divergence in the RSI, which is quite common for long-term trend reversals. Since the movement began, it has created seven successive green candles in a row.
Digibyte Keeps Pumping
Throughout the upward move, volume has been increasing constantly, peaking during last week’s candlestick.
The main area of interest is found at 250 satoshis. This area previously acted as support through the latter part of 2018 and beginning of 2019. Once the price broke down below it on April 2019, the rate of decrease greatly accelerated.
A breakout above this level and its subsequent validation as support would be a major bullish sign. However, the price has yet to reach a close above it. It is possible that DGB will close below this line, leaving a long upper-wick in its wake. This would be a bearish sign, indicating that the price was rejected and will begin to go back down.
If the price continues to increase instead, the next resistance area is found at 400 satoshis.
Wave Count
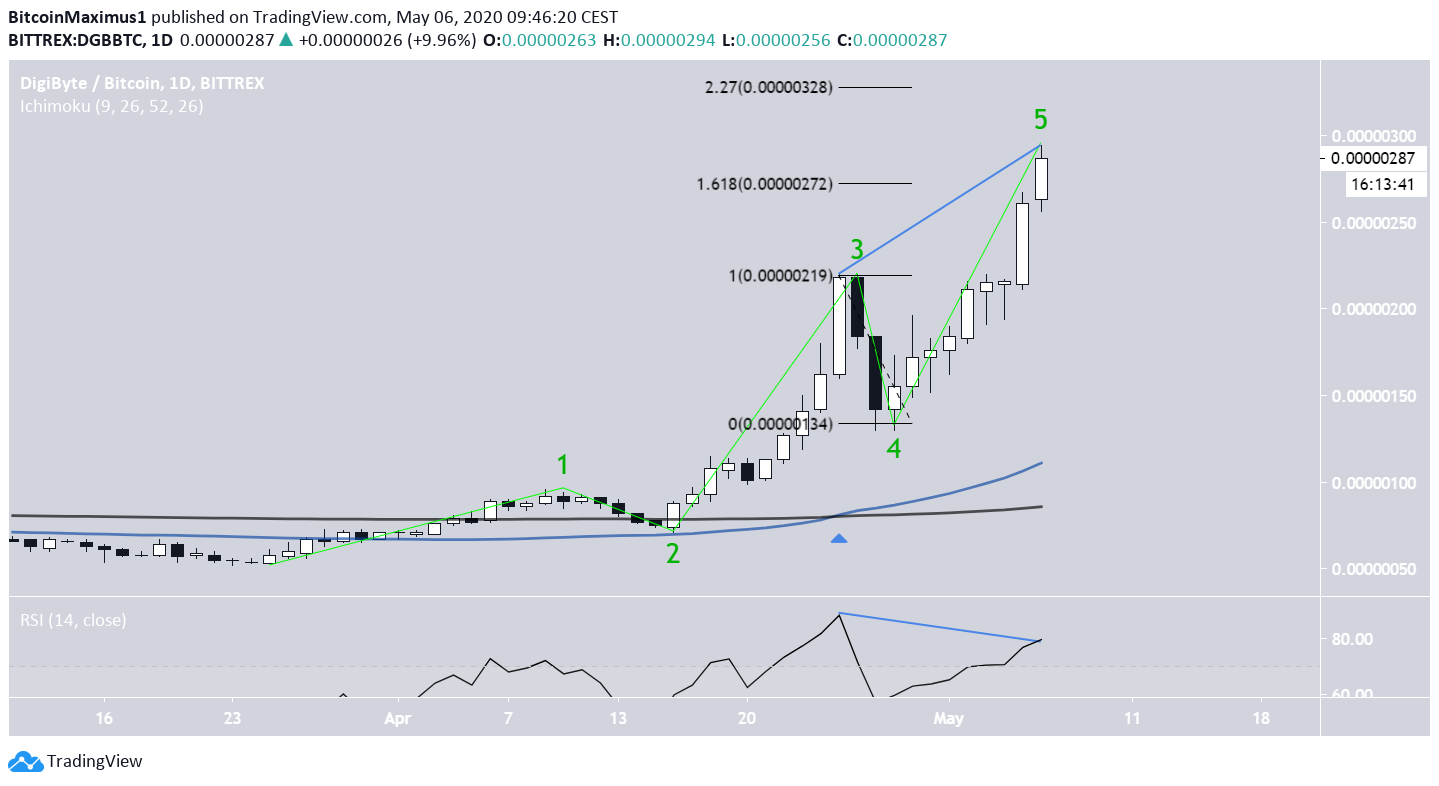
Beginning from March 23, we can outline a five-wave Elliott formation for the DGB price. The third wave was extended and was followed by a sharp drop. It seems that the price is currently in the fifth and final wave. In addition, there is bearish divergence developing in the daily RSI.
Therefore, it is possible that the price reaches a top soon, most likely between the 1.618 – 2.27 Fibonacci levels of the fourth wave. In relation to the 250 satoshi area outlined in the previous section, the price could definitely decrease below and validate it as resistance.
However, DGB has likely begun a long-term upward move, as evidenced by the bullish cross between the 50 and 200-day moving averages (MA).
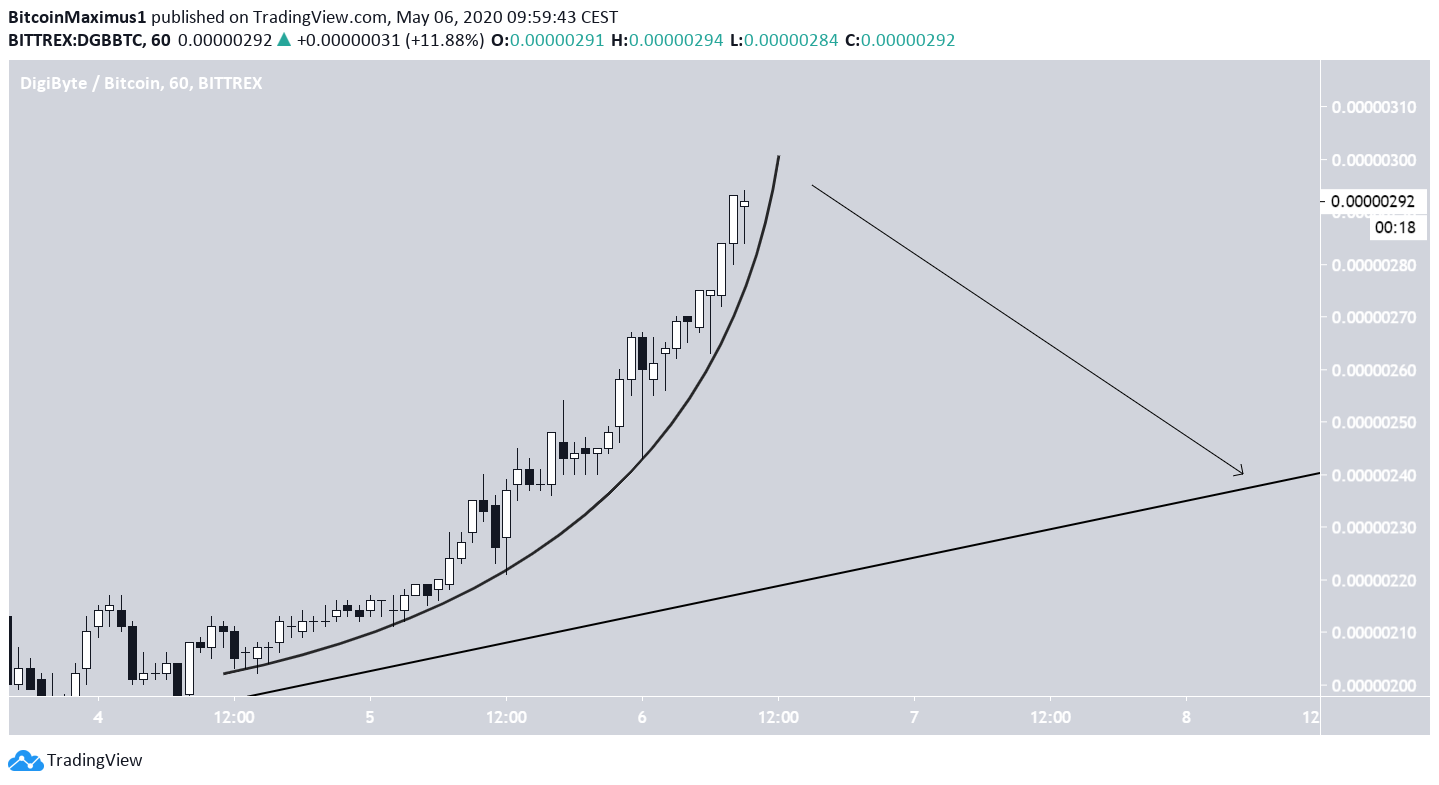
In the very short-term, we can see that the price is following a parabolic ascending support line, which is unsustainable in the long-run. However, it is quite common for fifth waves, in which the increase becomes parabolic.
A breakdown below this support line would indicate that the upward move has ended and a correction period awaits. If so, the price could decrease towards the longer-term ascending support line at 240 satoshis. This would fit with the hypothesis that the price gets rejected by the 250 satoshi area and begins to decrease.
To conclude, the DGB price has increased considerably over the past 44 days. However, it seems to be nearing the top of its upward move, and likely to begin a correction soon.


