


The Render Token (RNDR) price has reclaimed a crucial horizontal area and reached a new yearly high.
While the wave count supports the continuing increase, it also suggests that a top is nearby.
Render Token Price Reclaims Key Level and Reaches New Yearly High
The RNDR price has moved upward since the beginning of the year. The price broke out above the $2.10 horizontal resistance area at the end of April. However, instead of validating it as support, the price fell below it on May 8.
The decrease was preceded by a bearish divergence in the RSI (green line). A bearish divergence occurs when a momentum increase does not accompany a price increase and often leads to bearish trend reversals.
By using the RSI as a momentum indicator, traders can determine whether a market is overbought or oversold and decide whether to accumulate or sell an asset.
If the RSI reading is above 50 and the trend is upward, bulls have an advantage, but if the reading is below 50, the opposite is true.
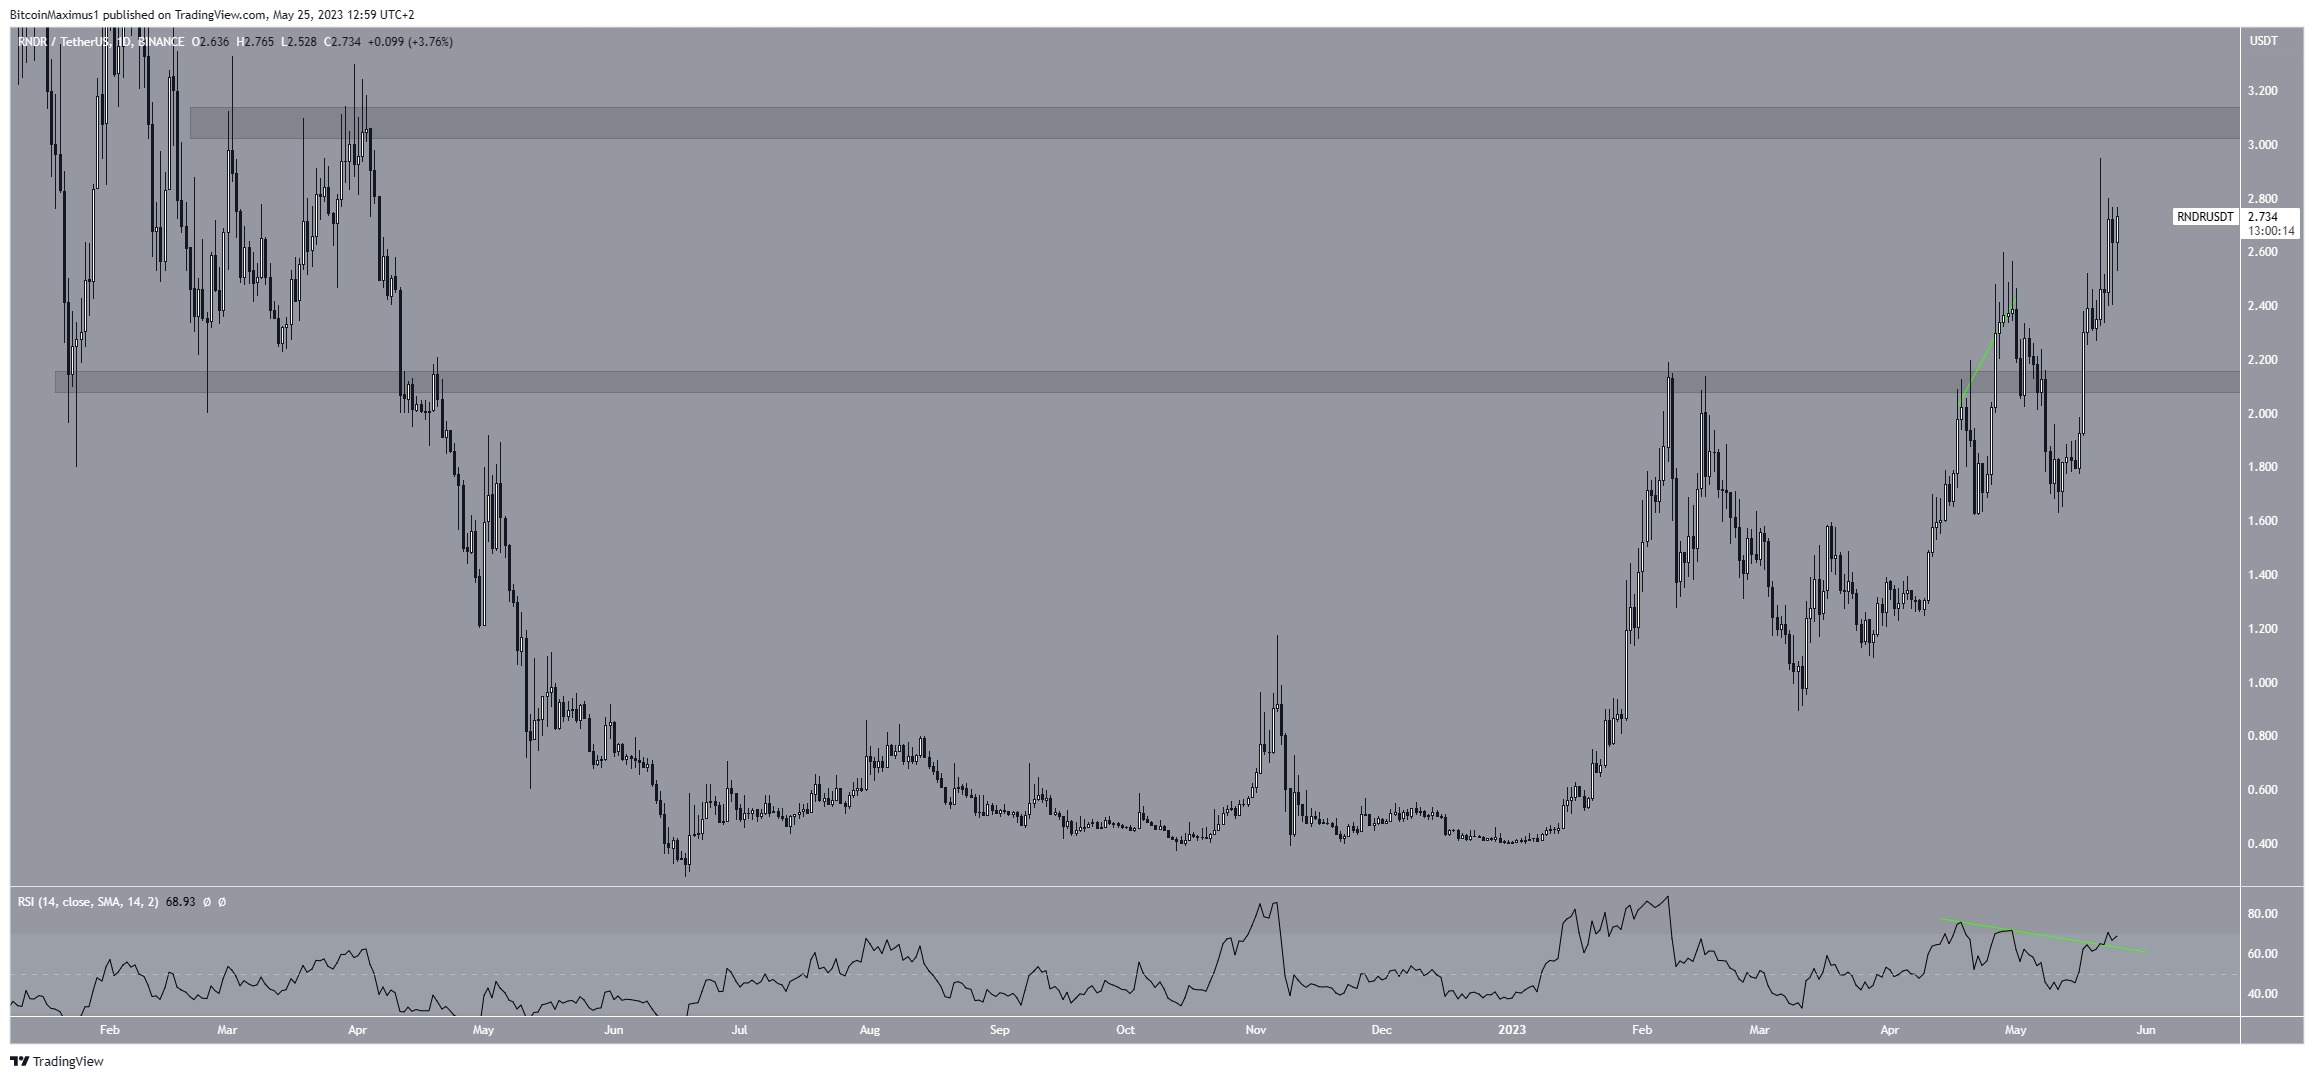
Despite the initial drop, the RNDR price has increased since May 11, reclaiming the $2.10 area in the process. During this time, the RSI broke out from its bearish divergence trendline.
Both of these are considered bullish signs that often lead to upward movements. After RNDR regained its footing, it reached a new yearly high of $2.42 on May 20.
RNDR Price Prediction: Wave Count Predicts Top
The technical analysis from the 12-hour time frame gives a bullish RNDR price prediction, mostly because of the wave count. However, it also suggests that a top may soon be reached.
Since the beginning of March, RNDR has been mired in a five-wave upward movement (black). If so, it is currently in the fifth and final wave of this increase.
The most likely target for the top of the movement is $3.30. This would give wave five the same length as waves one and three combined. Additionally, the level coincides with long-term resistance from the daily time frame.
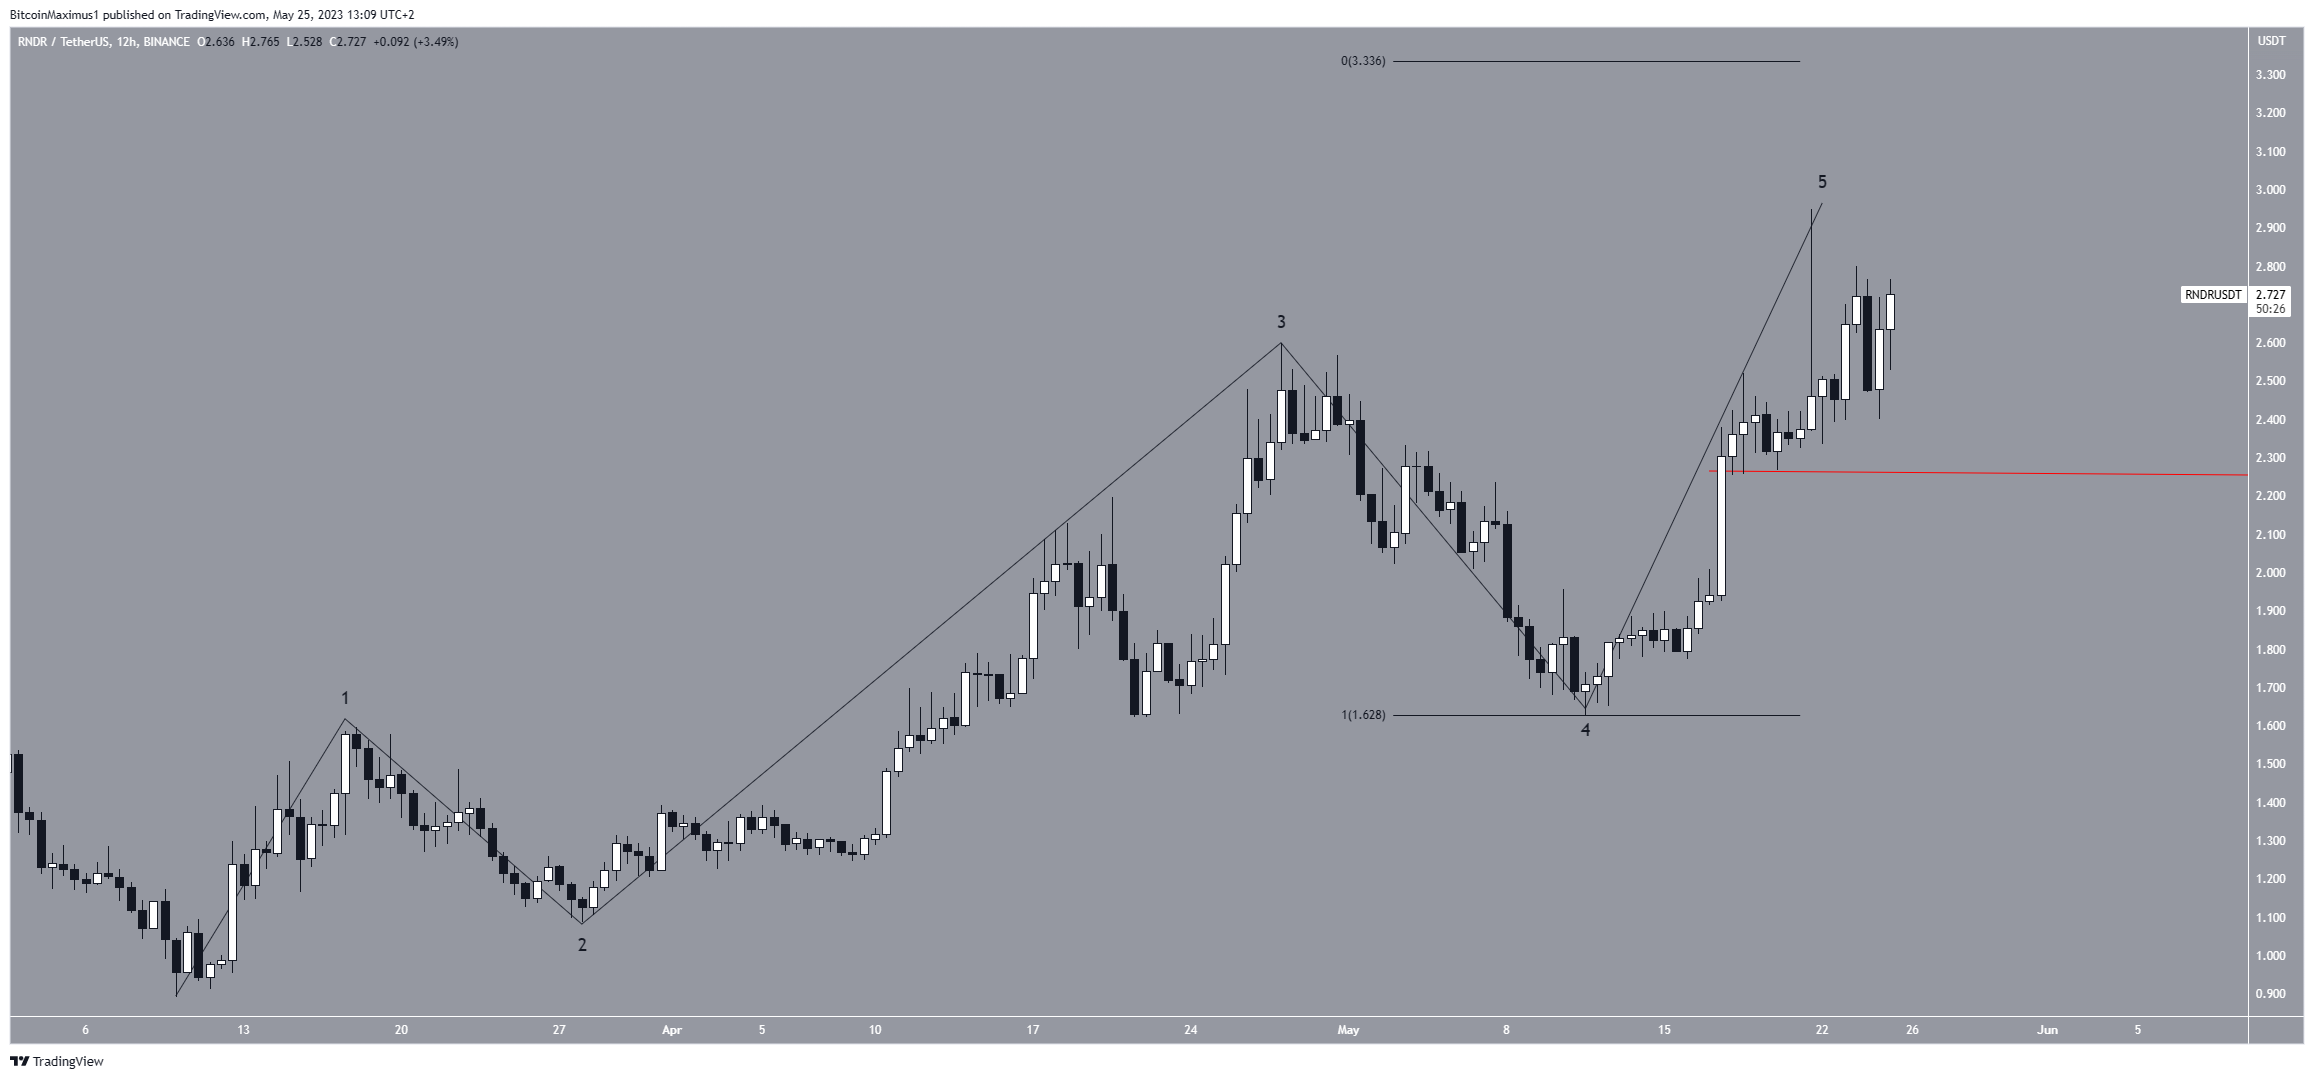
Despite this bullish RNDR price prediction, a drop below the $2.26 local low (red line) will mean that the top is in and a correction has begun.
In that case, the price could fall to the $1.65 support area.


