

Hedera Hashgraph (HBAR) has been moving upwards over the past three days and is showing strong signs that it has already made a bottom.
The weekly chart for HBAR provides a relatively neutral outlook.
On the bearish side, the token fell below the $0.435 area, after previously moving above it on Sept 13-17. The entire portion of the upward movement that led to the all-time high is now just a long upper wick, which is considered a sign of selling pressure.
On the bullish side, HBAR has bounced at a long-term ascending support line that has been in place since February. This is the fifth validation of the line as support.
Technical indicators provide a neutral outlook.
The MACD, which is created by short and long-term moving averages (MA), is decreasing but is not yet negative. This means that while the short-term MA is decelerating when compared to the long-term average, it\s still faster.
The RSI, which is a momentum indicator, is right at the 50-line. This is a sign of a neutral trend.

Ongoing bounce
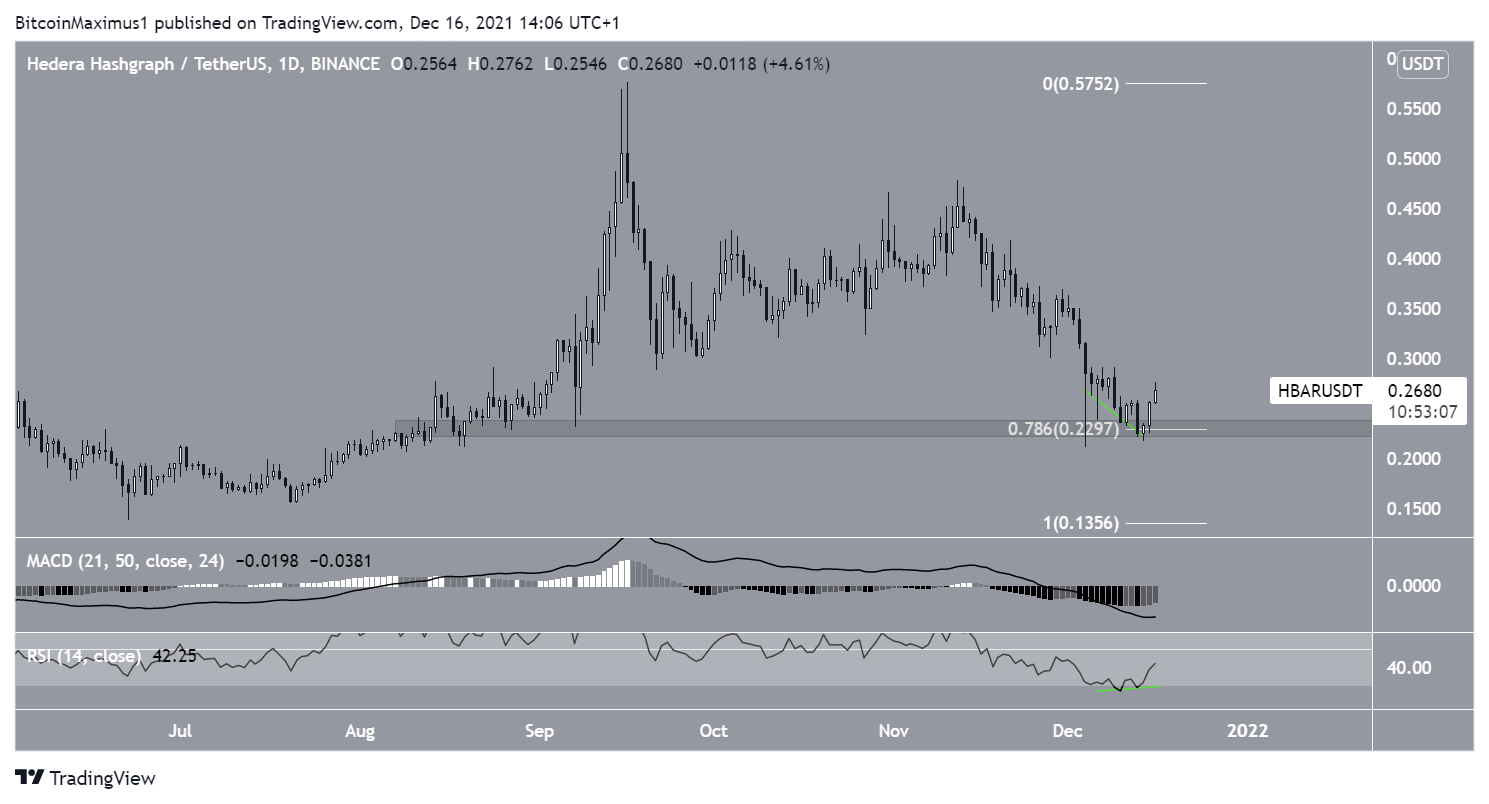
The daily chart provides a more bullish outlook. HBAR has bounced at the $0.23 horizontal support area, which is also the 0.786 Fib retracement support level. Since it coincides with the previously outlined ascending support line, it further increases its significance.
In addition to this, technical indicators are gradually turning bullish.
While the MACD is still negative, it has created successive higher momentum bars. This means that the short-term MA has begun to accelerate. It often occurs during the beginning of upward movements.
Also, the RSI has bounced and is in the process of moving towards the 50-line.
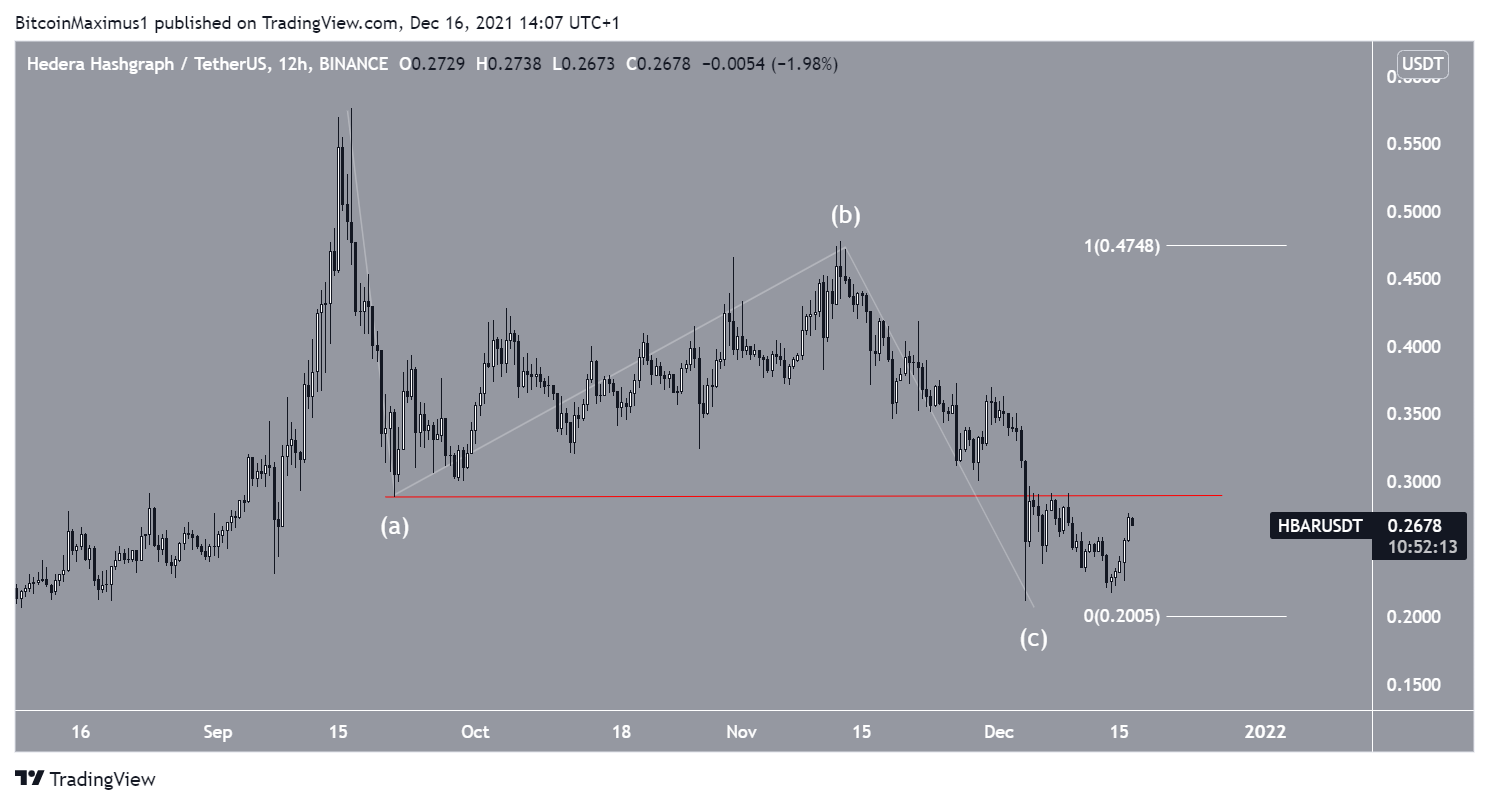
Furthermore, it is interesting to note that the downward movement of September and that of November have an almost 1:1 ratio. Therefore, it is possible that the entire downward movement since Sept is an A-B-C corrective structure since this is the most common ratio in such structures.
A movement above the A wave low (red line) at $0.296 would confirm this.
If correct, it would mean that HBAR has completed its correction and will now continue moving higher.
Short-term HBAR movement
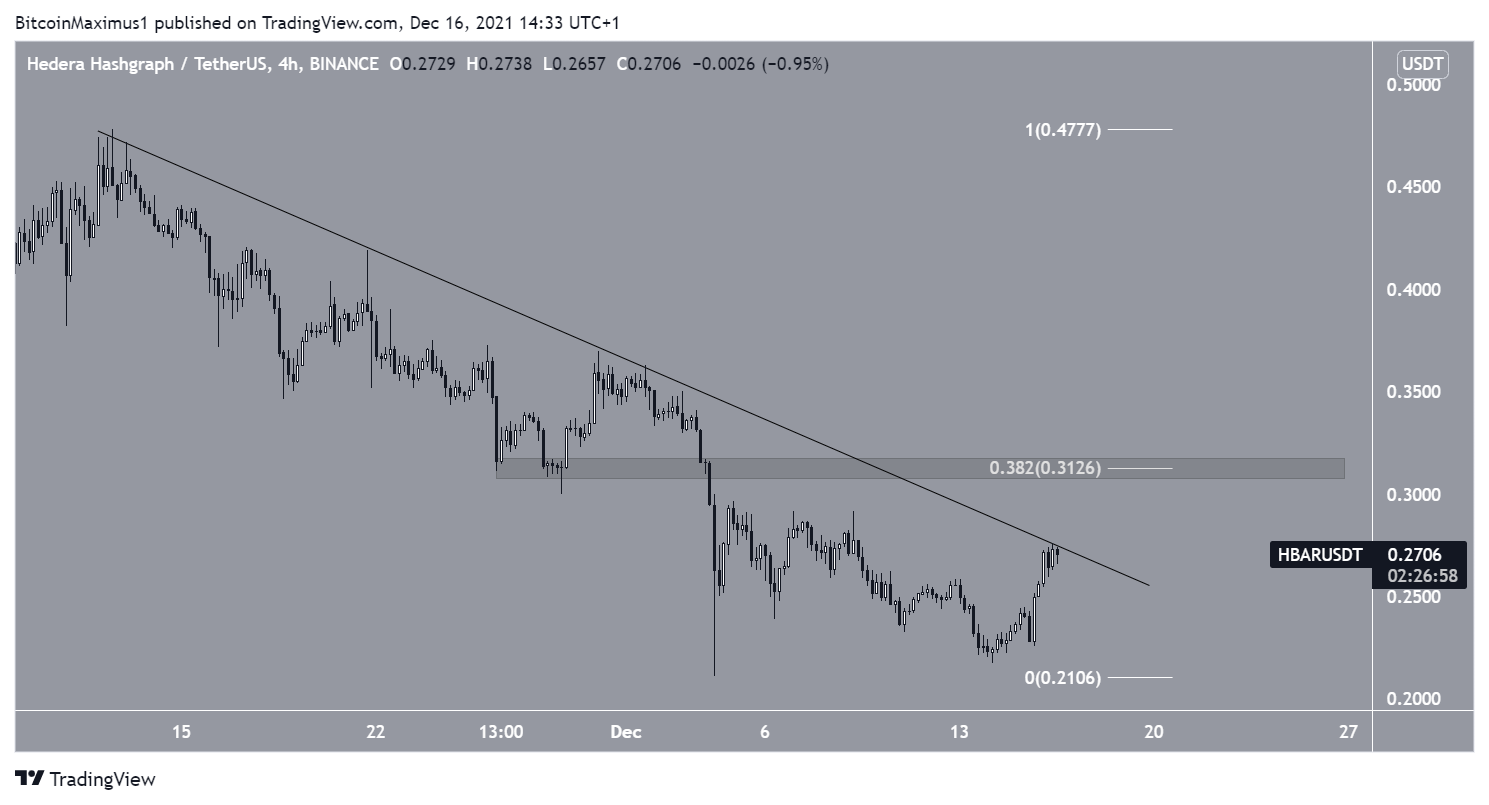
Cryptocurrency trader @Crediblecrypto outlined an HBAR chart, stating that the token is likely to increase towards the $0.30 area in the short term.

The main short-term resistance area is indeed at $0.31. This is both a horizontal resistance area and the 0.382 Fib retracement resistance level.
Currently, HBAR is in the process of breaking out from a short-term descending resistance line. If successful, it would likely increase at least to the $0.31 area, and potentially higher.
A breakout above the $0.31 area would be a very bullish development that would go a long way in confirming that HBAR has bottomed.
For BeInCrypto’s latest Bitcoin (BTC) analysis, click here
Disclaimer
All the information contained on our website is published in good faith and for general information purposes only. Any action the reader takes upon the information found on our website is strictly at their own risk.
