Hedera Hashgraph (HBAR) has been consolidating since December and has begun to generate bullish reversal signals.
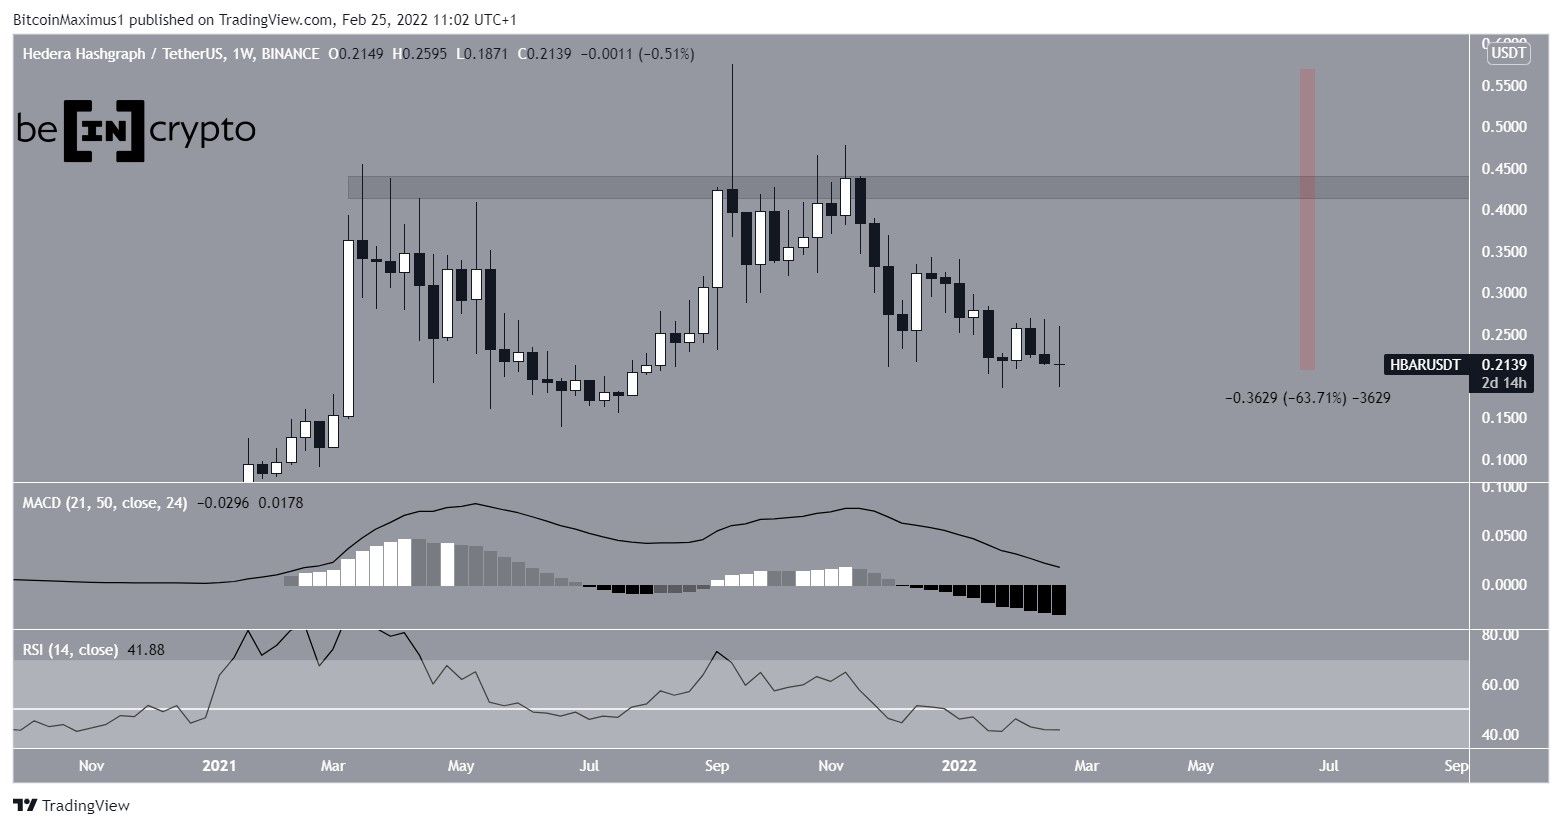
Hedera Hashgraph has been falling since reaching an all-time high price of $0.57 on Sept 16. On Nov 12, the price made another attempt at moving upwards but was rejected by the $0.43 long-term resistance area. The downward move led to a low of $0.187 on Feb 24. Measuring from the all-time high price, this amounted to a decrease of nearly 64%.
Technical indicators are neutral, leaning on bearish.
Both the RSI and MACD are falling. While the RSI is currently below 50, the MACD has yet to cross into negative territory. If this occurs, it would be a strong sign that the trend is bearish.
Bullish HBAR pattern
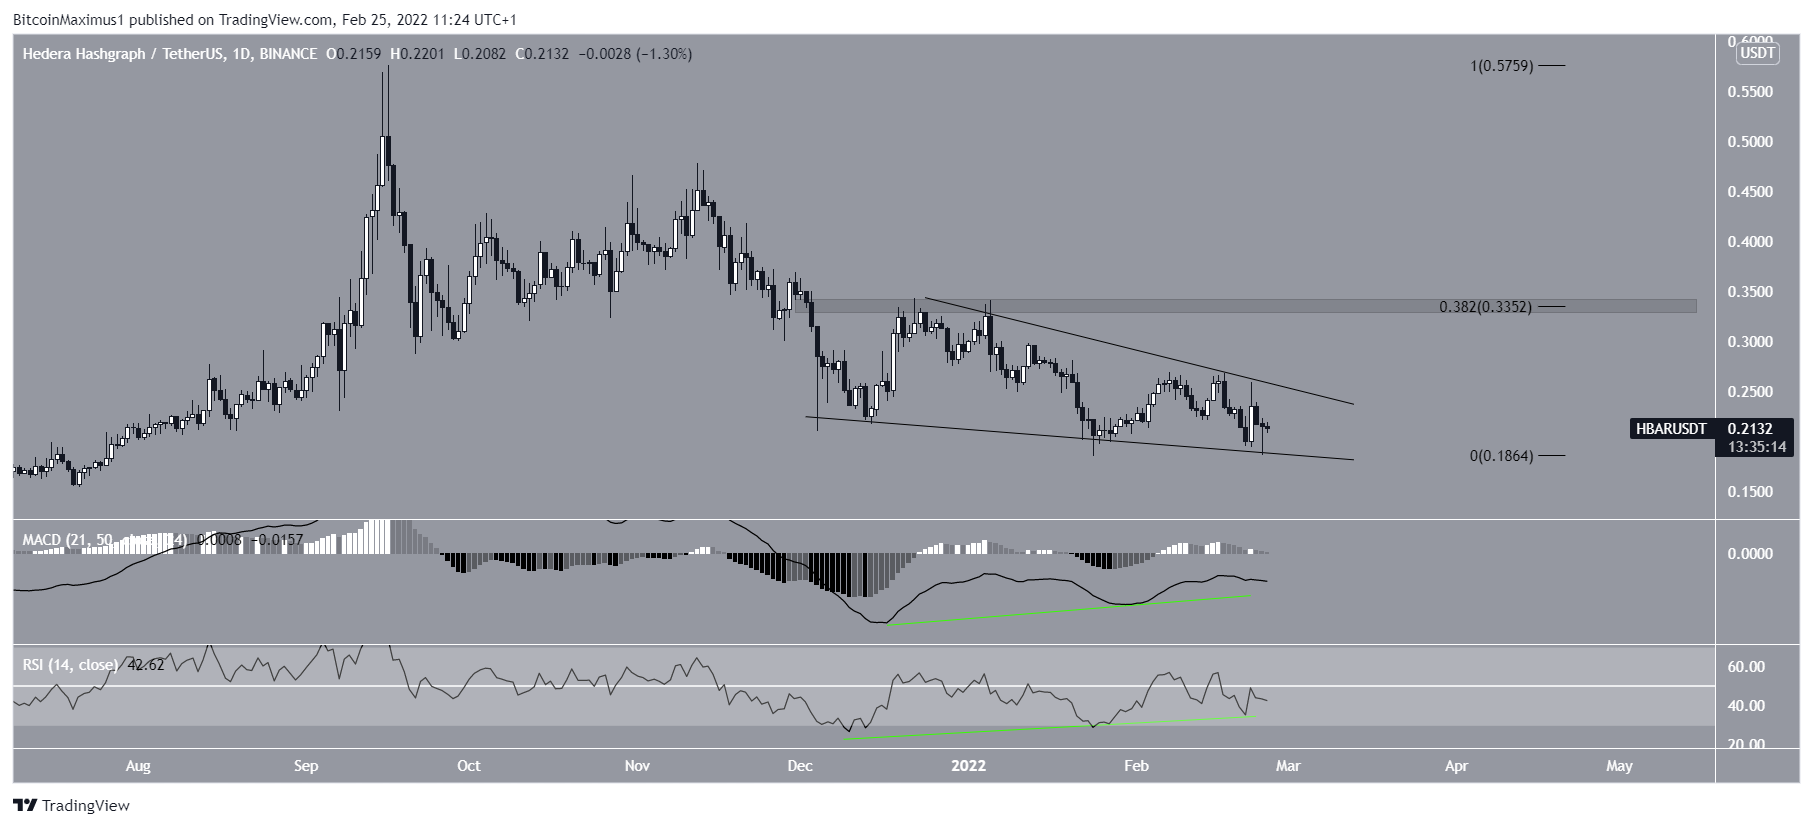
Despite the bearishness from the weekly time frame, the daily chart looks more bullish, since HBAR has been trading inside a descending wedge since Dec 4. The descending wedge is normally considered a bullish pattern. Therefore, a breakout from the pattern would be the most likely scenario.
In addition to this, both the MACD and RSI have generated significant bullish divergences (green lines). Such occurrences very often precede bullish trend reversals.
If a breakout from the pattern transpires, the closest resistance area would be found at $0.33. This target is both a horizontal resistance area and the 0.382 Fib retracement resistance level.
Wave count analysis
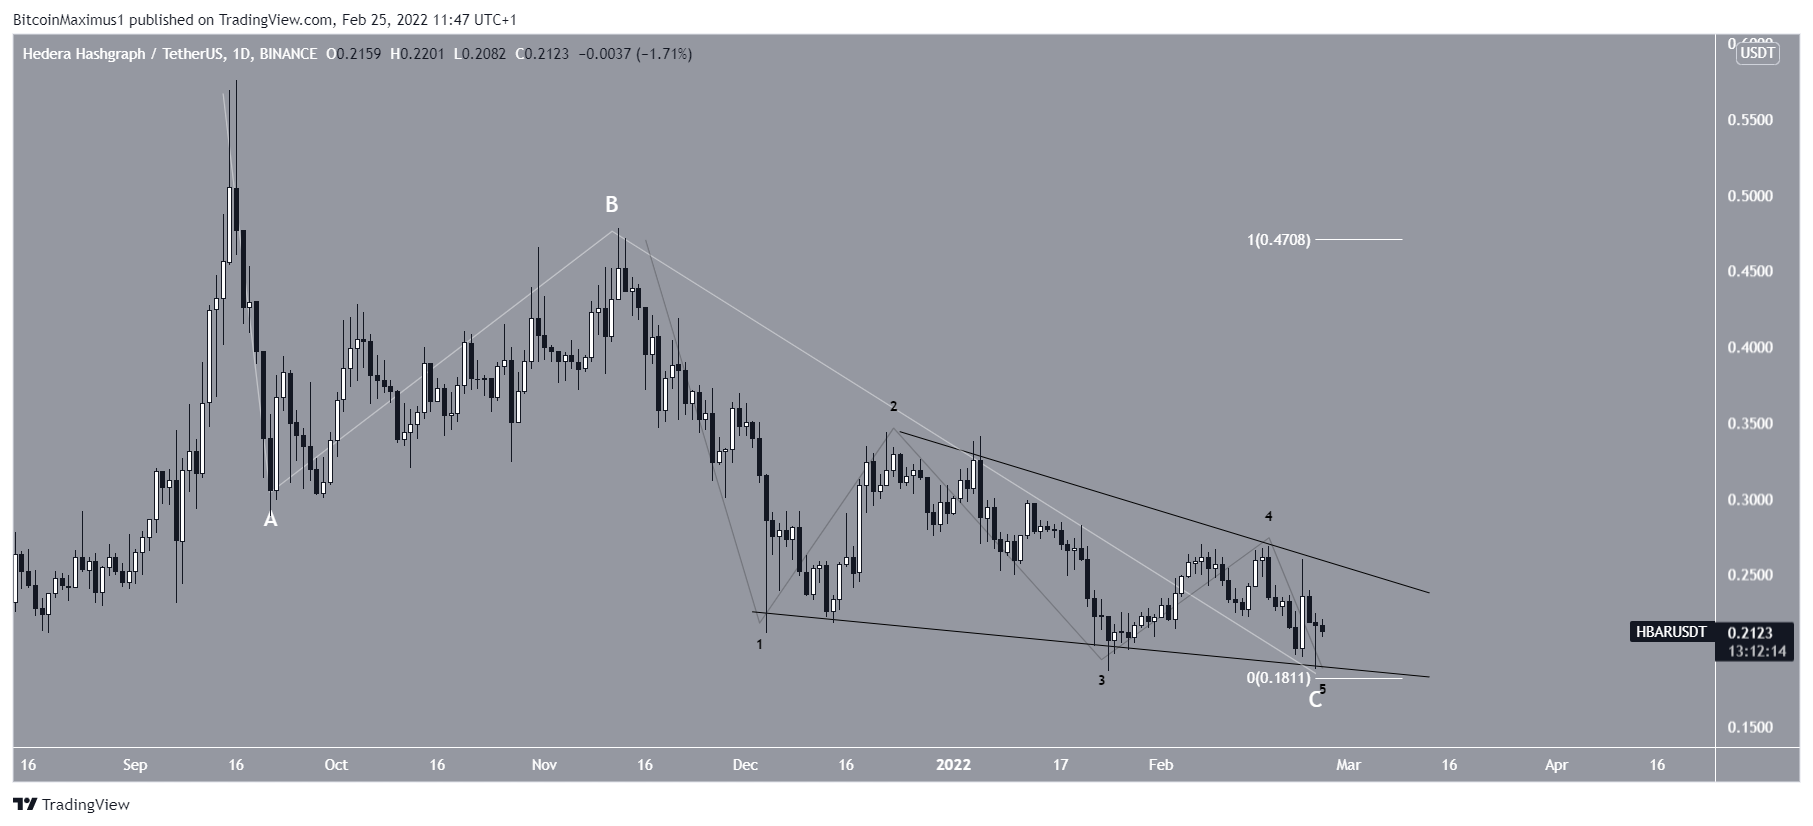
Cryptocurrency trader @24kcrypto tweeted an HBAR chart, showing that the price is correcting inside what is likely wave four.
It seems likely that the decrease from the all-time high price is an A-B-C corrective structure (white) where waves A and C had an exact 1:1 ratio.
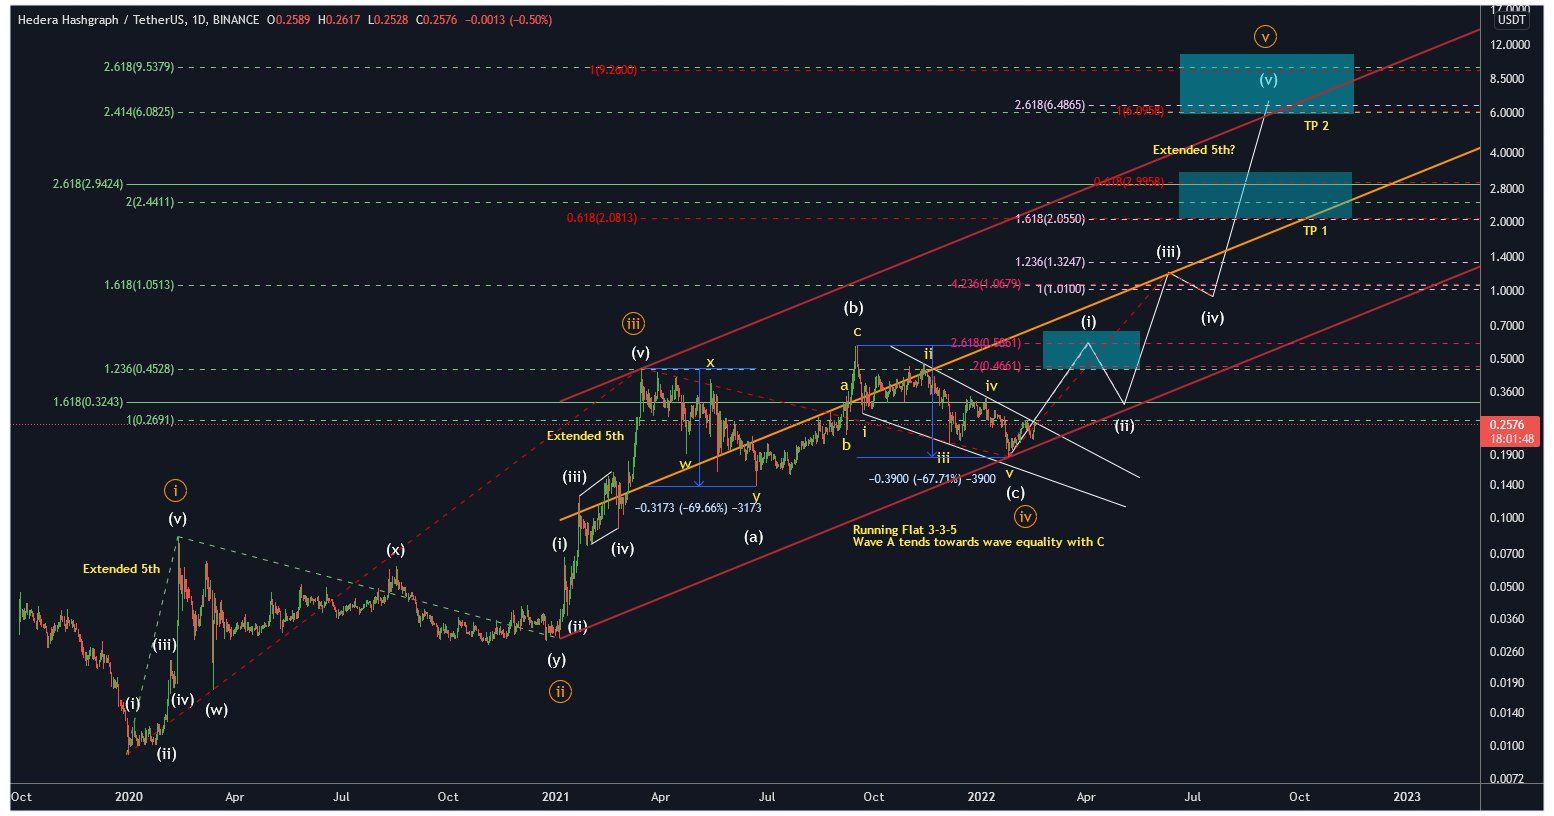
The sub-wave count is shown in black and we can see that wave C developed into an ending diagonal. Such formations are usually succeeded by a significant and swift movement in the other direction.
Therefore, the wave count supports the findings from the bullish divergences and indicates that HBAR breaking out above the wedge is the most likely scenario.