
Over the past three months, the crypto market has witnessed a fierce “liquidity sweep,” with long and short positions using low to medium leverage being wiped out in succession.
This reflects the reality that the current market lacks a clear dominant force, and it is driven primarily by bidirectional liquidity hunts.
Mass Liquidations for Bitcoin
According to data from Alphractal, 94% of traders were liquidated during this period. When applying a 50% Liquidity Threshold filter, only densely concentrated liquidity zones remain. This indicates that price has actively “sought out” large order clusters to clear positions.
Ethereum has experienced a similar scenario, with both long and short positions heavily impacted over the past 30 days.
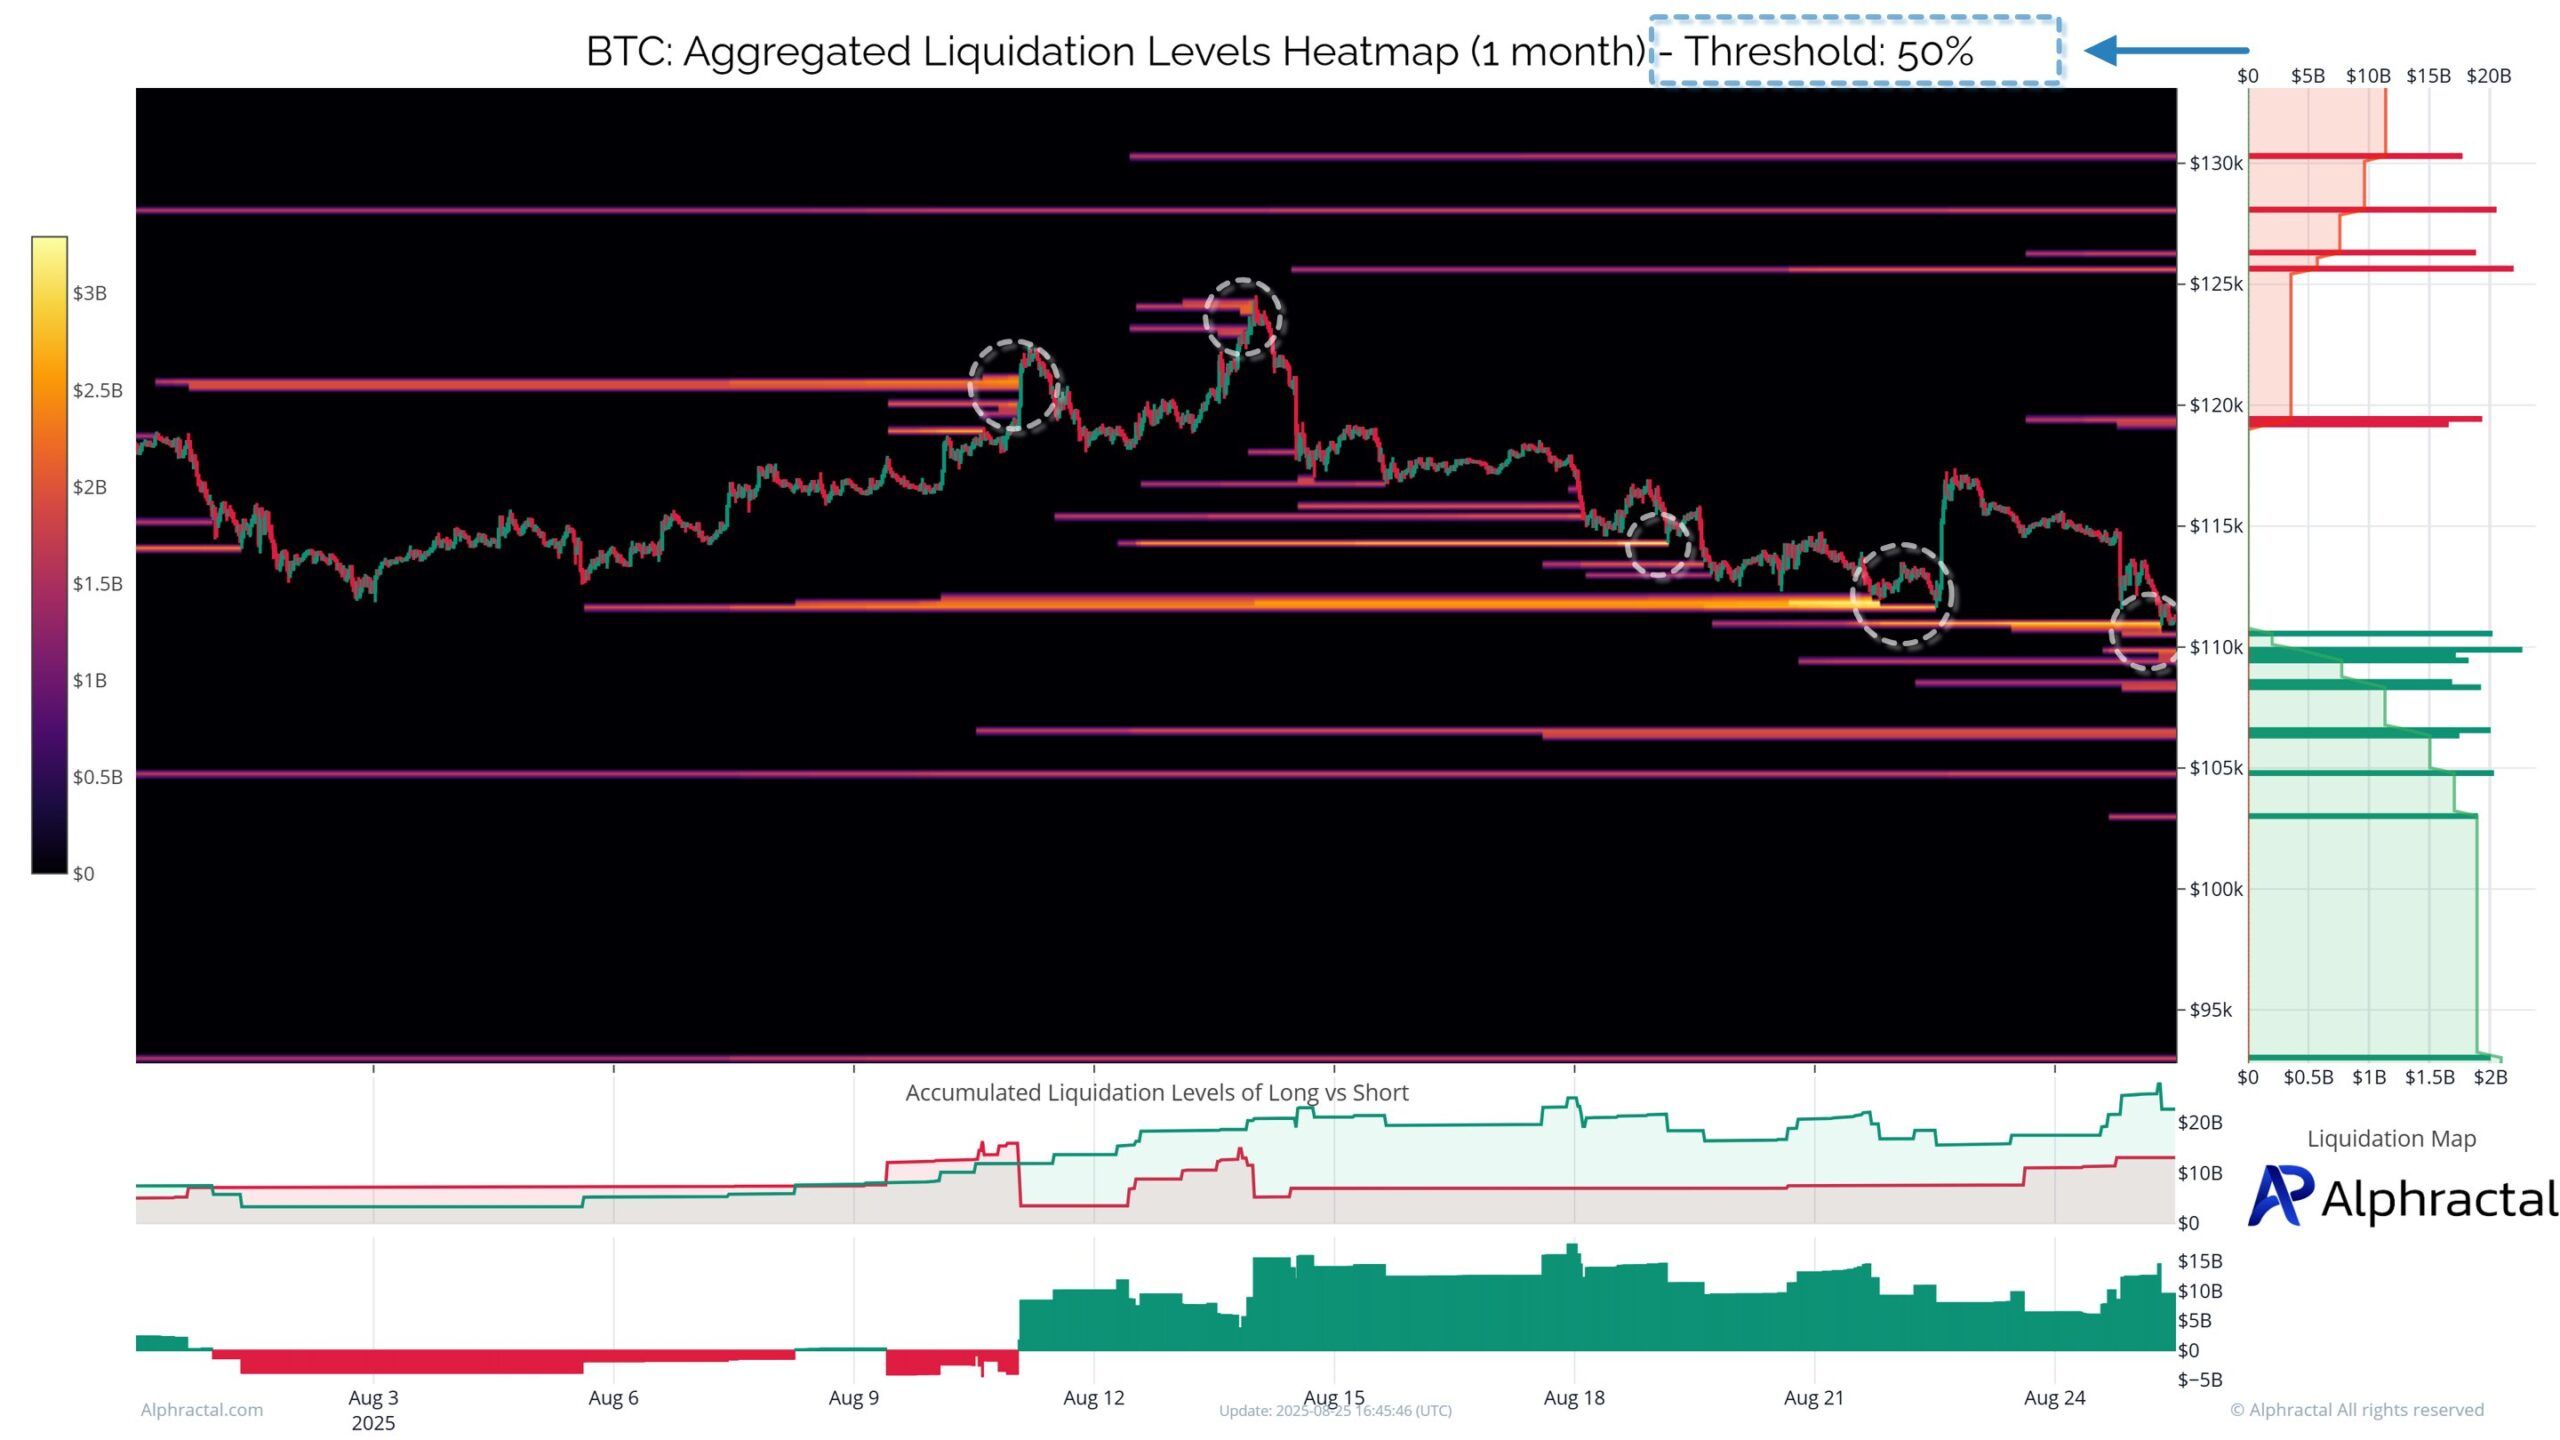
For Bitcoin, the most prominent feature is the formation of a massive long cluster around $104,000–$107,000. This concentrated liquidity zone aligns with the $100,000–$107,000 support zone, which Analyst Axel Adler Jr. identified based on on-chain data.
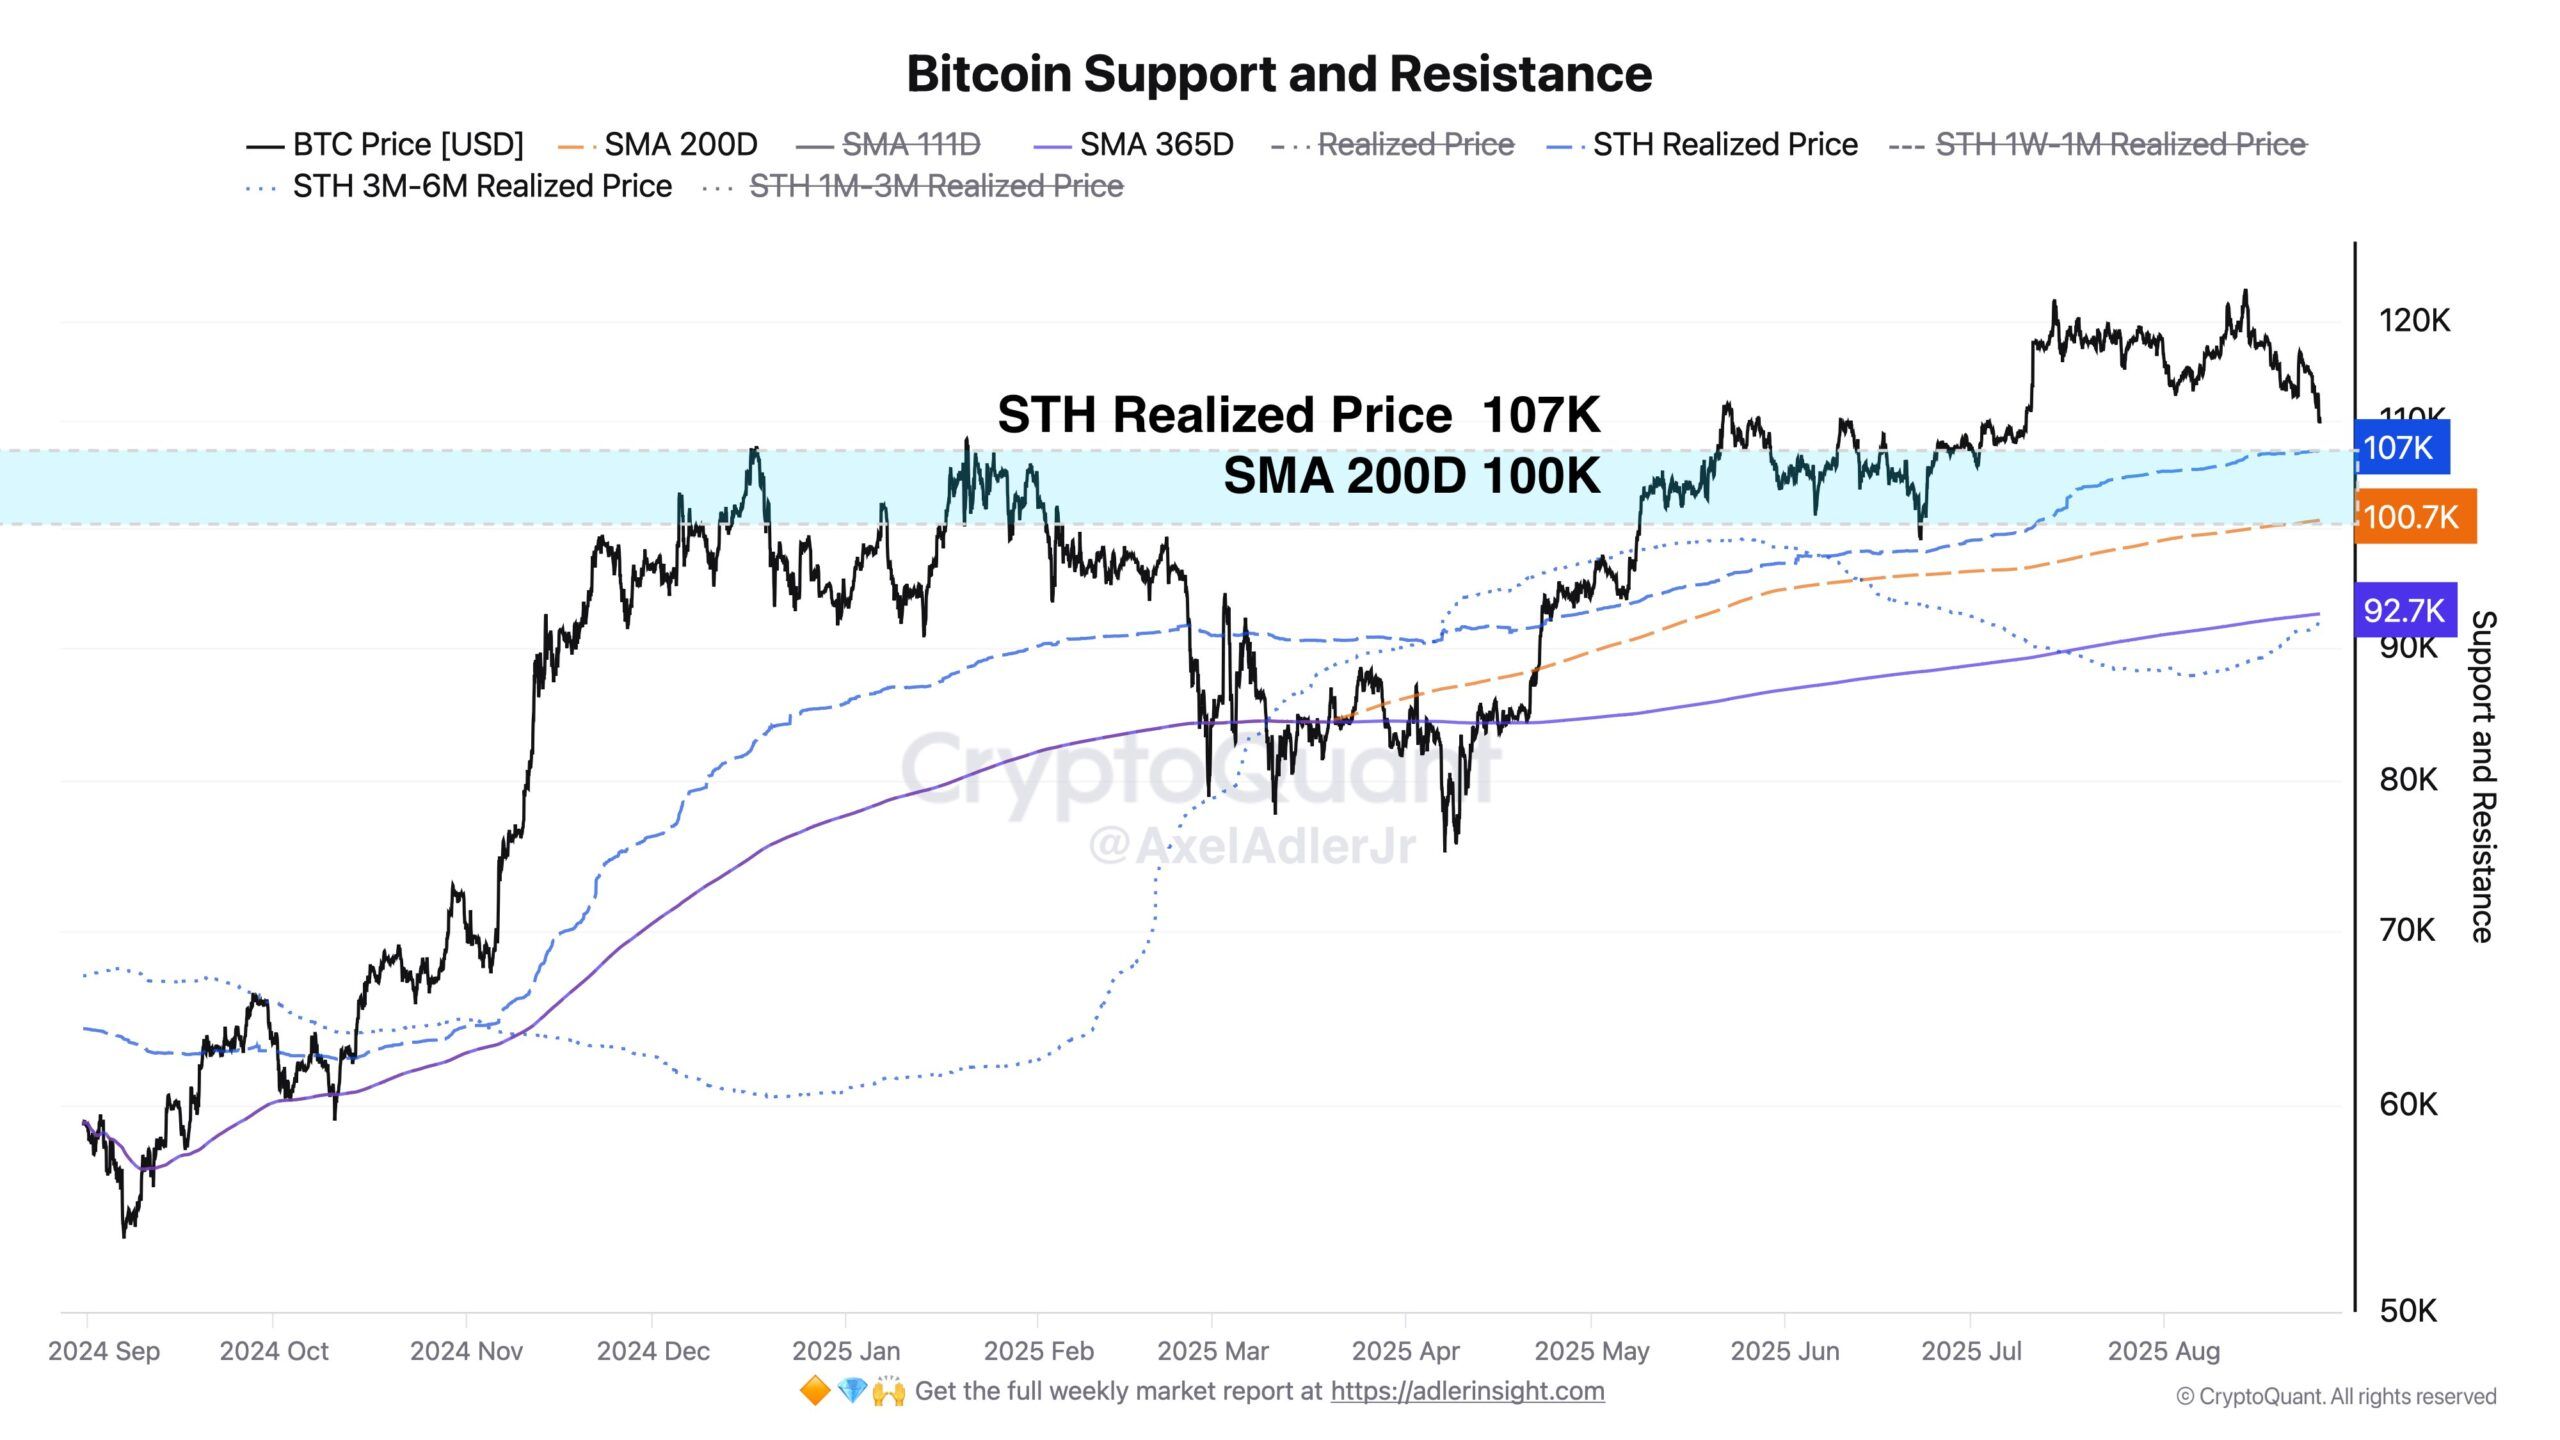
Specifically, this level marks the intersection of the Short-Term Holder Realized Price (the average cost basis for short-term investors) and the 200-day SMA. This factor bolsters the reliability of this support zone’s “defensive” role. Many experts predict that if this zone is breached, a deeper retreat to the $92,000–$93,000 range will occur.
“The nearest strong support zone is the 100K–107K range, where the STH Realized Price and SMA 200D intersect. Below that is additional support around 92–93K, a deeper support level reflecting the cost basis of short-term investors who held coins for 3 to 6 months. This will become a key second line of defense if the market loses the 100K–107K level.” Axel Adler Jr stated.
As BeInCrypto reported, Bitcoin’s spot taker activity has turned sell-dominant, highlighting fading buy-side demand and risk of a drop toward $107,557 support.
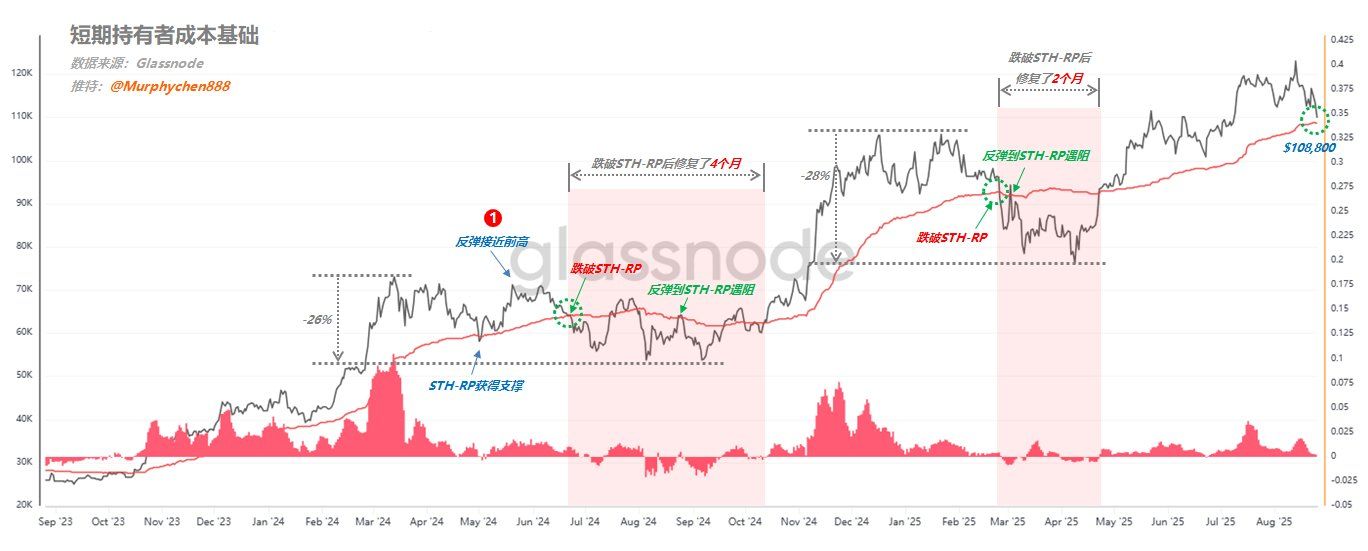
Conversely, the $108,800 level is the short-term dividing line between a bull and bear market. According to Murphy Chen, this represents the short-term cost basis for investors.
A stable close above this threshold signals a significant reduction in selling pressure. However, losing this level could trigger a short-term sell-off.
In other words, the $108,800 zone is the “gateway” that determines whether Bitcoin sustains its upward momentum or enters a deeper correction phase.
“Currently, at $108,000, it’s a 13% drop from the high. If STH-RP is breached, theoretically there would still be 10-15% downside space. Without the cooperation of negative events of the same magnitude, the correction amplitude may not exceed the previous two instances,” Murphy Chen stated.
The market has liquidated 94% of accounts over the past three months. This highlights the dangers of high-leverage trading during a market dominated by liquidity hunts.
As the 50% filter highlights, trading near large liquidity clusters often carries high risk. This makes defensive strategies, stop-loss placement, and position management more critical.
