
Hedera’s native token, HBAR, is under renewed selling pressure, shedding nearly 5% in the past 24 hours. This comes as broader market weakness drags crypto prices lower.
The bearish sentiment surrounding the HBAR token price continues to intensify, with on-chain data pointing to growing pessimism among traders.
Futures Traders Bet Against HBAR
HBAR’s long/short ratio is currently at 0.93, signaling a preference for short positions among its futures market participants.
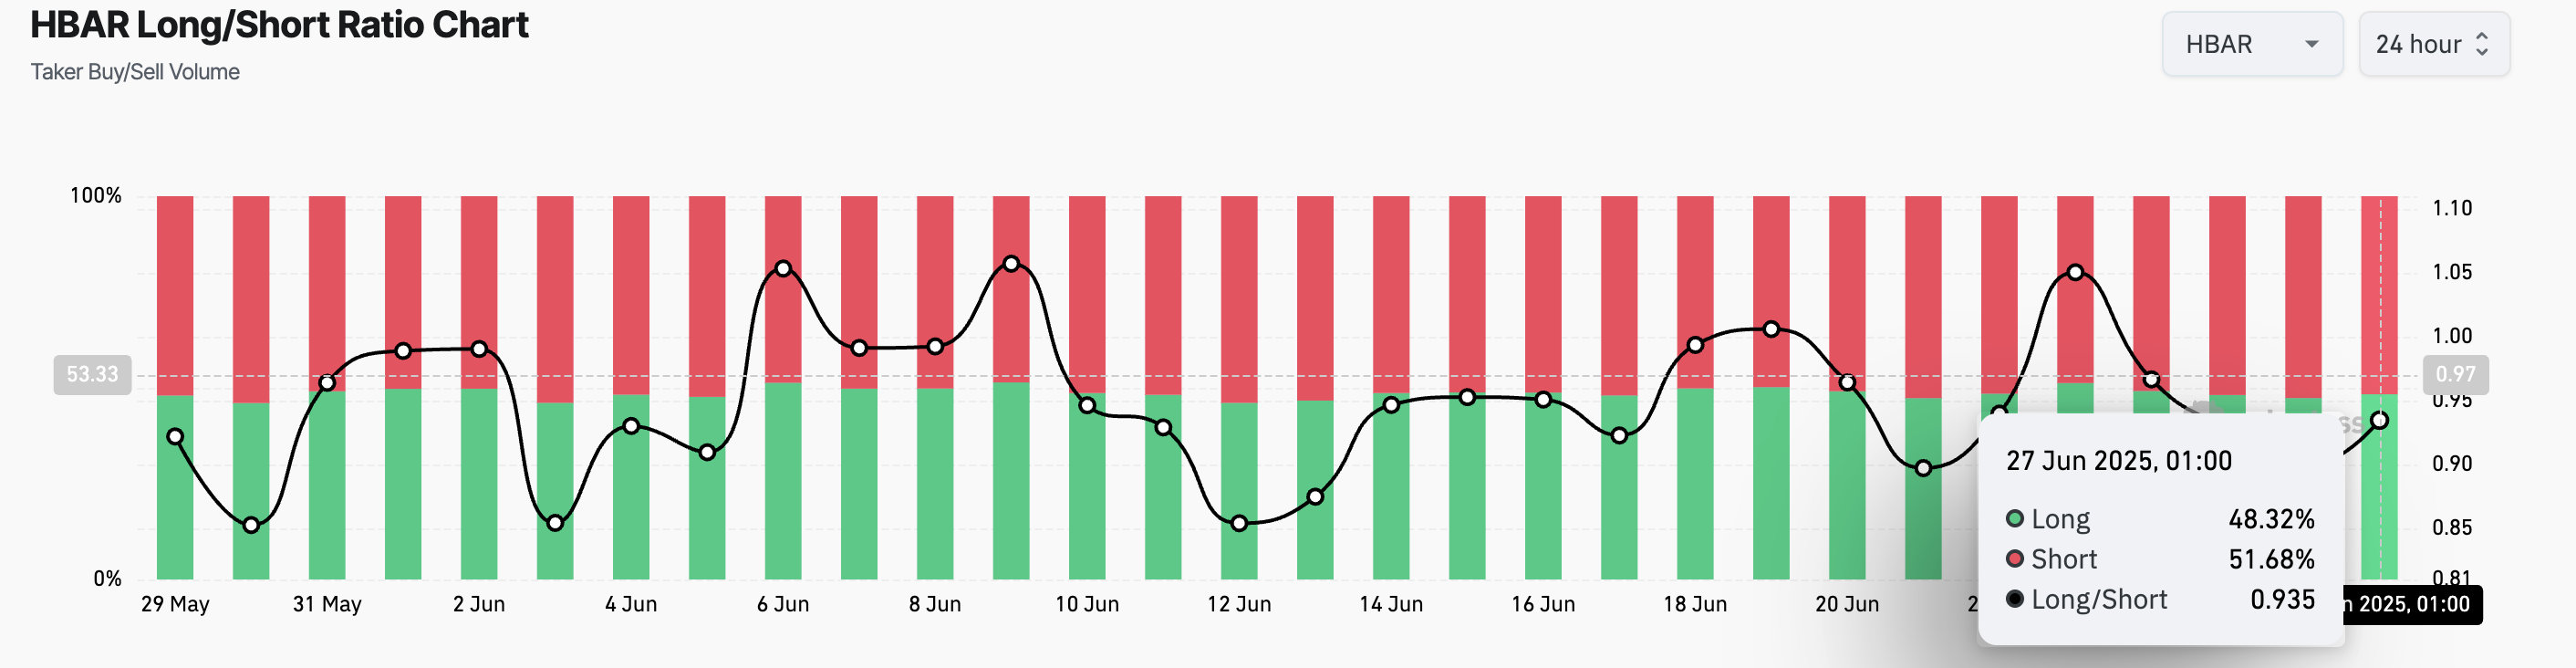
This metric measures the proportion of bullish (long) positions to bearish (short) positions in an asset’s futures market. When the ratio is above one, there are more long positions than short ones. This suggests bullish sentiment, with most traders expecting the asset’s value to rise.
On the other hand, as with HBAR, a ratio below one indicates that more traders are betting on a price decline than on a price increase. It reflects growing skepticism around the token’s short-term price outlook, as traders anticipate further downside movement.
This bearish trend in HBAR’s derivatives positioning could feed into its spot price weakness, especially if not countered by positive market catalysts or a change in broader sentiment.
Moreover, readings from HBAR’s Elder-Ray Index add to this negative outlook. As of this writing, the indicator stands at -0.011.
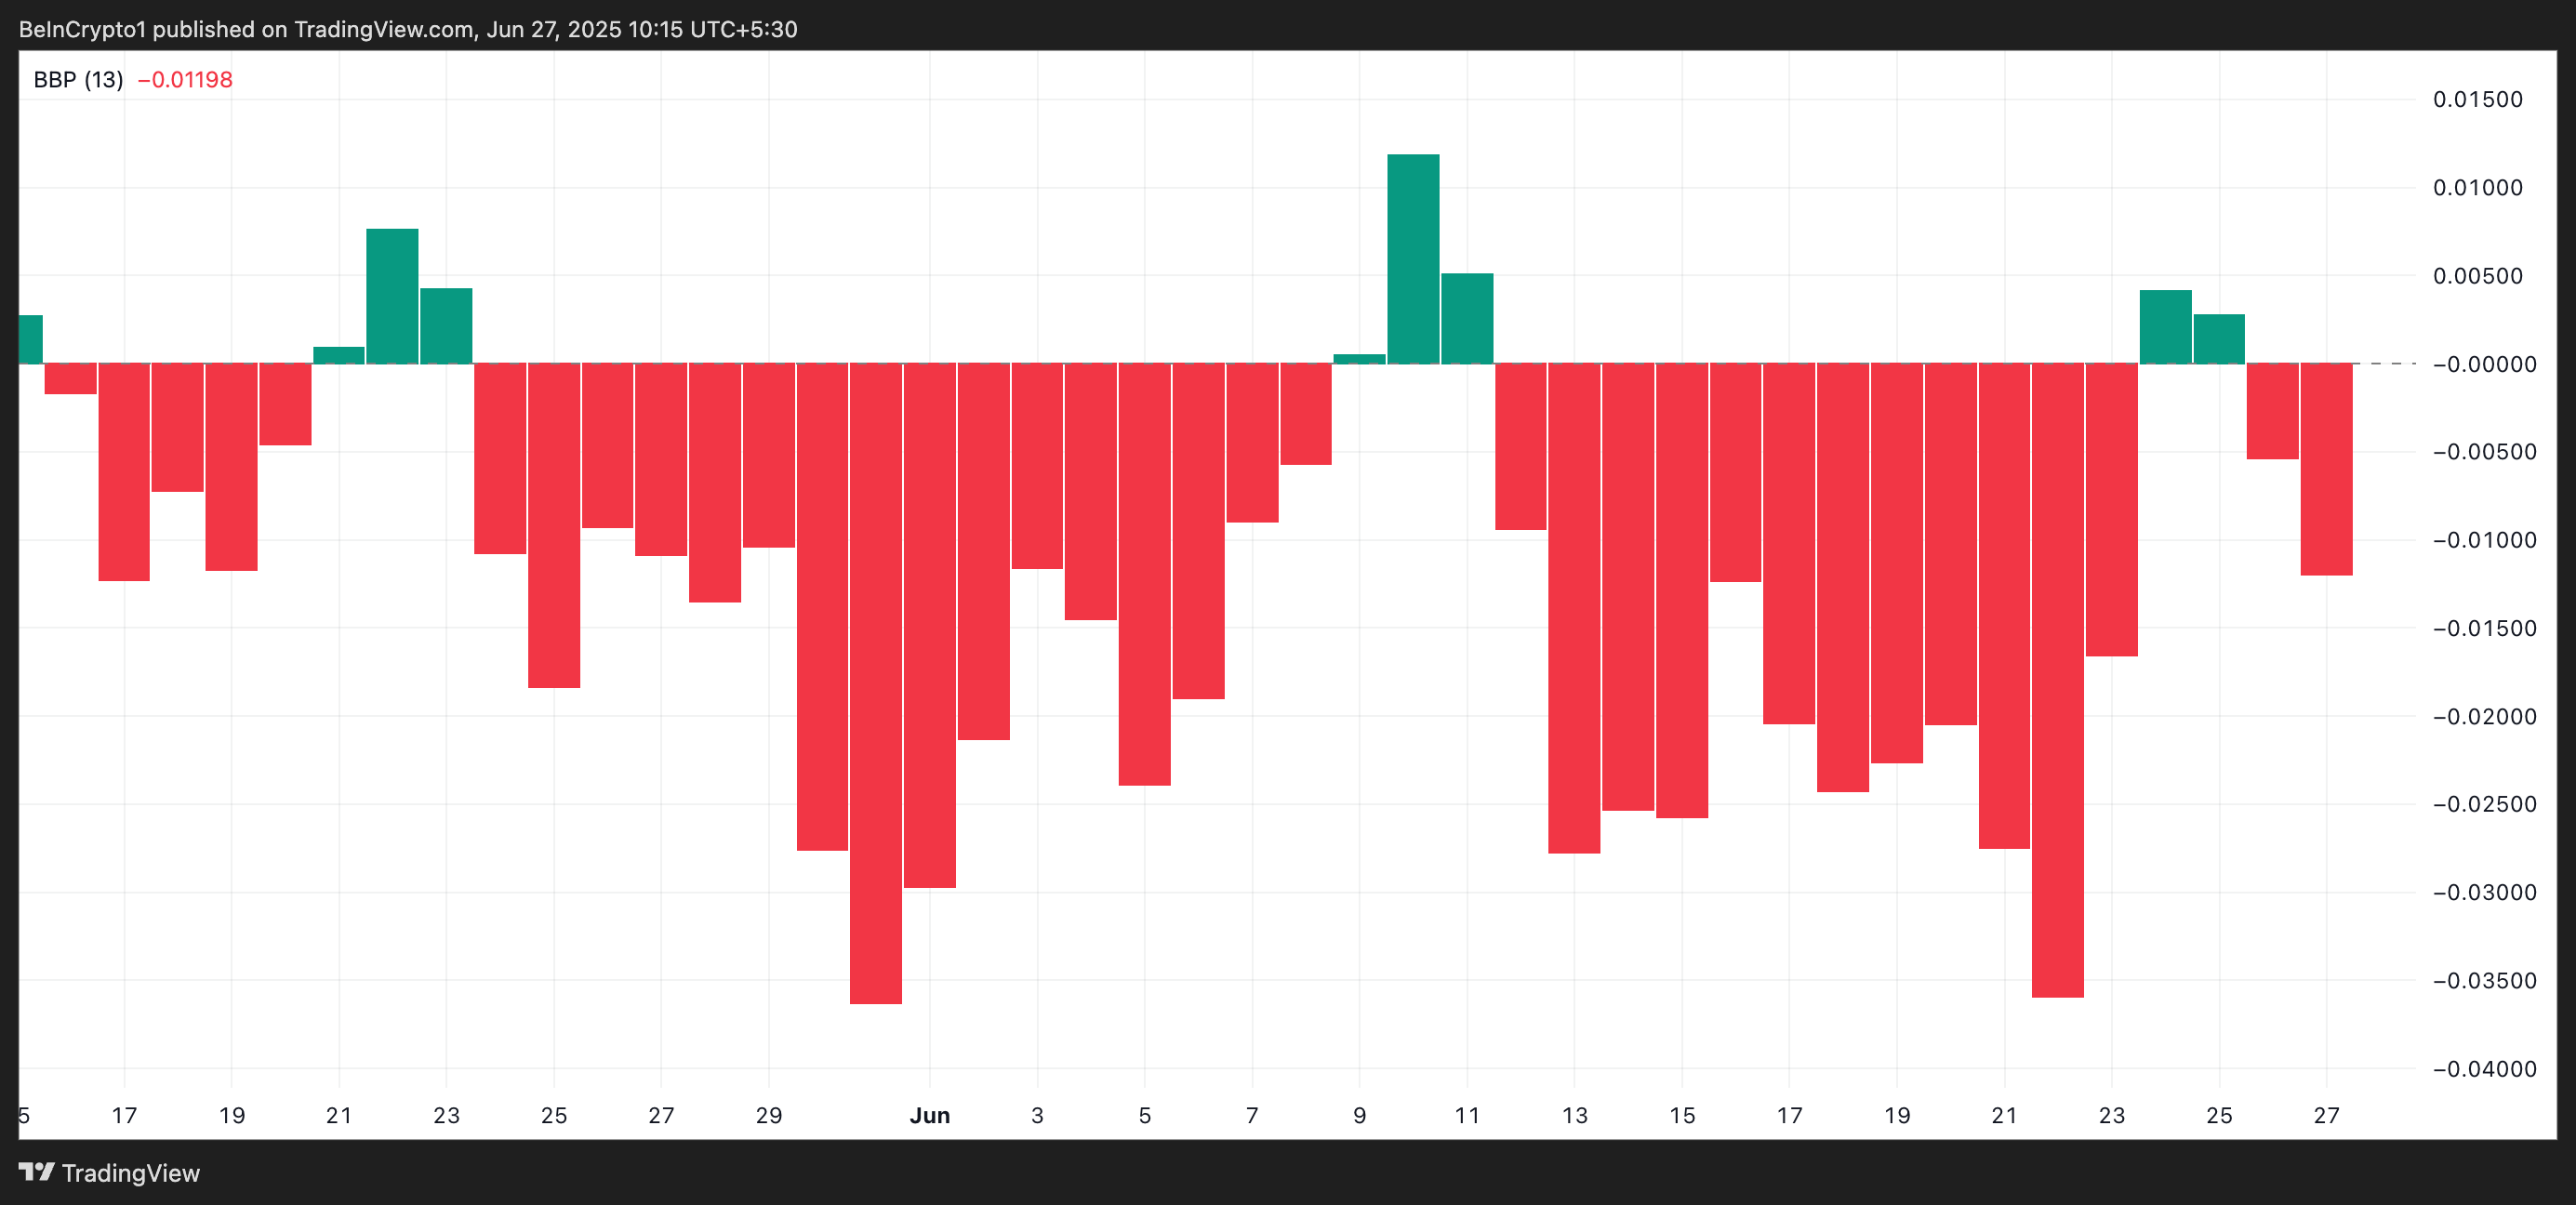
The Elder-Ray Index measures the strength of bulls and bears in the market by analyzing the difference between an asset’s price and its exponential moving average (EMA). A positive Elder-Ray reading occurs when the bulls are dominant, meaning the price is trading above the EMA, indicating strong buying momentum.
This suggests that HBAR sellers are in control and may continue to push prices lower in the short term.
HBAR Faces Critical Test as Price Eyes $0.126 Support
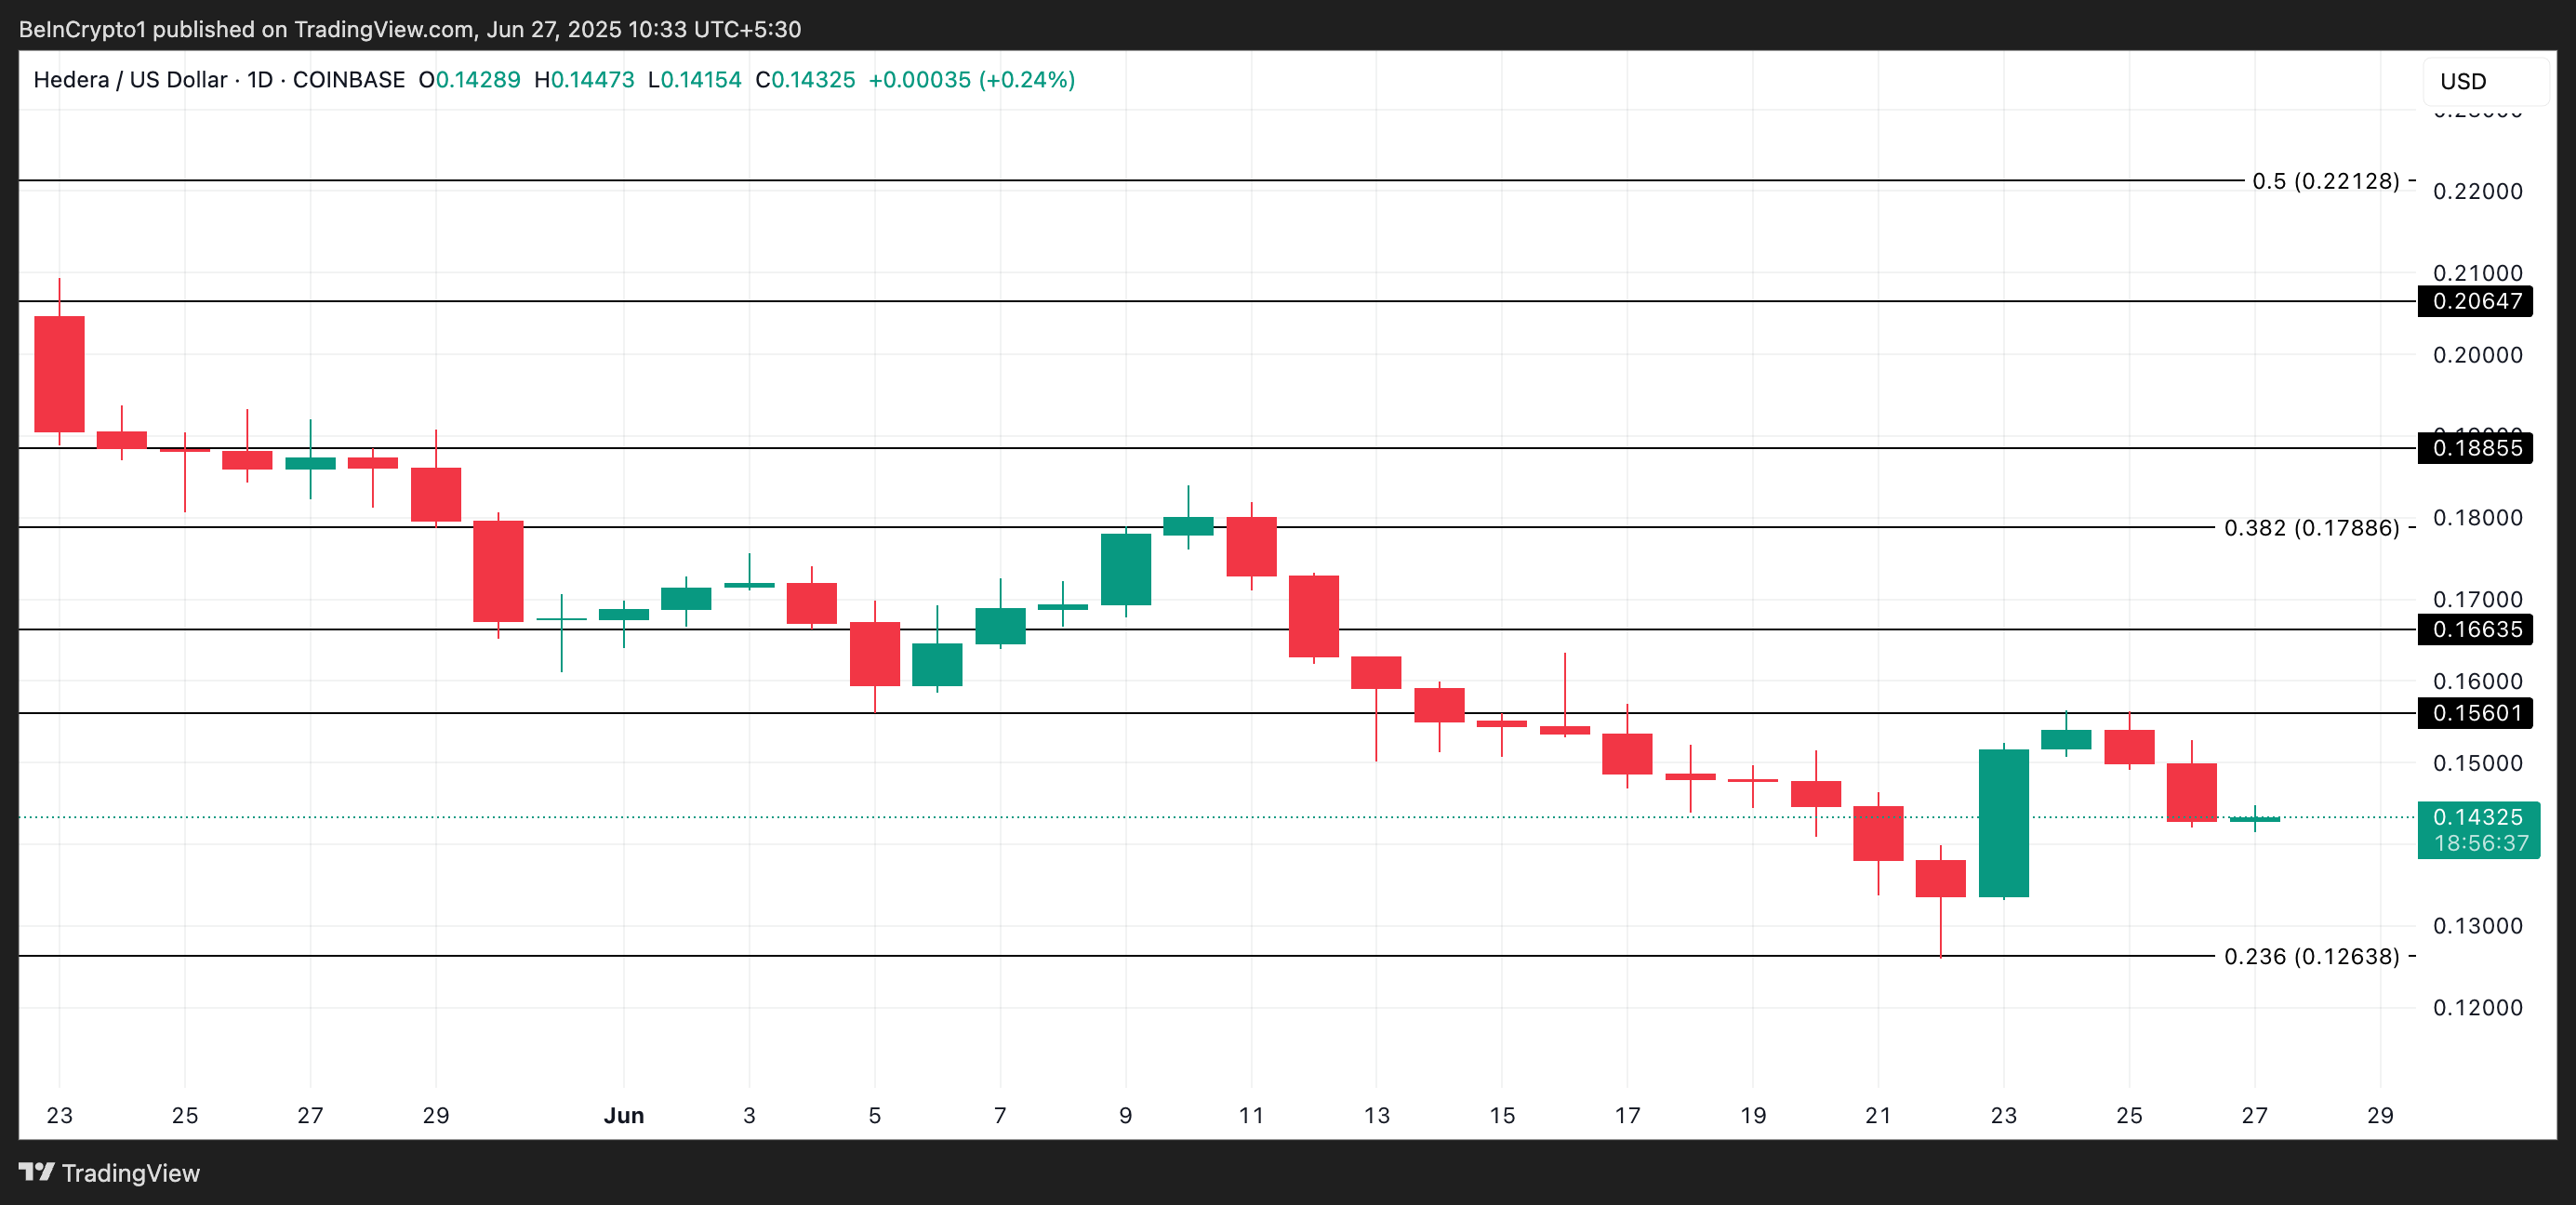
Since peaking at $0.156 on June 25, HBAR has trended downward. Currently exchanging hands at $0.143, the altcoin’s value has continued to slip amid sustained market weakness.
With on-chain and technical readings pointing to mounting bearish pressure as July approaches, HBAR’s price could fall toward $0.126, a low it last visited in April. This level now stands as key support if selling momentum accelerates.
On the other hand, a resurgence in new demand could invalidate this bearish projection. Should buyers step in with enough strength, HBAR’s price could attempt to break above resistance at $0.156. If successful, the token may rally further toward the $0.166 level, marking a bullish trend reversal.
For now, whether the HBAR token price breaks down or rebounds hinges largely on whether market sentiment shifts in its favor in the coming days.
