
Hedera Hashgraph’s native token HBAR has slipped since climbing to a 20-day high of $0.2548 on Sunday, as traders begin to scale back positions.
Trading at $0.2357 at press time, the token has shed roughly 5% from its recent peak. Both on-chain and technical indicators point to waning inflows and intensifying bearish sentiment, raising the likelihood of an extended HBAR price decline.
HBAR’s Rally Stalls as Traders Exit and Short Positions Surge
Since its price decline began on Sunday, HBAR’s Money Flow Index (MFI) has also trended downward slowly, highlighting the slowdown in token accumulation across the market.
For token TA and market updates: Want more token insights like this? Sign up for Editor Harsh Notariya’s Daily Crypto Newsletter here.
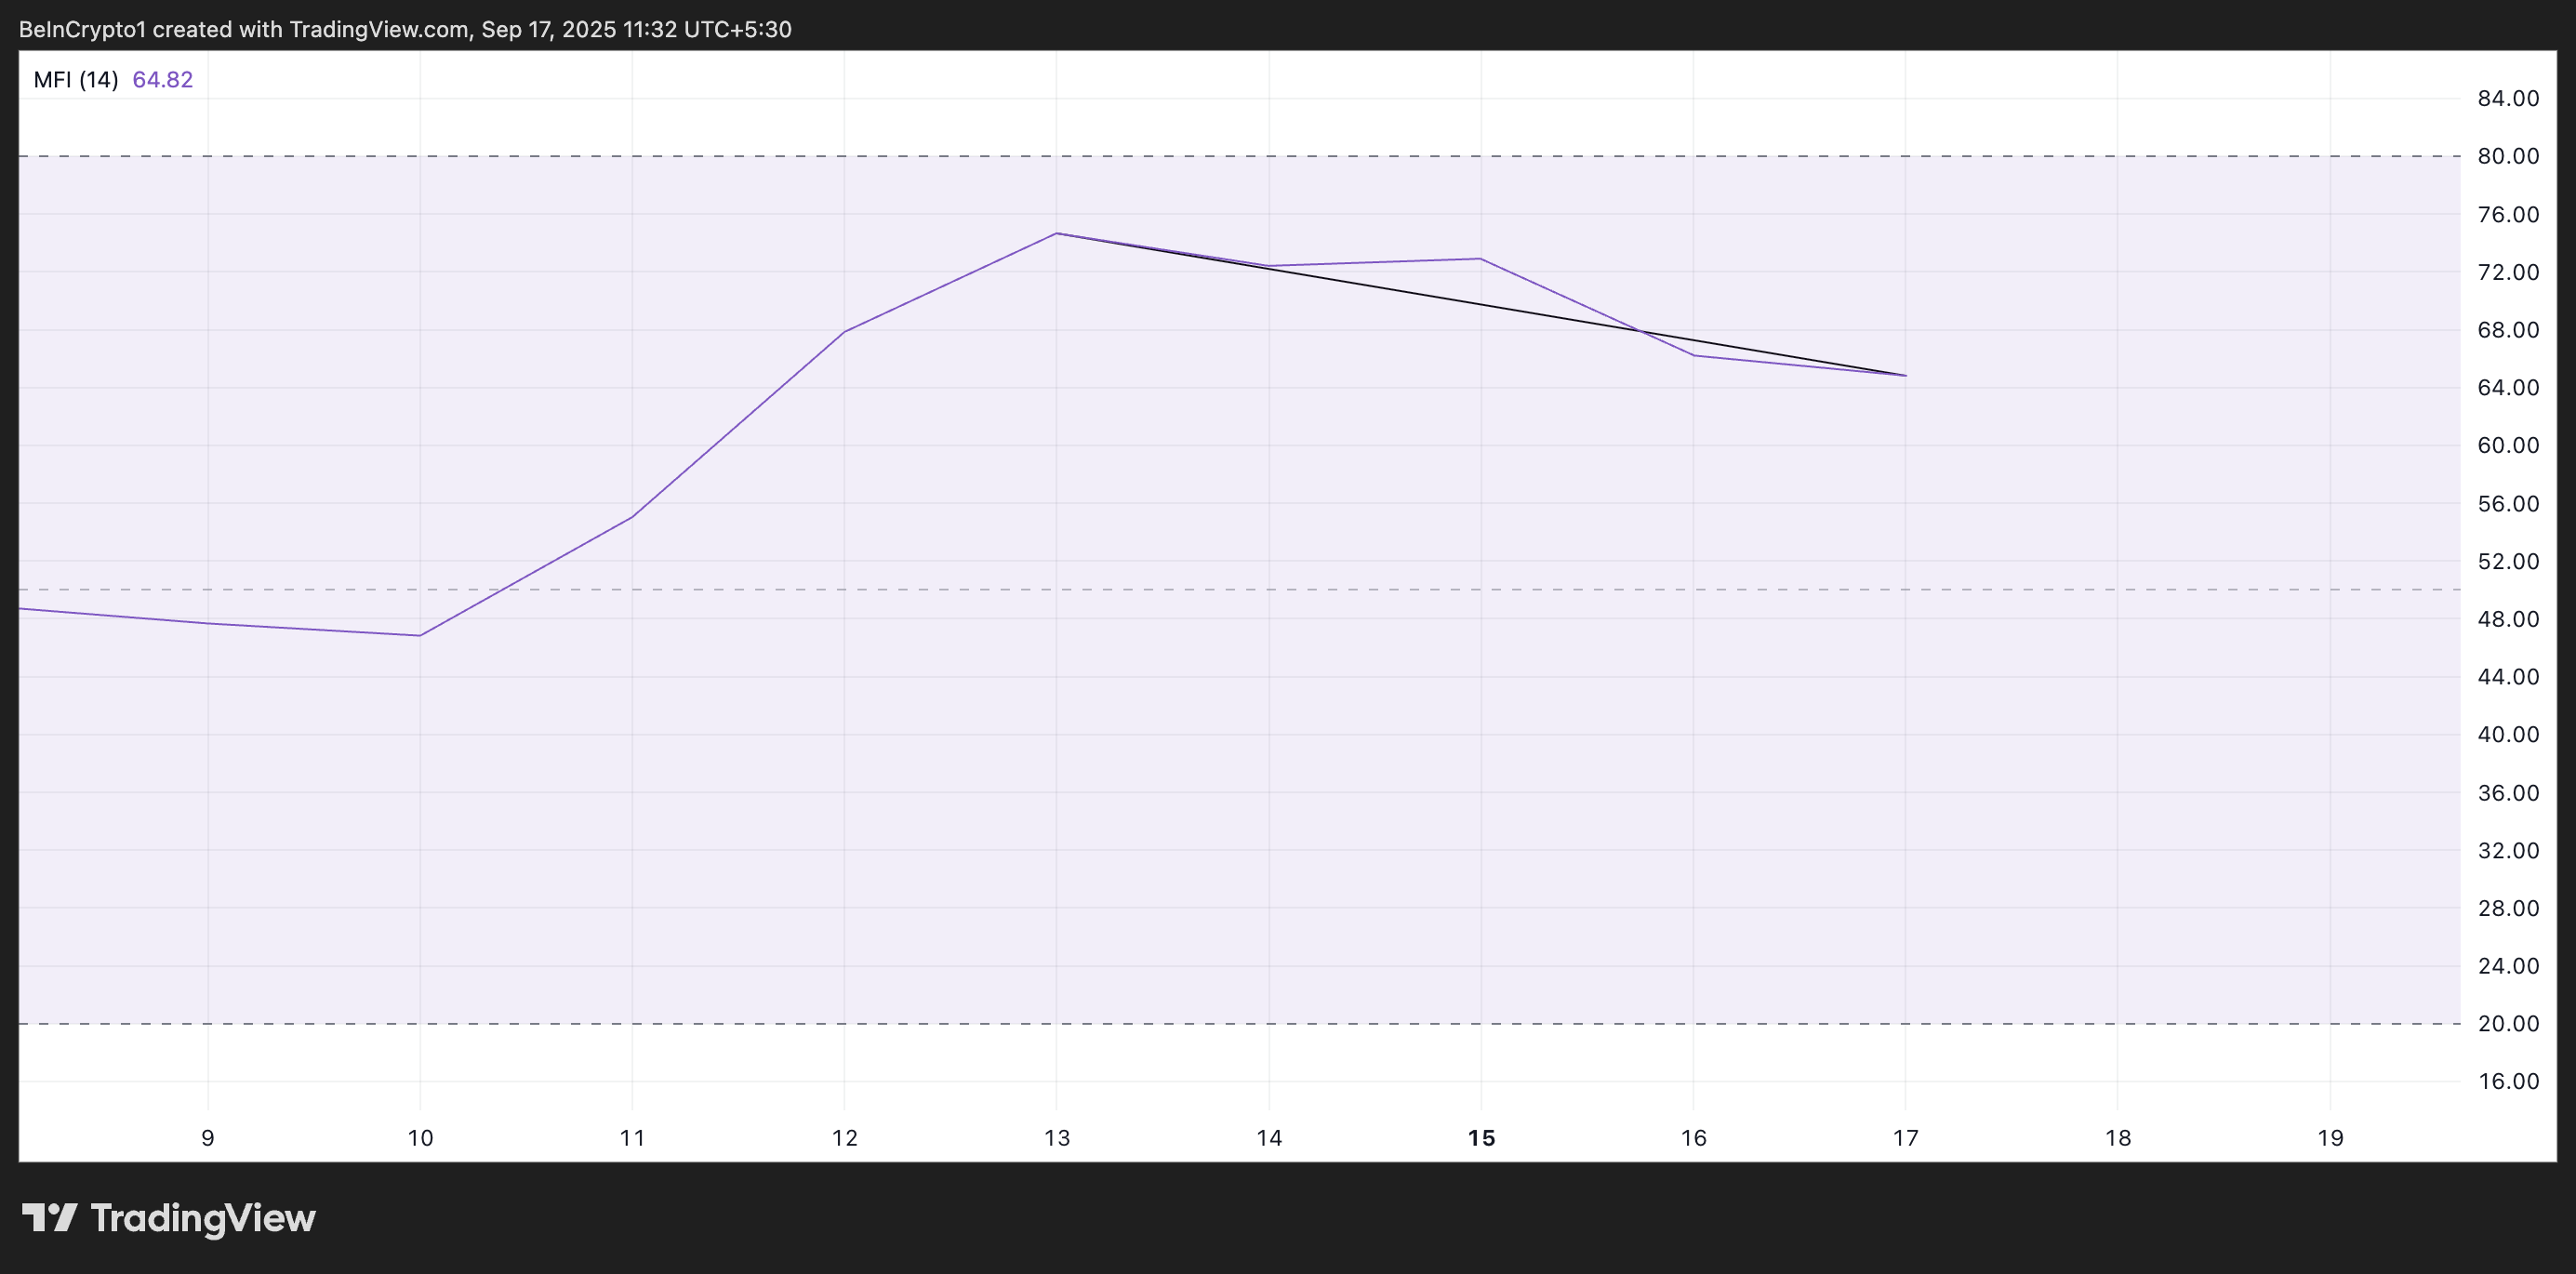
The MFI indicator gauges the strength of capital inflows into an asset by tracking its price and trading volume. It climbs when traders are actively accumulating, signaling increased liquidity and stronger buy-side demand.
In contrast, a falling MFI reflects weakening inflows as investors scale back their exposure. Therefore, HBAR’s falling MFI shows that accumulation has slowed significantly since its 20-day peak, exposing the altcoin to additional downside pressure.
Moreover, data from Coinglass shows a bearish tilt in derivatives positioning, supporting the negative outlook above.
According to the on-chain data provider, HBAR’s long/short ratio continues to fall, signaling that traders are increasingly betting against the token. As of this writing, this is at 0.86.
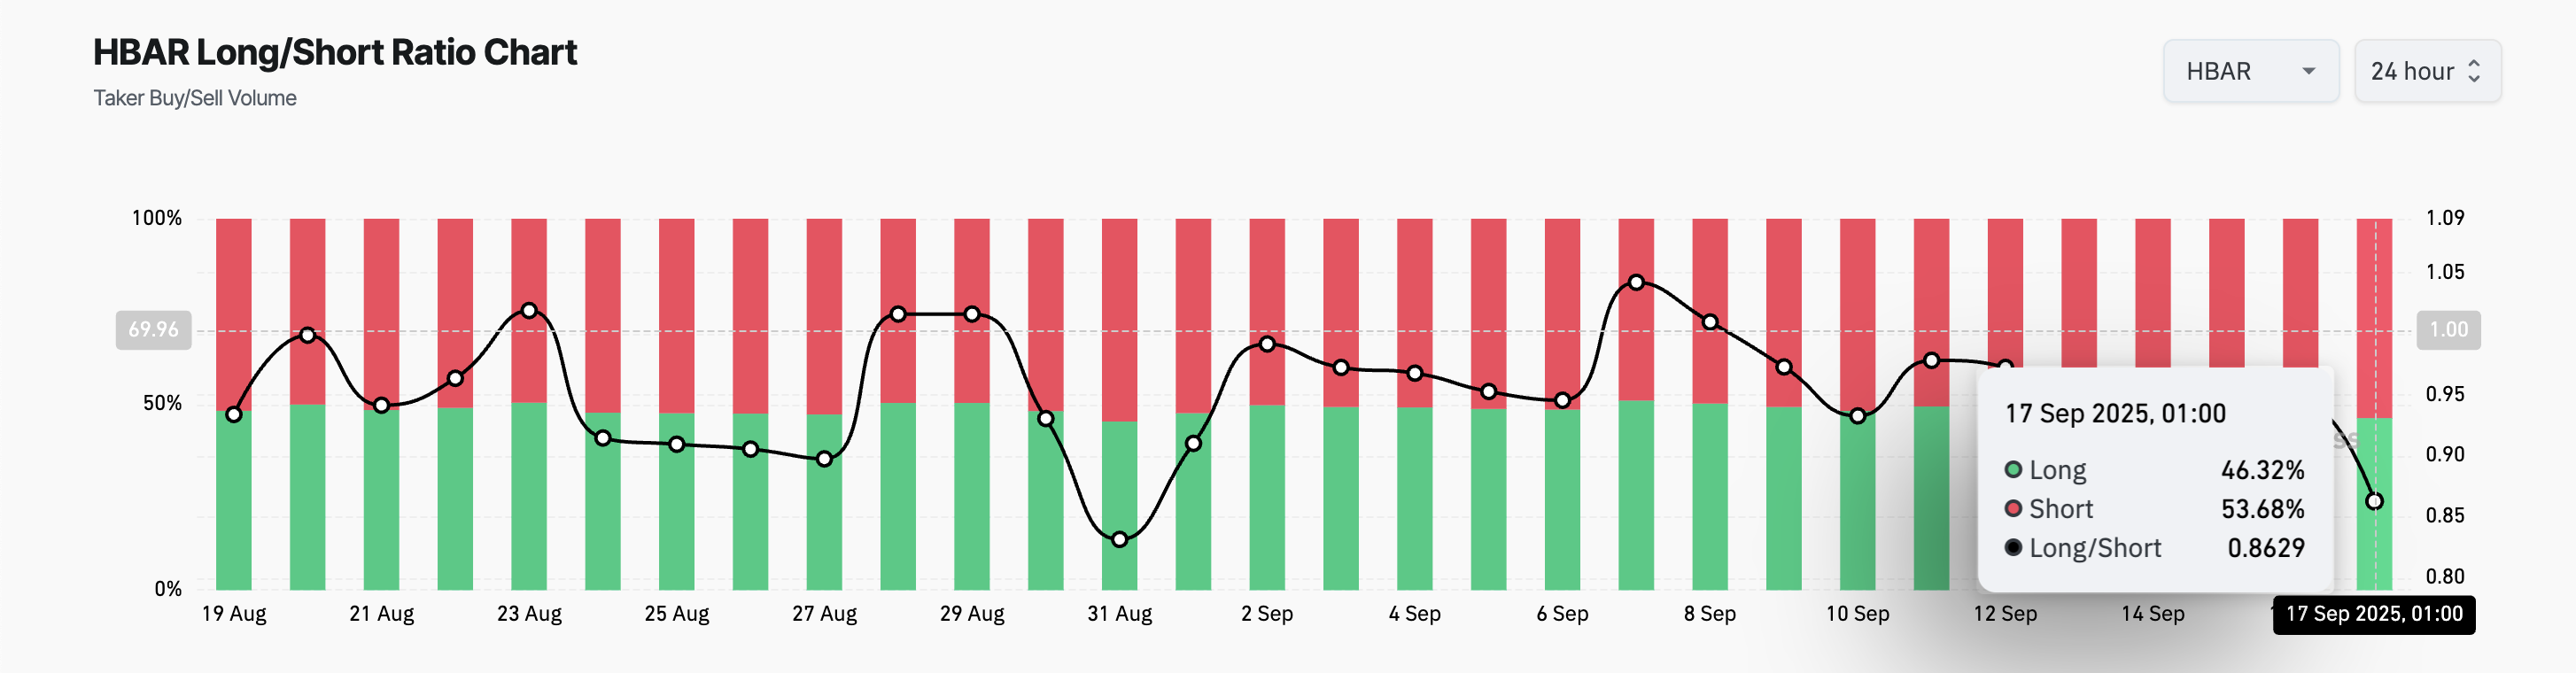
The long/short ratio measures the balance between bullish and bearish positions. A reading above one means more traders expect prices to rise, while a ratio below 1, as with HBAR, shows most are betting on further declines.
This points to stronger bearish sentiment and expectations of continued downside.
HBAR Bears Tighten Grip, But $0.2762 Rebound Still in Play
With capital inflows drying up and short demand climbing, HBAR appears vulnerable to further losses in the near term. Unless new buying support emerges to offset the bearish trend, the token’s price could fall to $0.2123 over the next few trading sessions.
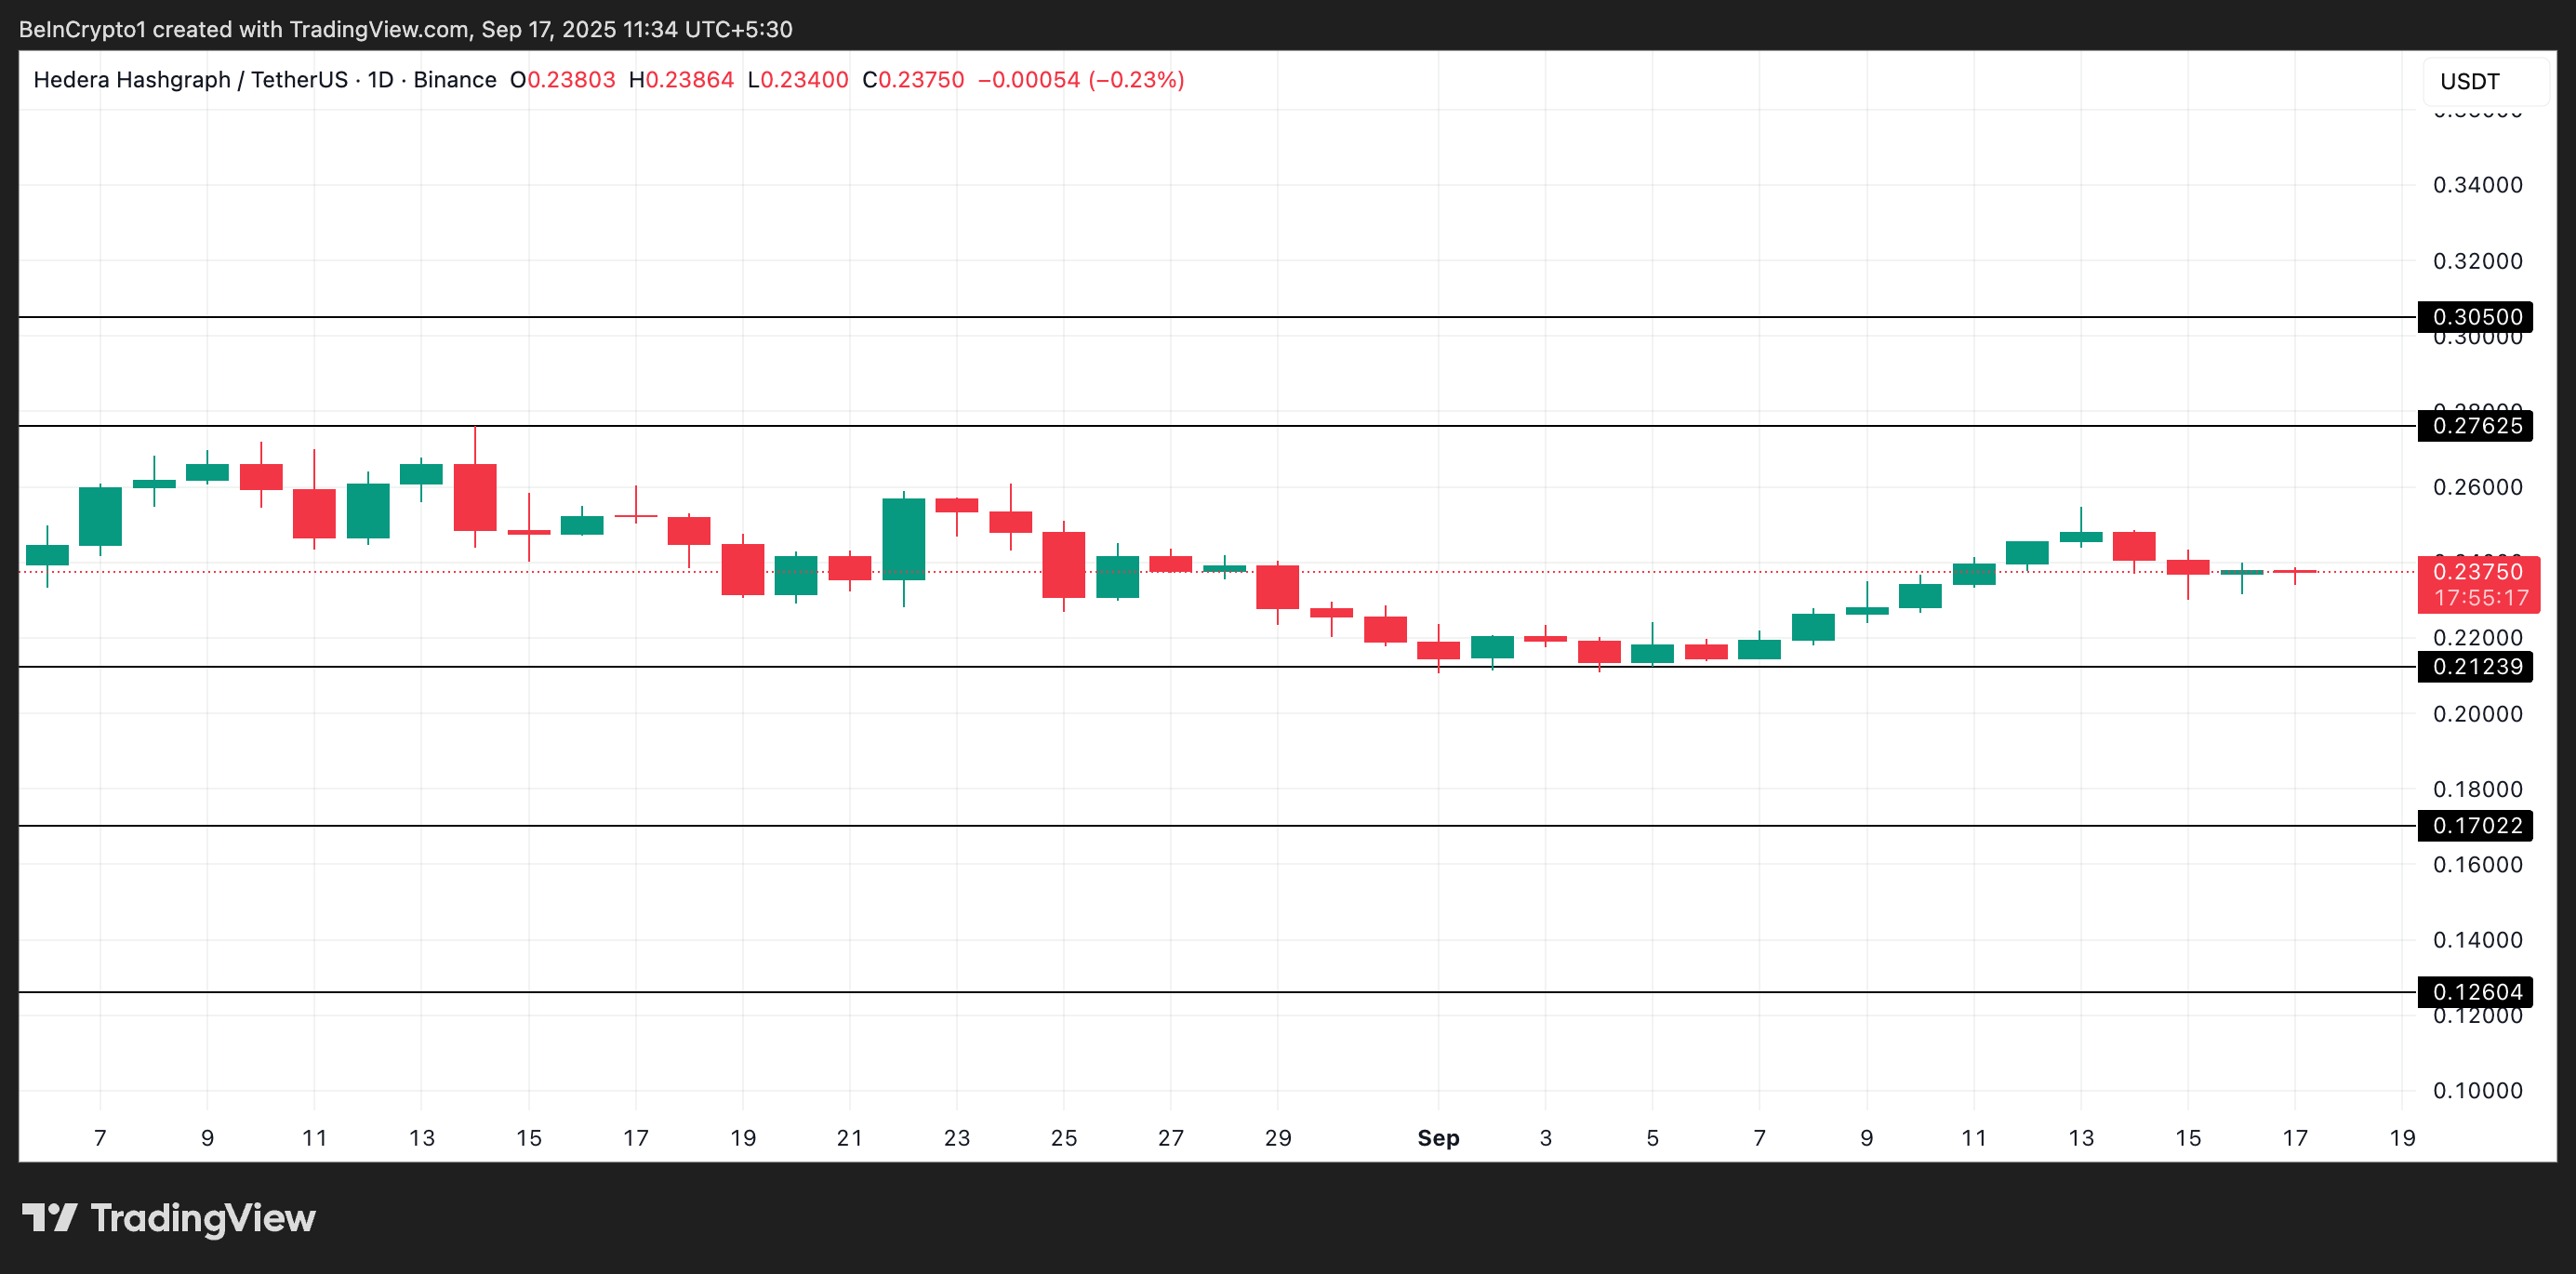
However, if the bulls regain control and accumulation resumes, HBAR could reverse its decline and rally toward $0.2762.
