
HBAR has recently experienced a significant drawdown, which has left investors perplexed and facing losses. After a prolonged downtrend, HBAR has shown signs of recovery, rising by 12% over the last 24 hours.
As the altcoin begins to rebound, investors are optimistic that the recent surge may signal the end of the two-month downtrend.
HBAR Has A Shot
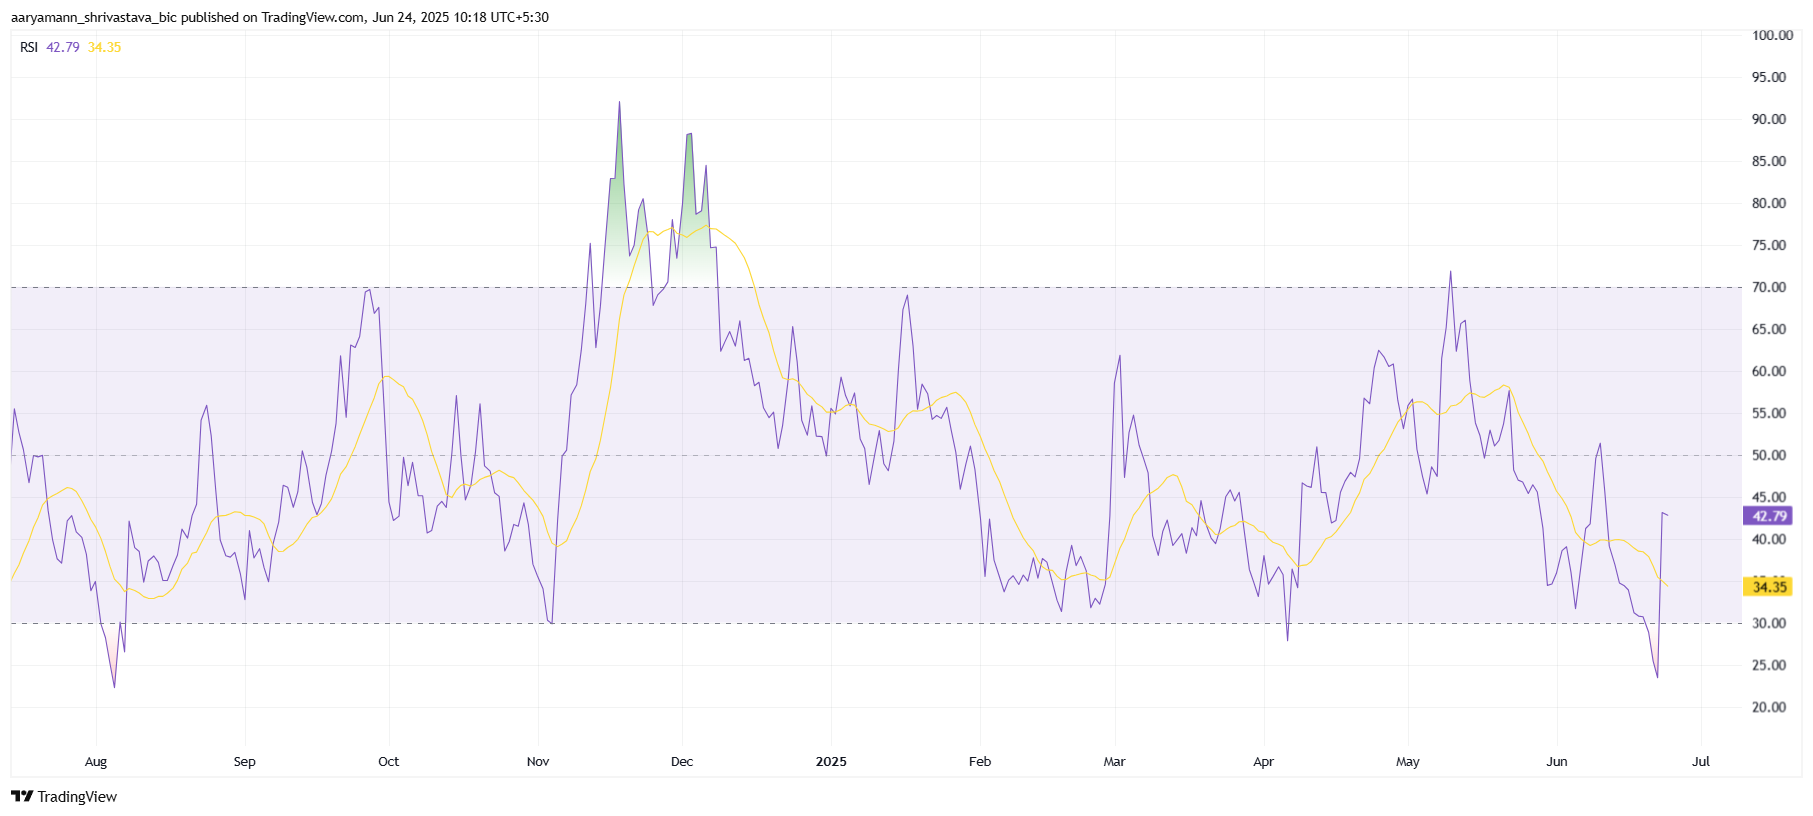
The Relative Strength Index (RSI) for HBAR fell into the oversold zone, dropping below the critical 30.0 threshold. This marked the lowest point for HBAR’s RSI in over 10 months. Typically, when the RSI enters the oversold zone, it signals a potential reversal. As the RSI has now bounced back, this could indicate that the downtrend is nearing its end and a recovery is underway.
The recovery of the RSI suggests that investor sentiment is shifting. As the RSI rises from the oversold territory, it indicates that buying pressure may start to outweigh selling.
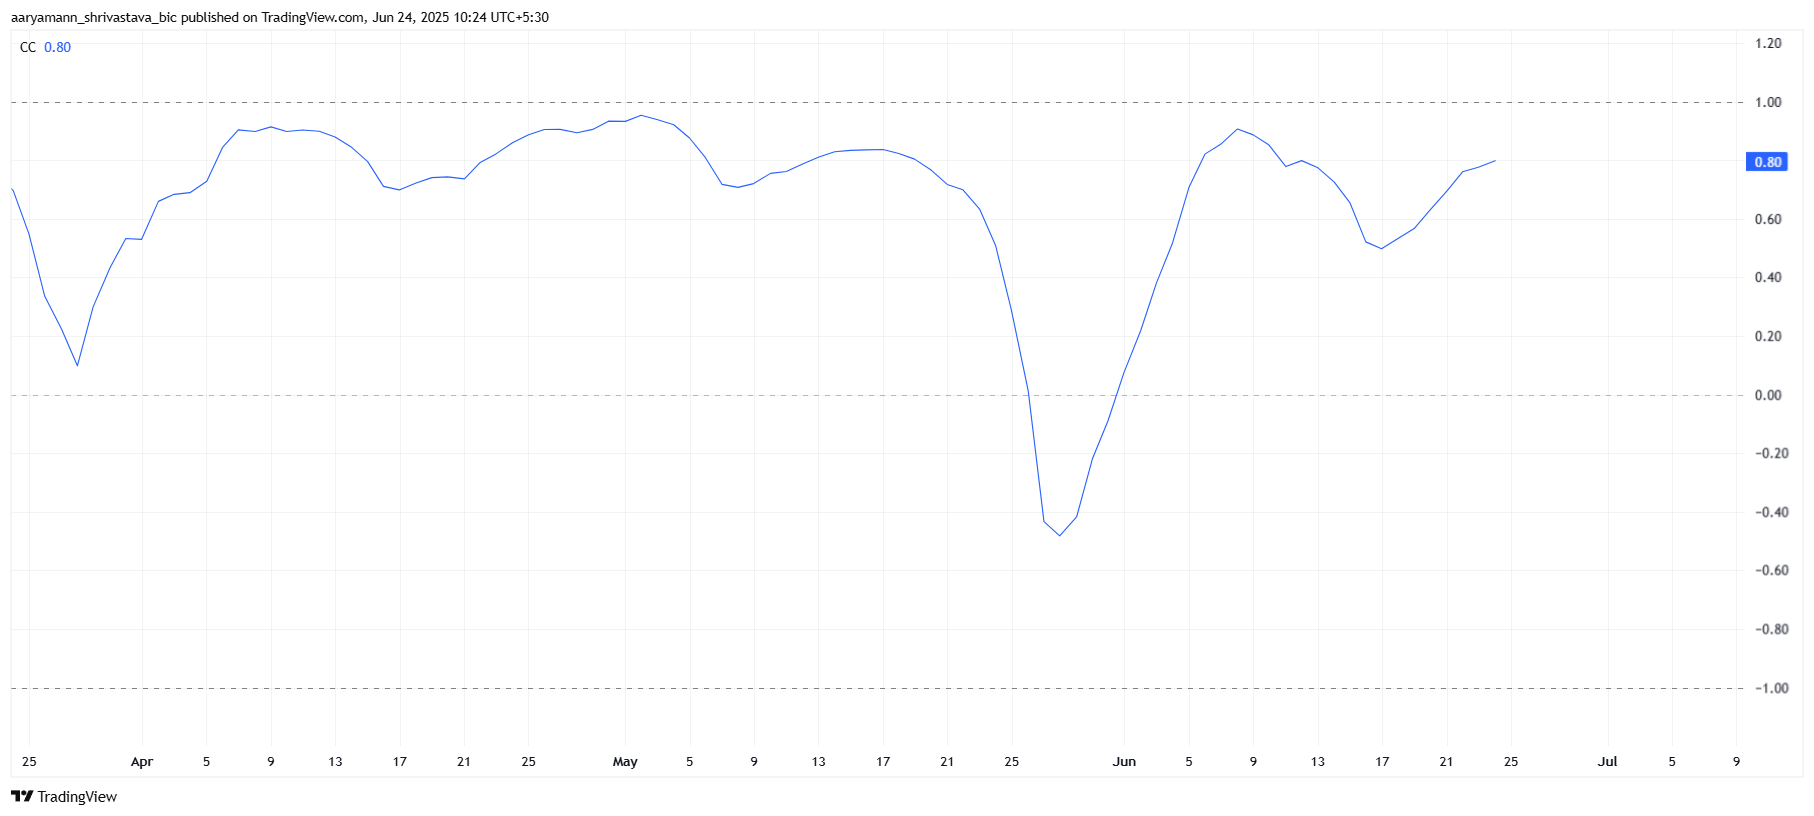
HBAR’s price movement is closely correlated with Bitcoin, with a strong correlation coefficient of 0.80. This high correlation suggests that HBAR could mimic Bitcoin’s price movements, benefiting from Bitcoin’s potential growth. If Bitcoin continues its upward trajectory, HBAR may also capitalize on the broader crypto market’s positive momentum, leading to gains for the altcoin.
However, this correlation also presents risks. If Bitcoin experiences a downturn, HBAR may follow suit, amplifying any negative price action. The strong correlation means that while HBAR has the potential to ride Bitcoin’s wave higher, it is equally vulnerable to Bitcoin’s volatility.
HBAR Price Can Do Well
HBAR has seen a 12% rise in the last 24 hours, trading at $0.150. It is currently facing resistance levels at $0.154 and $0.163. While the price has shown positive momentum, reaching the $0.163 level could prove difficult given the recent downtrend. However, if the bullish sentiment continues, HBAR might be able to break through these resistance levels and end its two-month-long decline.
The sustained bullish momentum could lead to a price move beyond $0.163, potentially invalidating the downtrend. If HBAR manages to break through the resistance, it could push towards higher price targets, offering relief to investors who have been holding through the downturn. The key levels to watch are the $0.154 and $0.163 resistance levels, as breaking through these could signal a full recovery.
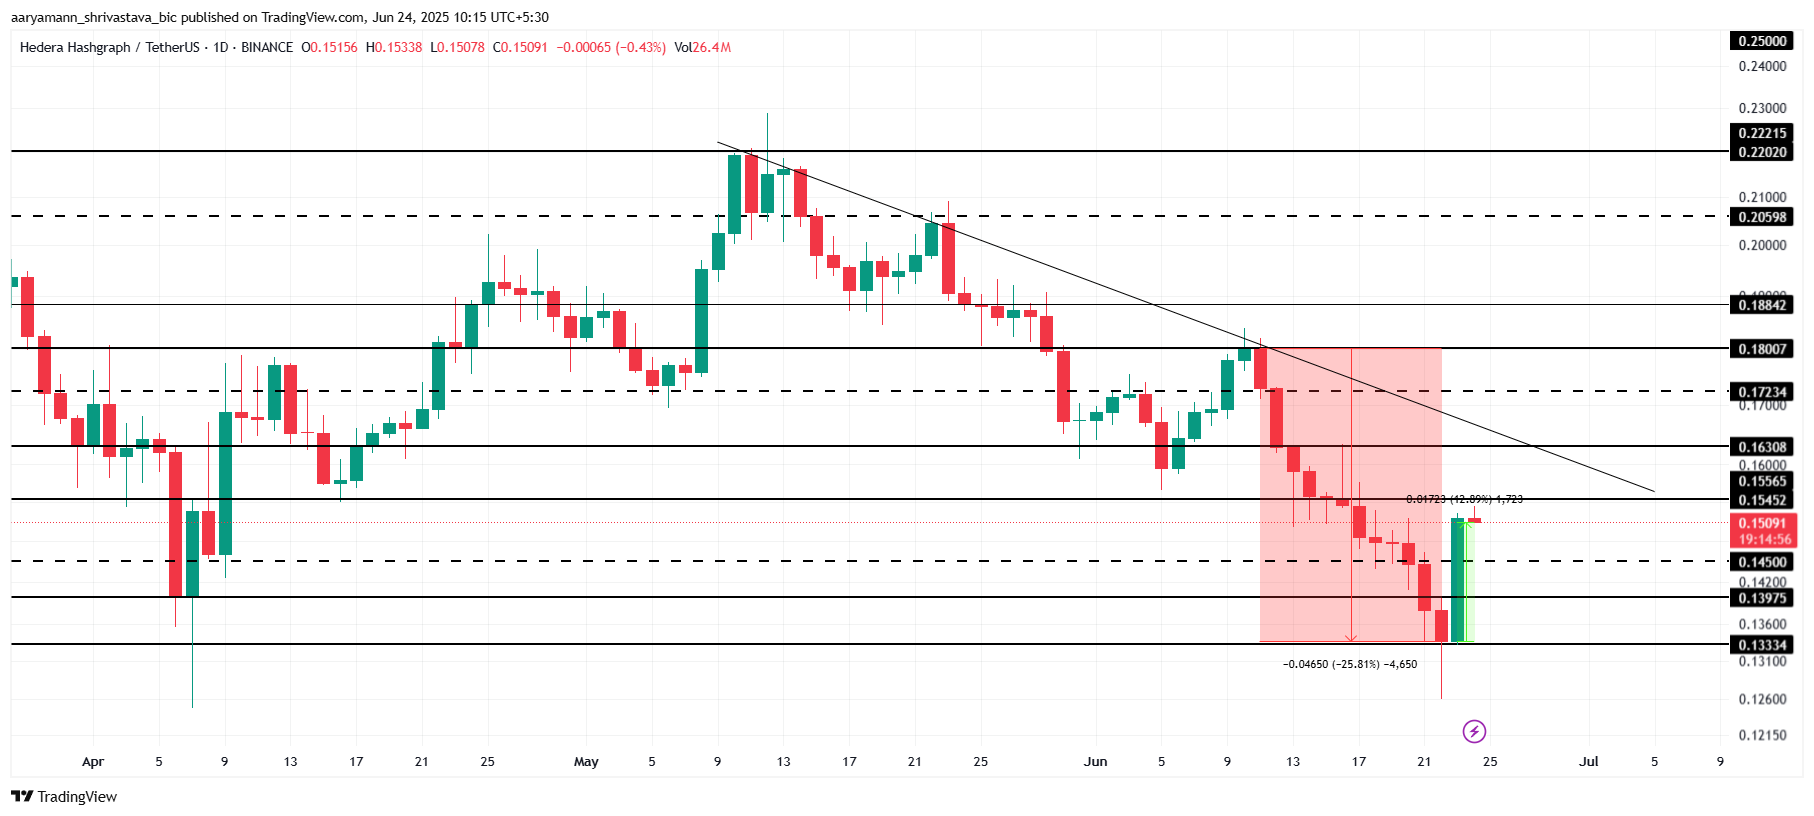
However, if the bullish momentum fails to hold, there is a risk that HBAR could retreat. If the price falls back below key support levels, it may dip to around $0.139 or even $0.133. Such a decline would indicate that the recovery is short-lived, and the bearish sentiment could resume.
