


Since the beginning of February, Hedera Hashgraph’s native token HBAR has been trading in a tight range, mirroring the broader market consolidation over the past few weeks.
As price movement remains range-bound, its spot and futures traders have scaled back their exposure, putting the altcoin at risk of breaking out in a downward trend.
HBAR Trades Within a Range
The broader market consolidation of the past two weeks has put HBAR in a bind. Its price has remained within a narrow range, facing resistance at $0.24 while finding support at $0.22.
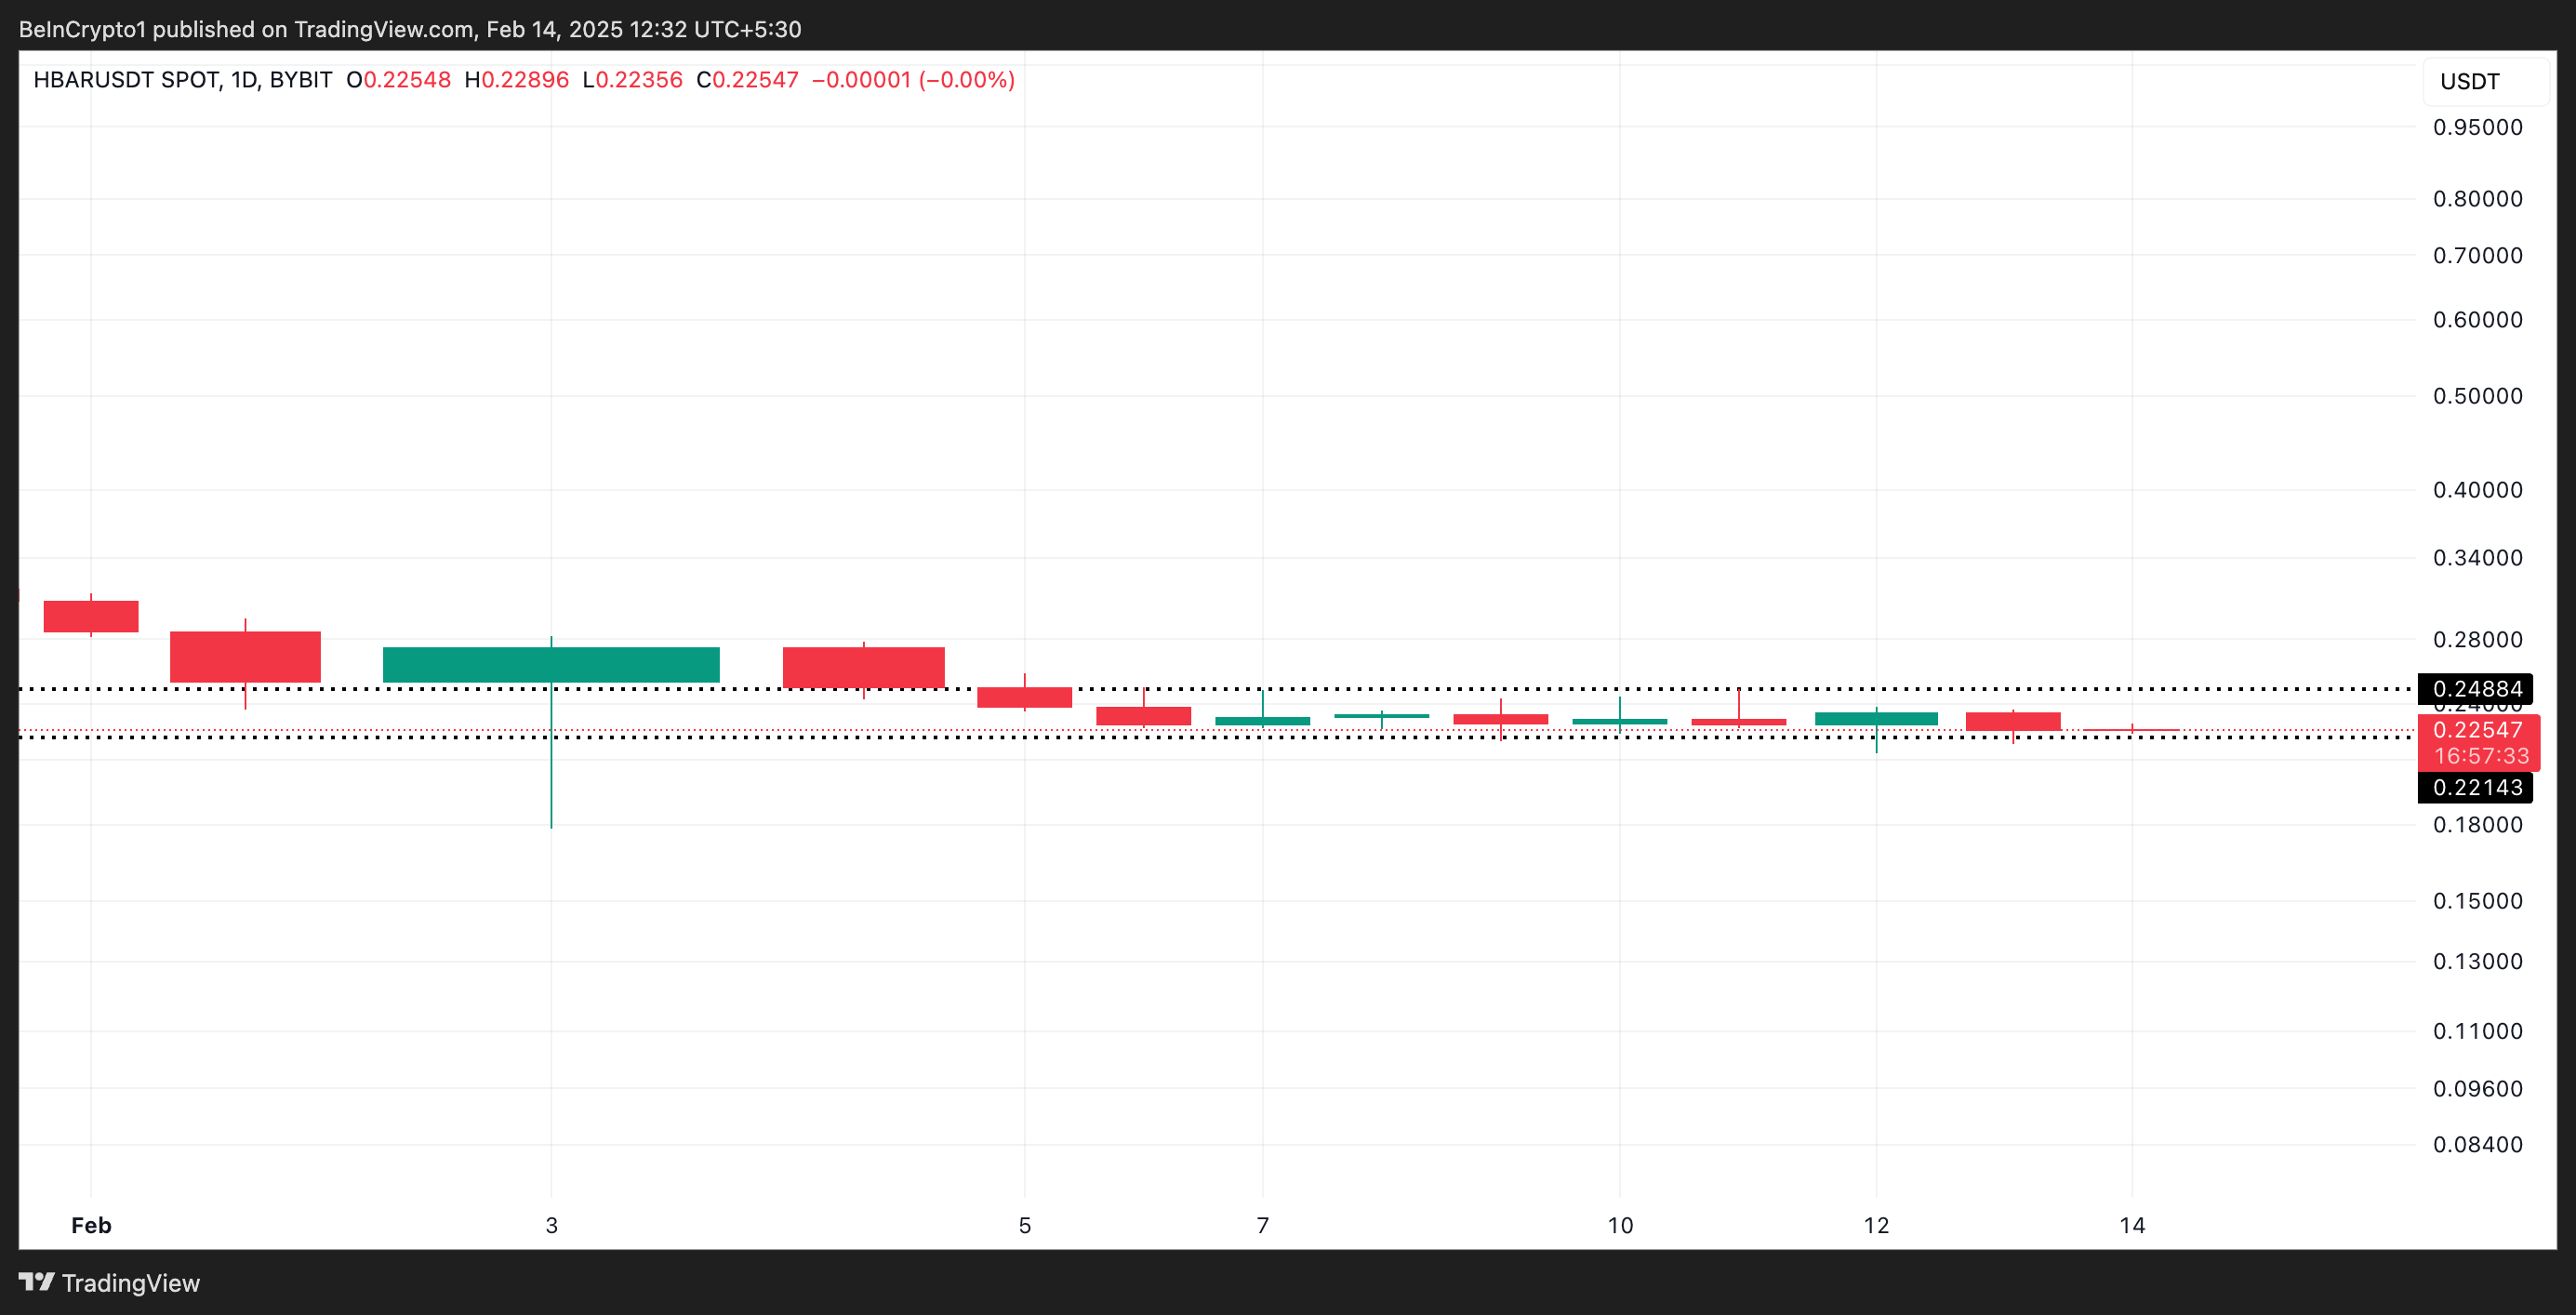
When an asset’s price moves sideways in this manner, it trends up and down within a limited range without a clear breakout in either direction. This indicates market indecision, with neither buyers nor sellers gaining enough momentum to push the price significantly higher or lower.
However, the bearish pressure is strengthening, hinting at a potential break below the support at $0.22. This is reflected by HBAR’s declining open interest, which has plunged by more than 50% since the beginning of February. At press time, this is $182.96 million.
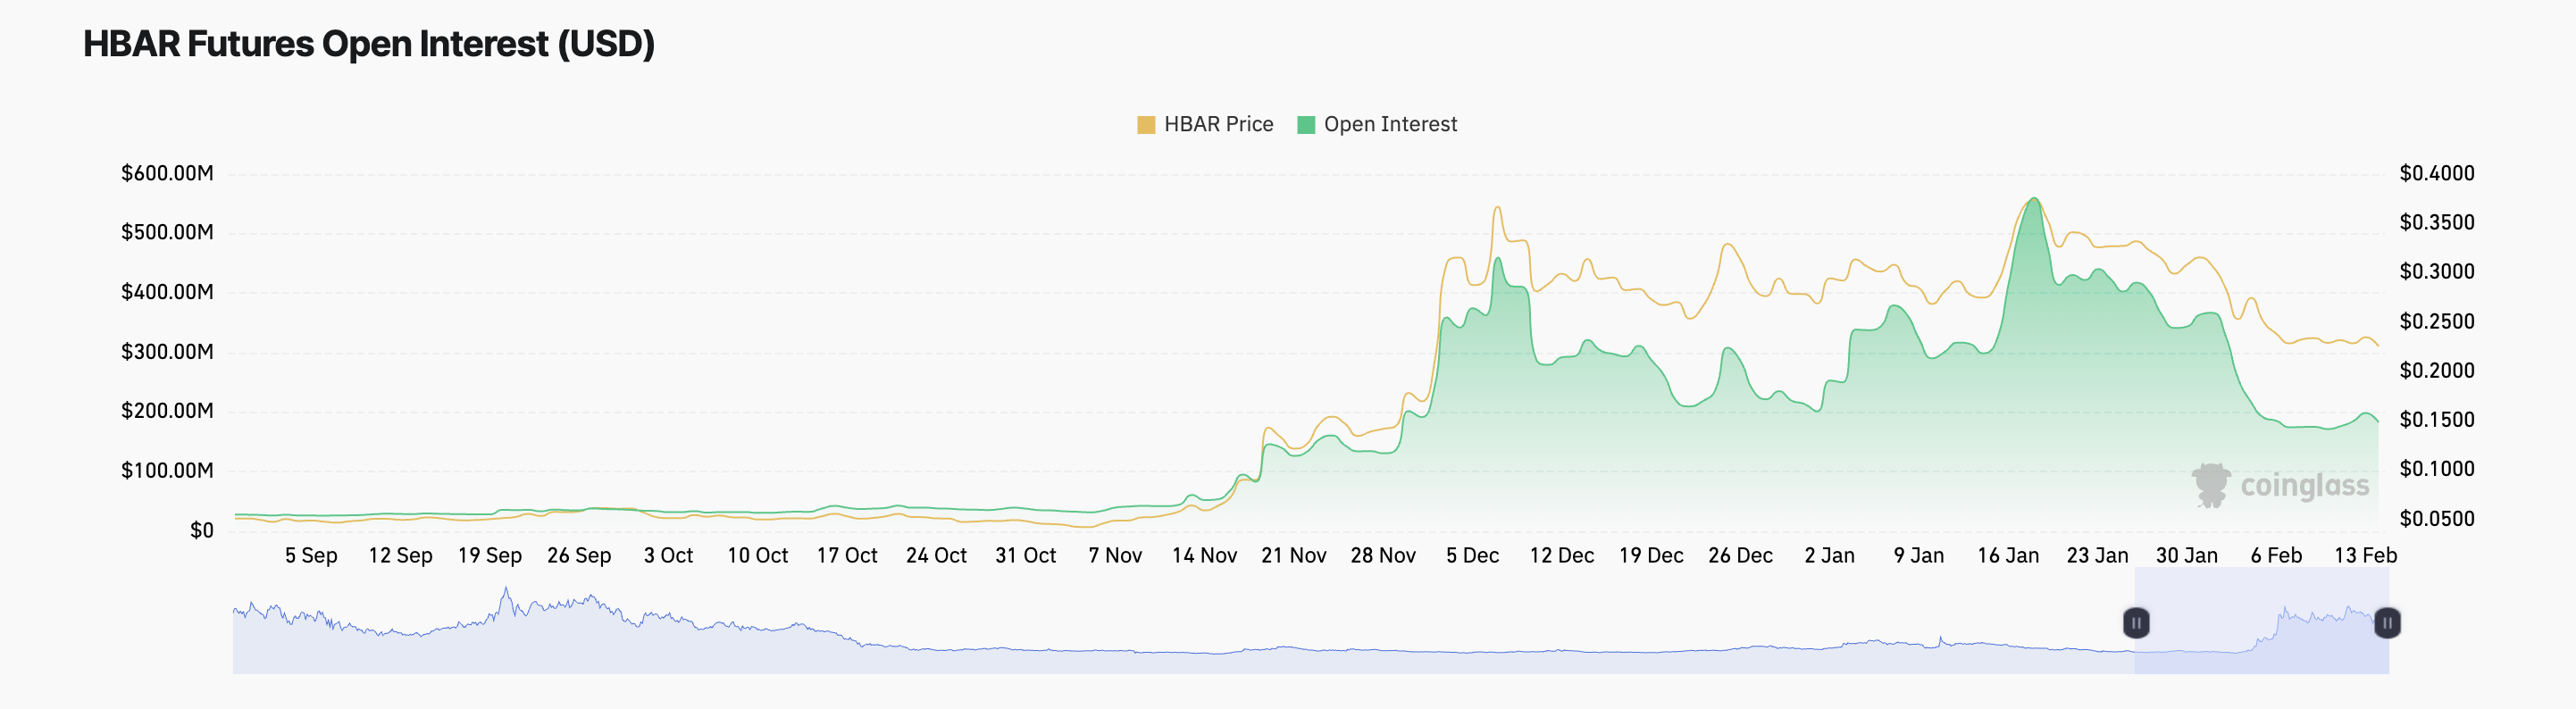
An asset’s open interest refers to the total number of outstanding futures or options contracts that have not been settled. When this decline occurs, traders close their positions without opening new ones, signaling reduced market participation or waning interest in that asset.
Moreover, the persistent outflows from HBAR’s spot markets confirm this bearish outlook. According to Coinglass, since the beginning of February, HBAR has noted spot outflows totaling $43 million. Conversely, its inflows during this period amount to only $18.15 million.
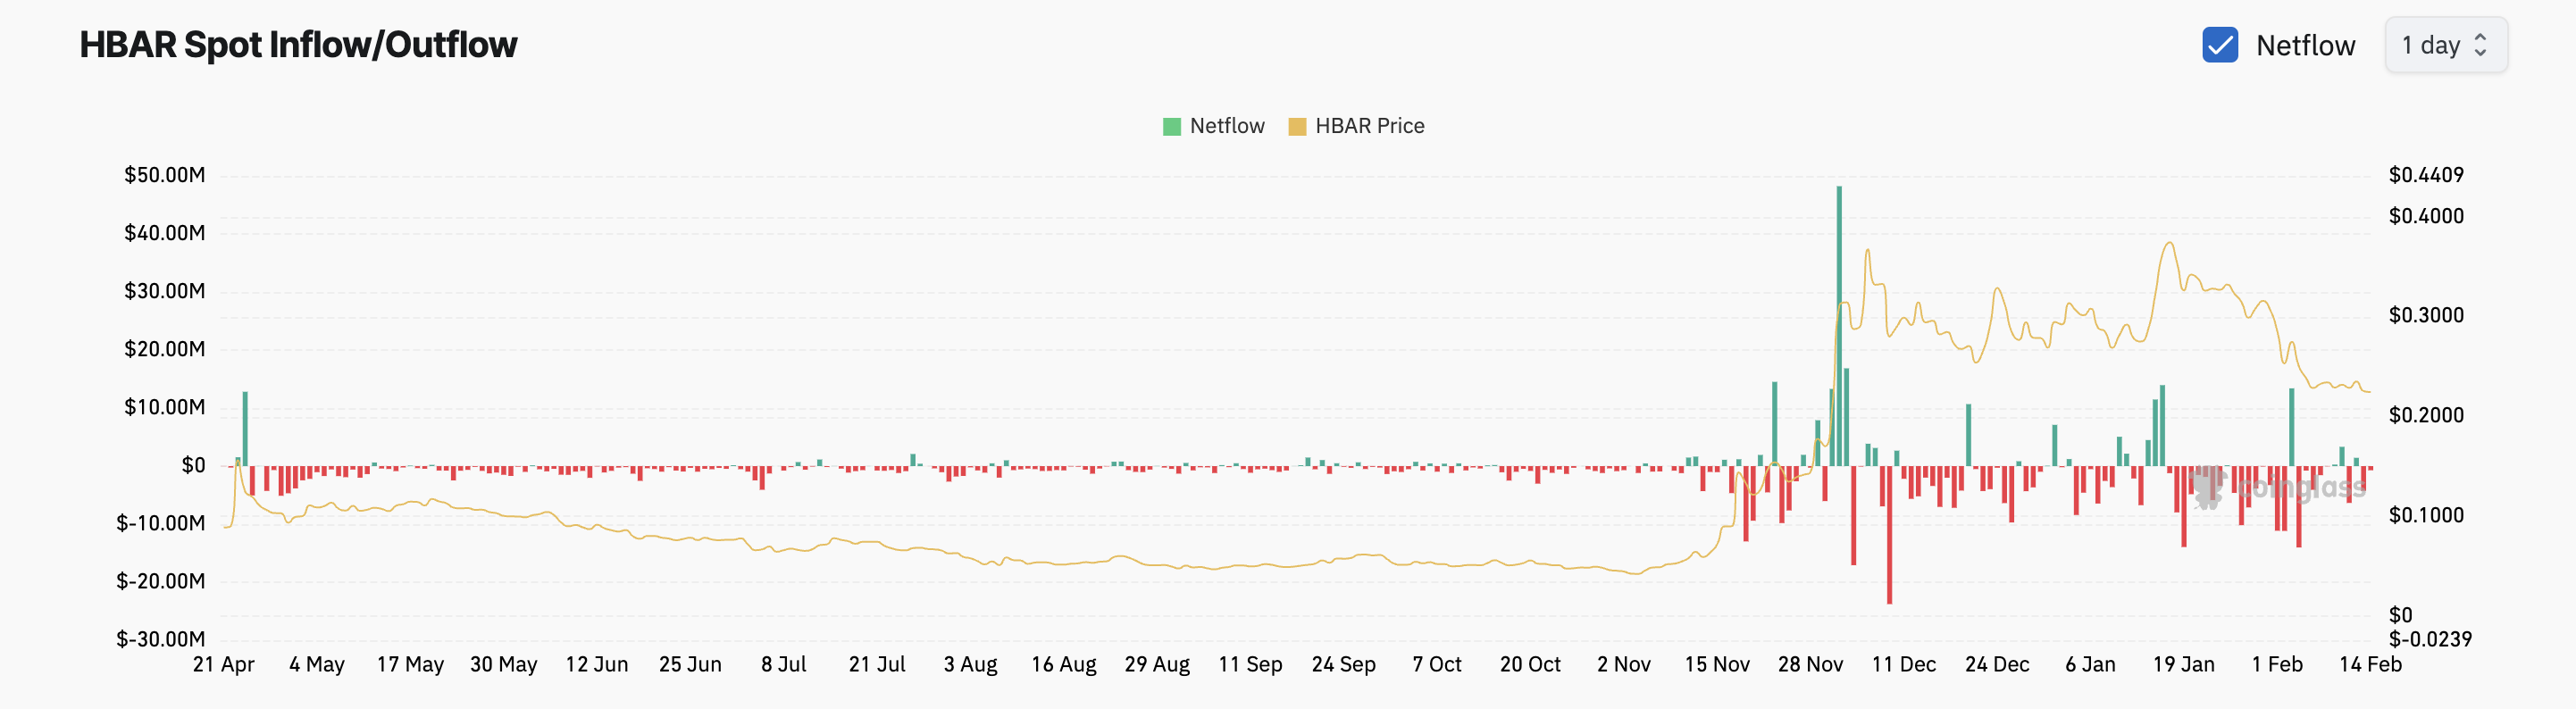
These spot outflows mean more HBAR traders are selling or withdrawing the asset from exchanges than buying or depositing it. This signals growing selling pressure among its holders, hinting at an extended price decline.
HBAR Price Prediction: Breakout or Breakdown Ahead?
On a daily chart, HBAR’s Super Trend indicator forms significant resistance above it at $0.30. This indicator tracks the direction and strength of an asset’s price trend. It is displayed as a line on the price chart, changing color to signify the current market trend: green for an uptrend and red for a downtrend.
When an asset trades below the Super Trend line, it signals a bearish trend, indicating potential downward momentum and selling pressure. If selloffs increase, HBAR’s price could break below the $0.22 support level and fall to $0.16.
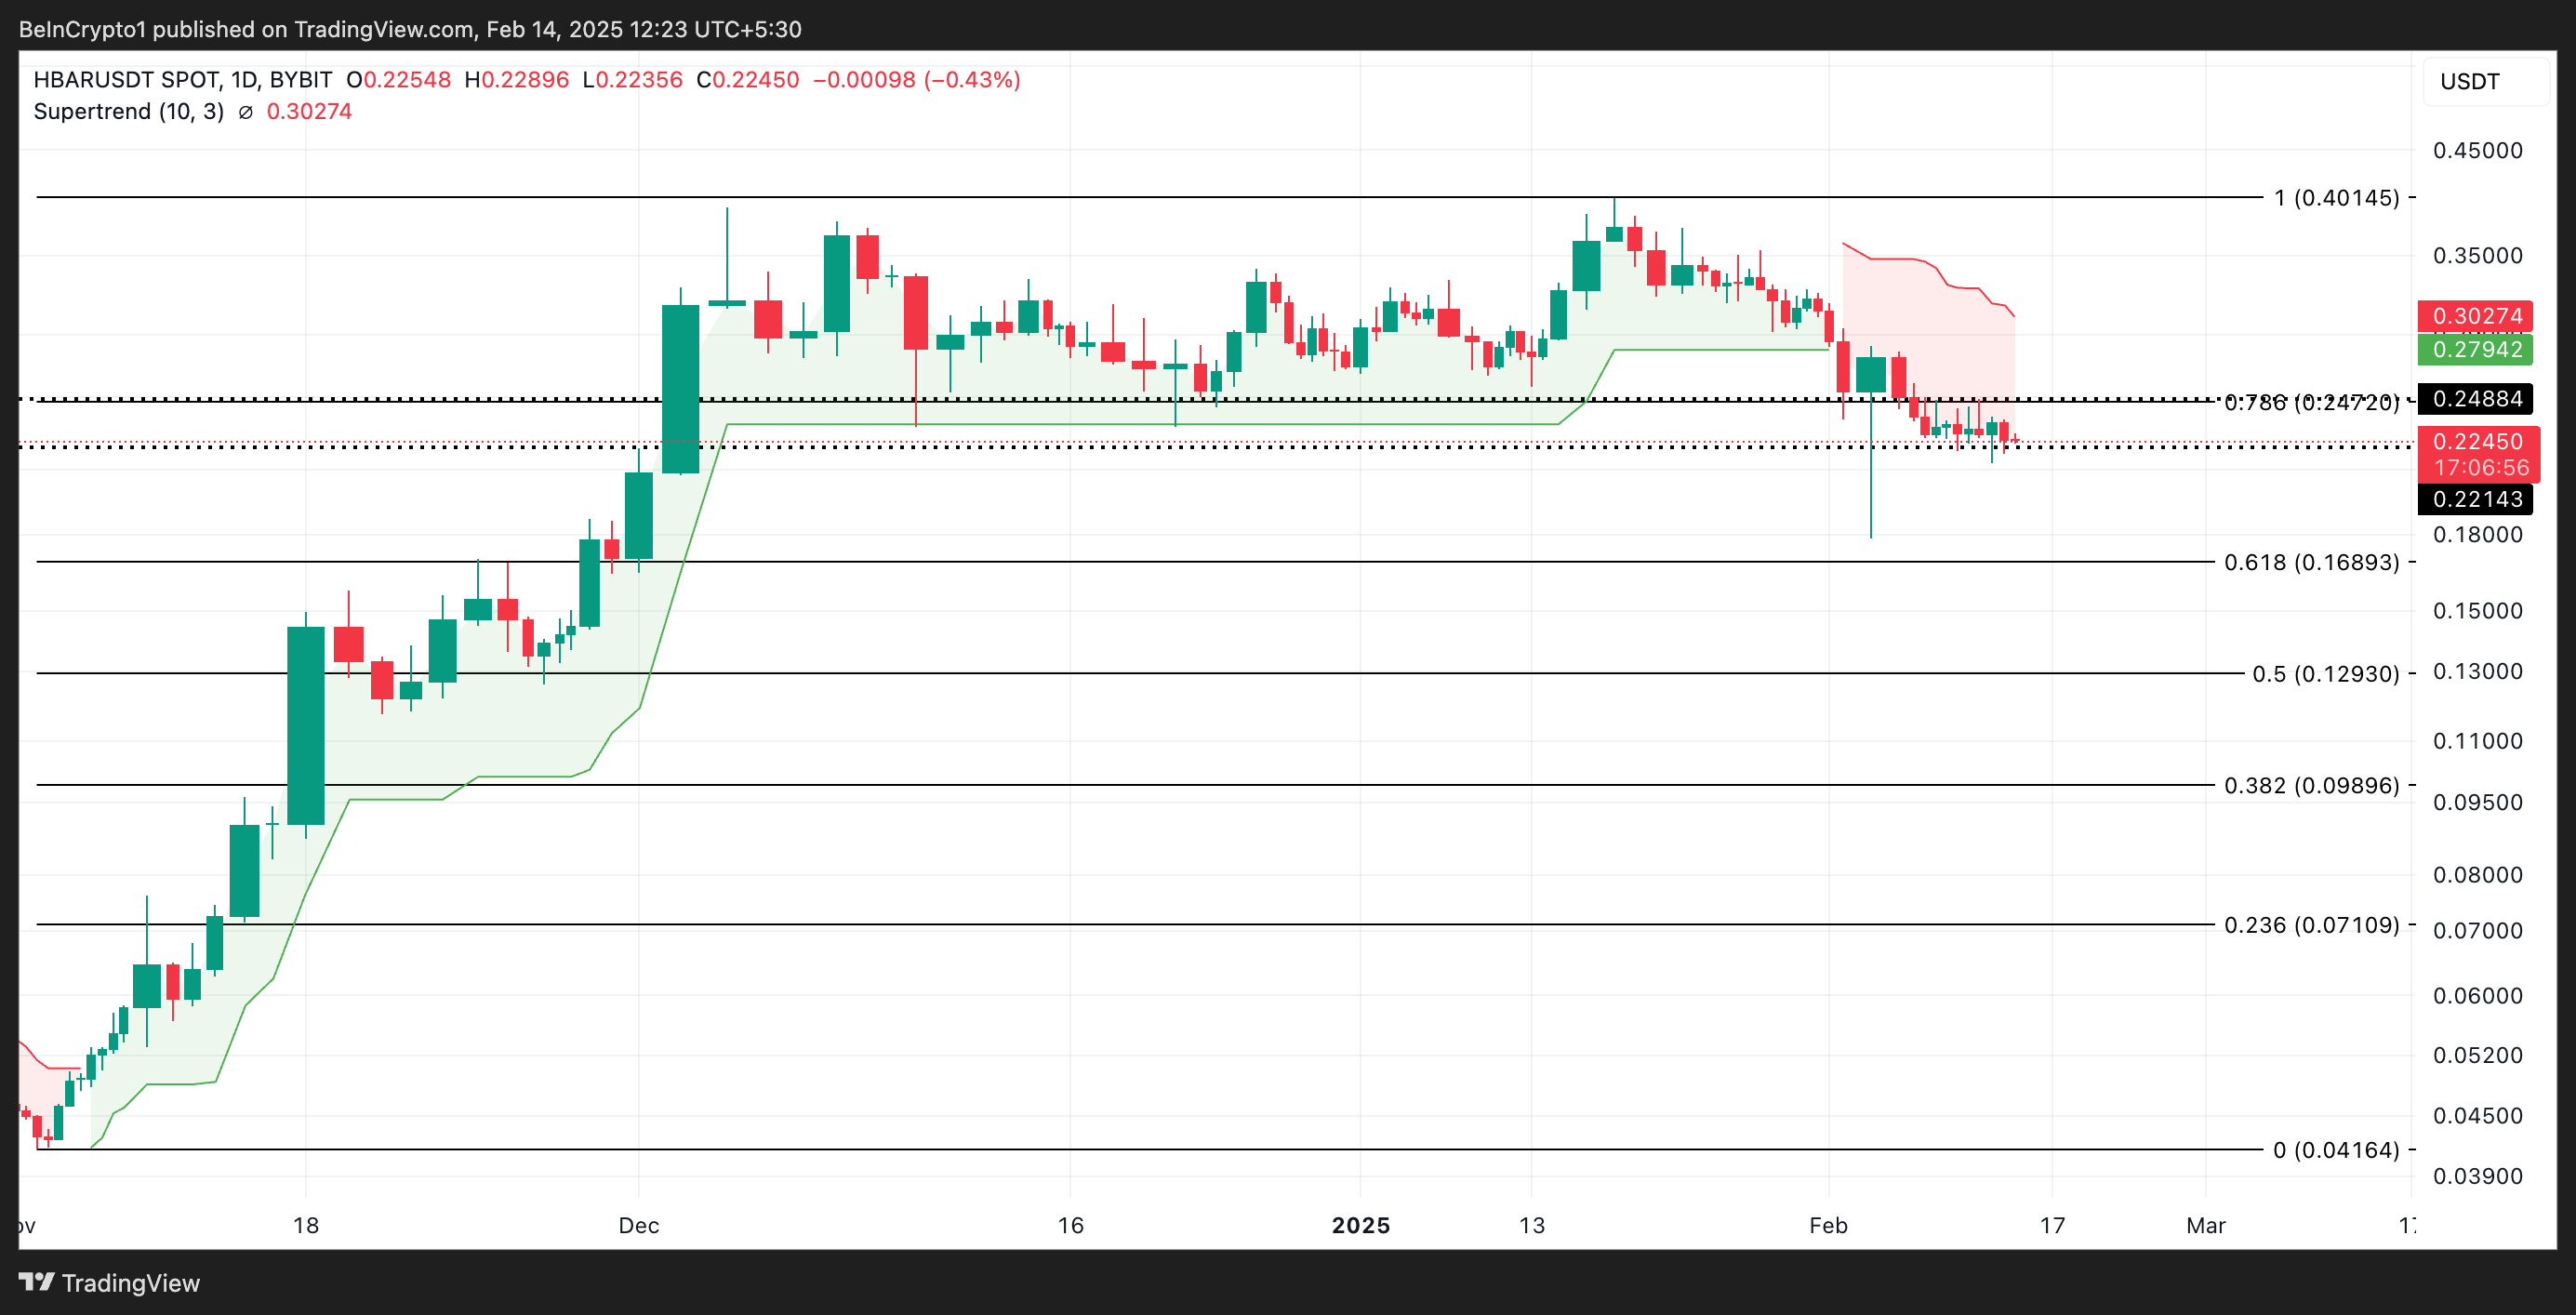
However, if new demand enters the market, it could propel HBAR above $0.24 and toward the $0.30 resistance.


