
Hedera has remained under selling pressure after a steady decline brought HBAR back to retest a long-standing technical pattern. The token has been trading within this structure for several months, limiting upside attempts.
While multiple indicators now point toward a bullish setup, price action has yet to confirm the shift, keeping sentiment cautious.
HBAR Has An Underlying Bullish Trigger
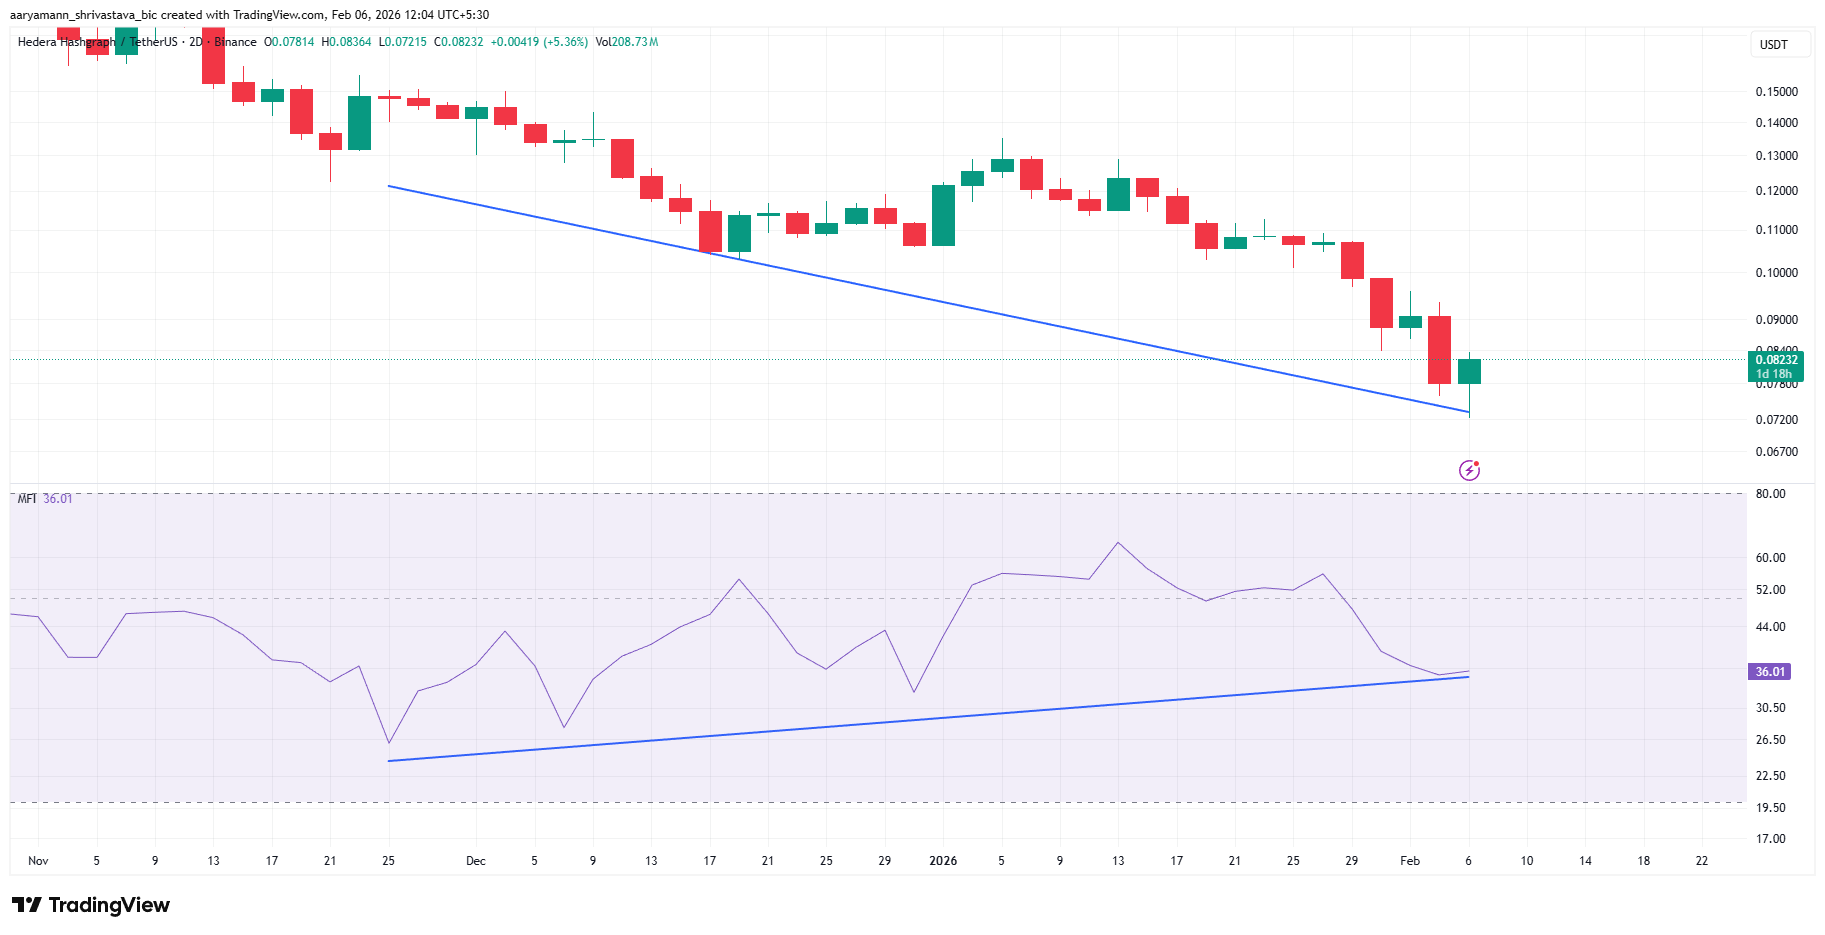
HBAR’s Money Flow Index is showing early signs of strength despite continued price weakness. On the two-day chart, the indicator is forming a bullish divergence with the price. While HBAR has printed a lower low, the MFI has held higher lows, indicating rising buying pressure beneath the surface.
This divergence suggests that selling momentum is gradually fading. As sellers lose control, buyers begin to step in without immediately pushing prices higher. Such conditions often precede trend reversals, especially when supported by compression patterns and improving momentum indicators across higher timeframes.
Want more token insights like this? Sign up for Editor Harsh Notariya’s Daily Crypto Newsletter here.
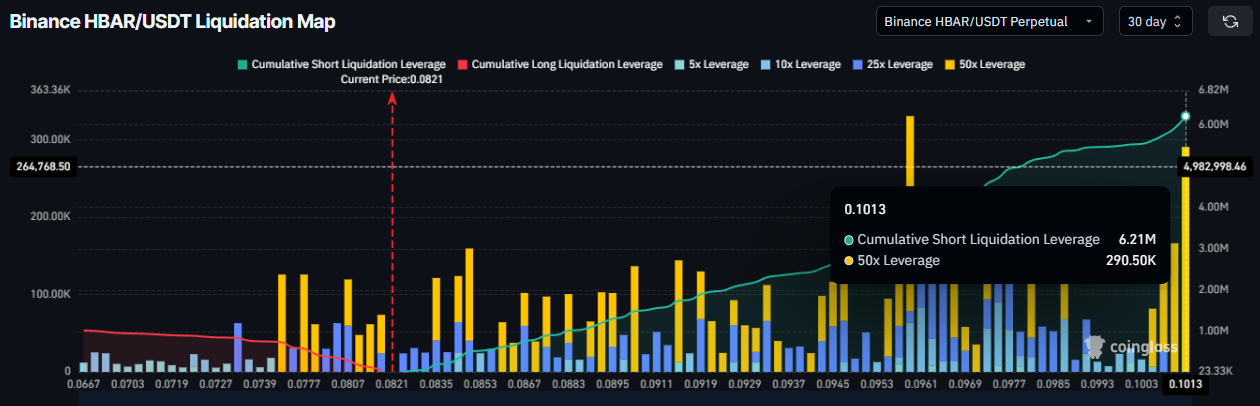
Derivatives data highlights growing risk for bearish traders. The liquidation map shows that a breakout in HBAR price would place significant pressure on short positions. If the price reaches $0.1013, approximately $6.2 million in short liquidations could be triggered, forcing rapid position closures.
Given the pattern HBAR is currently trading within, a breakout could occur quickly once resistance is breached. Forced liquidations typically accelerate price movement, amplifying upside momentum. As a result, short traders face heightened exposure if HBAR breaks above its current range.
HBAR Price Breakout Is Possible
HBAR price is trading near $0.0826 at the time of writing, holding above the $0.0786 support level. The altcoin has been moving within a descending channel for nearly four months. This structure reflects prolonged consolidation while volatility continues to compress.
A breakout from this pattern appears increasingly likely as selling pressure dissipates on a macro scale. Confirmation would require HBAR to breach the channel’s upper trendline and flip $0.1042 into support. Such a move would trigger short liquidations and push the price toward $0.129, the pattern’s projected 32% upside target.
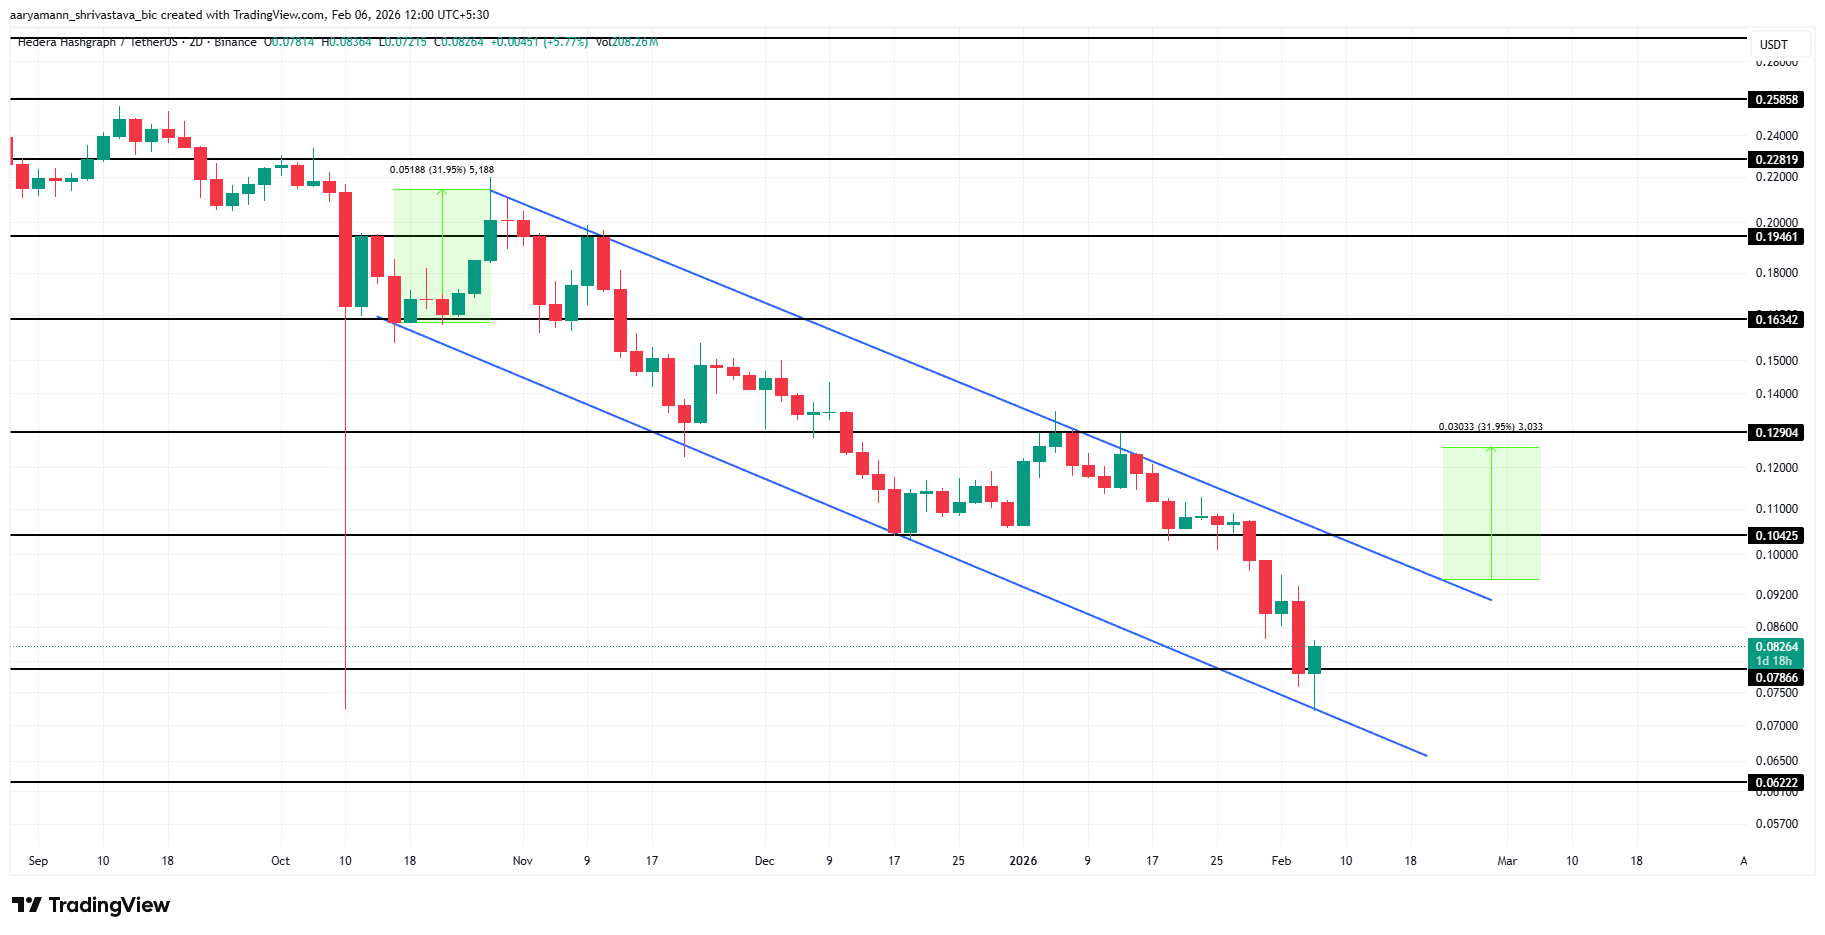
However, downside risk remains if broader market conditions fail to improve. A loss of the $0.0786 support would weaken the structure. Under that scenario, HBAR could slide toward $0.0622. A move to that level would invalidate the bullish thesis entirely.
