
Hedera’s price has remained under sustained pressure as the broader crypto market weakness deepens recent losses. HBAR continues trending lower after failing multiple recovery attempts, reflecting cautious investor behavior.
The correction has been amplified by fading demand, with ETF data showing little interest from both crypto-native and traditional investors.
Hedera ETF Fails To Impress
Spot crypto ETFs dominated market narratives throughout 2024 and into 2025. Several major altcoins were expected to follow Bitcoin and Ethereum into exchange-traded products. Hedera was among those viewed as a strong candidate, supported by enterprise partnerships and a regulated positioning narrative.
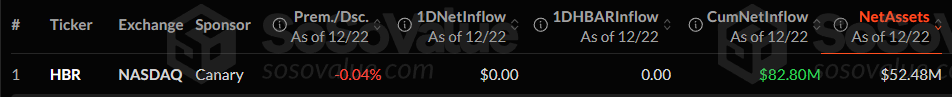
However, recent ETF data tells a different story. Less than two months after launch, the Canary HBAR ETF recorded zero inflows on December 22. It suggests limited appetite for HBAR exposure across both crypto markets and traditional finance channels, weakening sentiment further.
The absence of ETF demand reduces a key bullish catalyst. Without institutional inflows, HBAR lacks a meaningful buffer against selling pressure. This development reinforces concerns that the earlier ETF optimism was speculative rather than supported by sustained capital allocation.
Want more token insights like this? Sign up for Editor Harsh Notariya’s Daily Crypto Newsletter here.
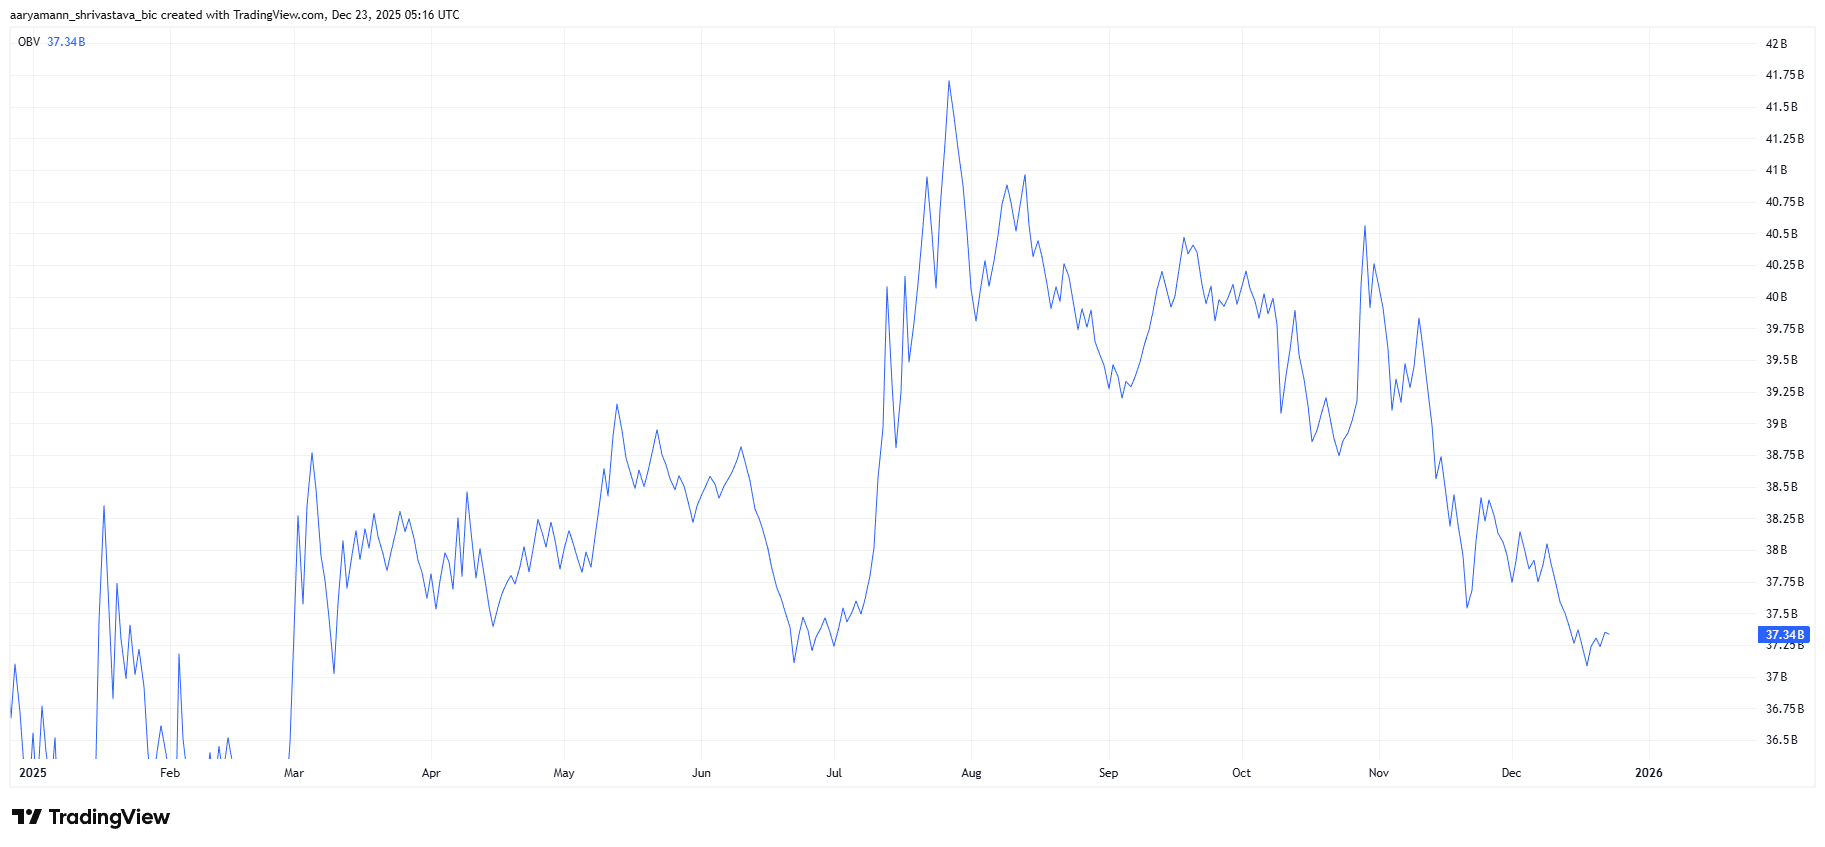
Technical indicators continue to deteriorate. On-balance volume has fallen to a nine-month low, highlighting persistent distribution. OBV measures whether volume favors buying or selling.
In HBAR’s case, declining OBV confirms that sell-side activity dominates recent trading sessions.
A falling OBV line indicates that volume on down days exceeds volume on up days. This pattern suggests conviction behind the sell-off. When price declines are supported by volume, reversals become harder to achieve without a clear demand catalyst.
For HBAR, the OBV trend aligns with the broader downtrend. Selling pressure appears structural rather than temporary. Until volume stabilizes or turns positive, downside risks remain elevated despite brief consolidation attempts.
HBAR Price Downtrend Will Extend
HBAR trades near $0.111 at the time of writing, remaining below the $0.120 resistance. The token has been locked in a downtrend for more than six weeks. Under current conditions, reclaiming this level appears unlikely without renewed demand or improving market sentiment.
If selling pressure intensifies, HBAR risks losing the $0.110 support. A decisive breakdown could send the price toward $0.099. Such a move would extend the downtrend and reinforce bearish momentum, increasing the likelihood of further losses.
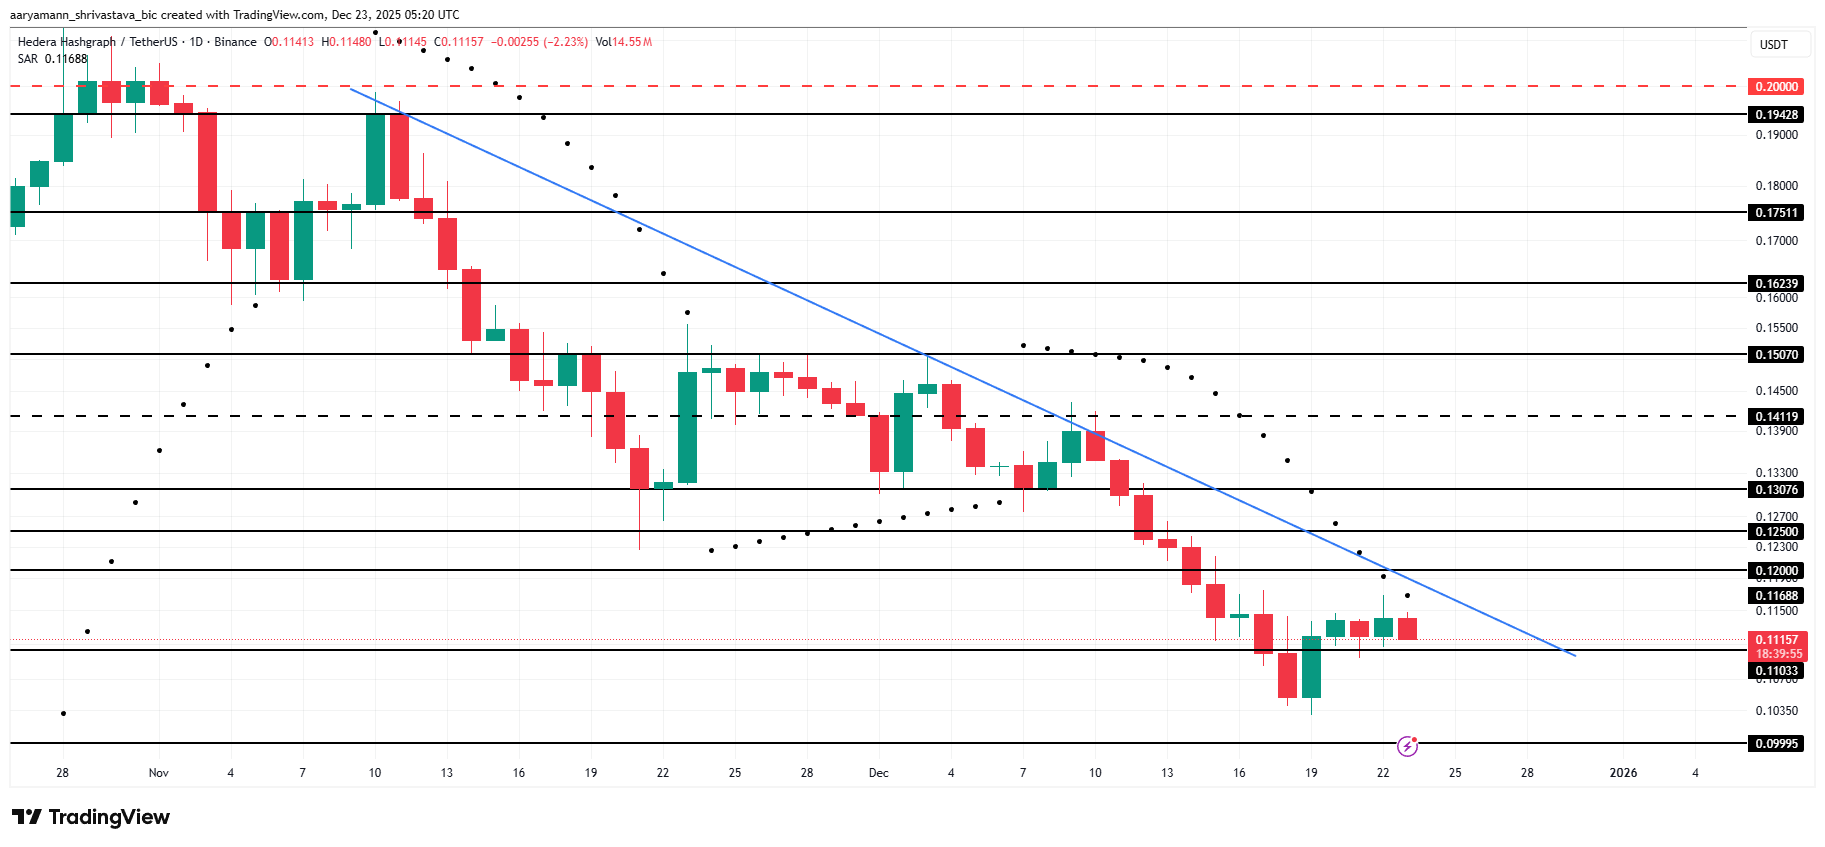
Stability remains possible if conditions improve modestly. Holding above $0.110 could allow HBAR to move sideways and gradually escape the downtrend structure. Even without breaking $0.120, sustained consolidation would weaken the bearish thesis and reduce immediate downside risk.
