


BeInCrypto takes a look at the eight altcoins that decreased the most over the past seven days, from May 28 to June 4.
These altcoins are:
- HNT: -16.67%
- MATIC: -10.47%
- KLAY: -9.55%
- ETC: -7.73%
- REV: -6.93%
- ICP: -6.69%
- EGLD: -6.35%
- QTUM: -6.23%
HNT
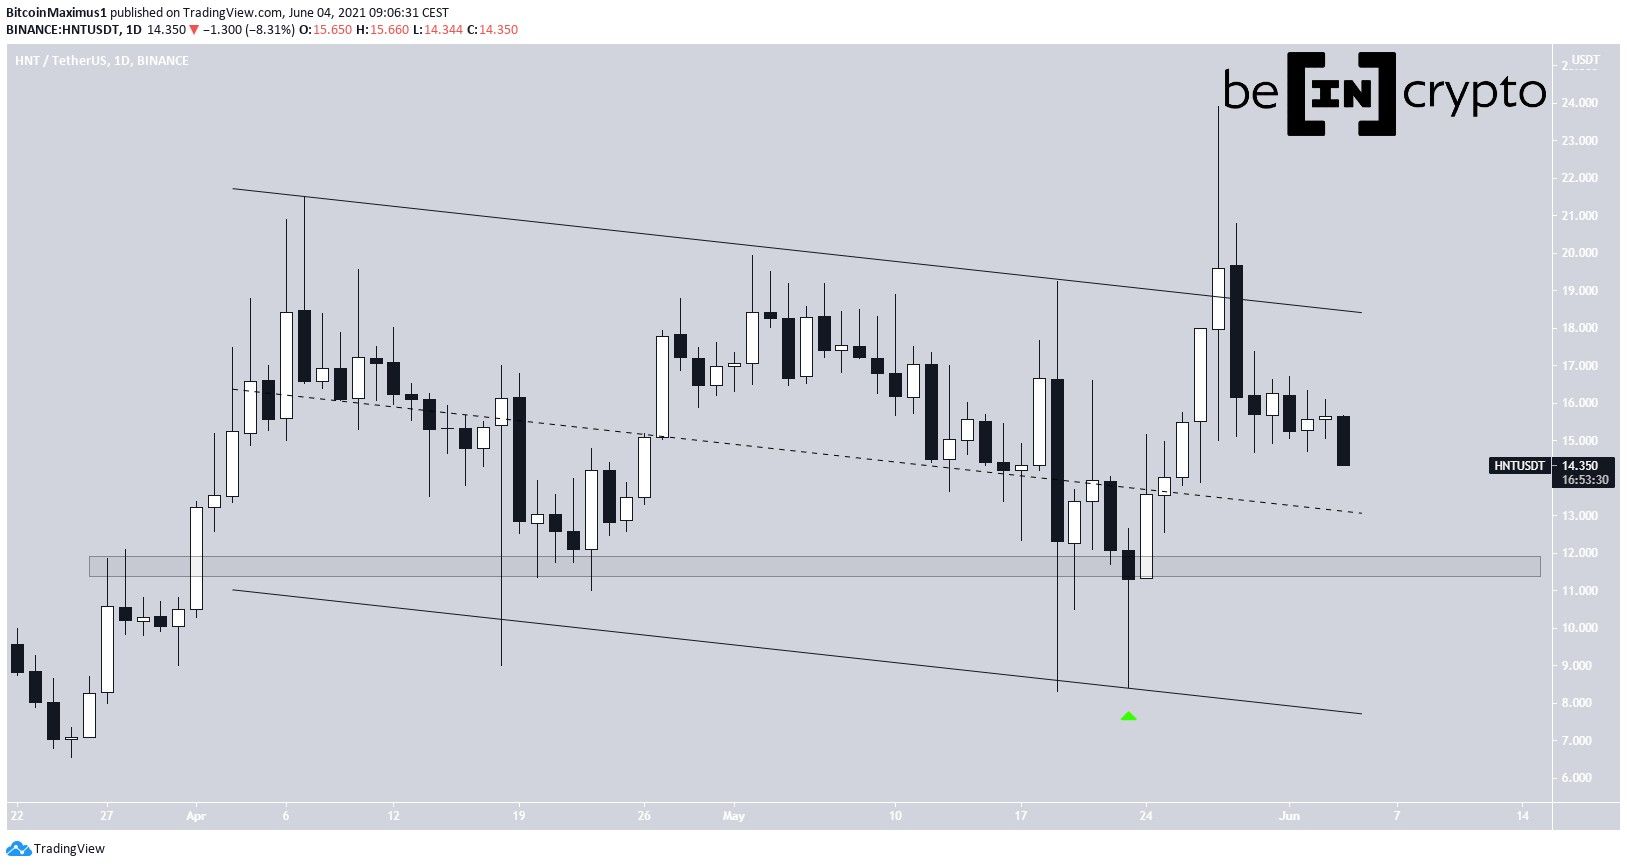
HNT had been trading inside a descending parallel channel since April 7. After bouncing at the support line of the channel on May 23 (green icon), it began an upward movement.
This caused it to reach an all-time high price of $23.90 on May 28. However, it fell shortly after and is now trading back inside the channel.
The closest horizontal support area is found at $11.80.
MATIC
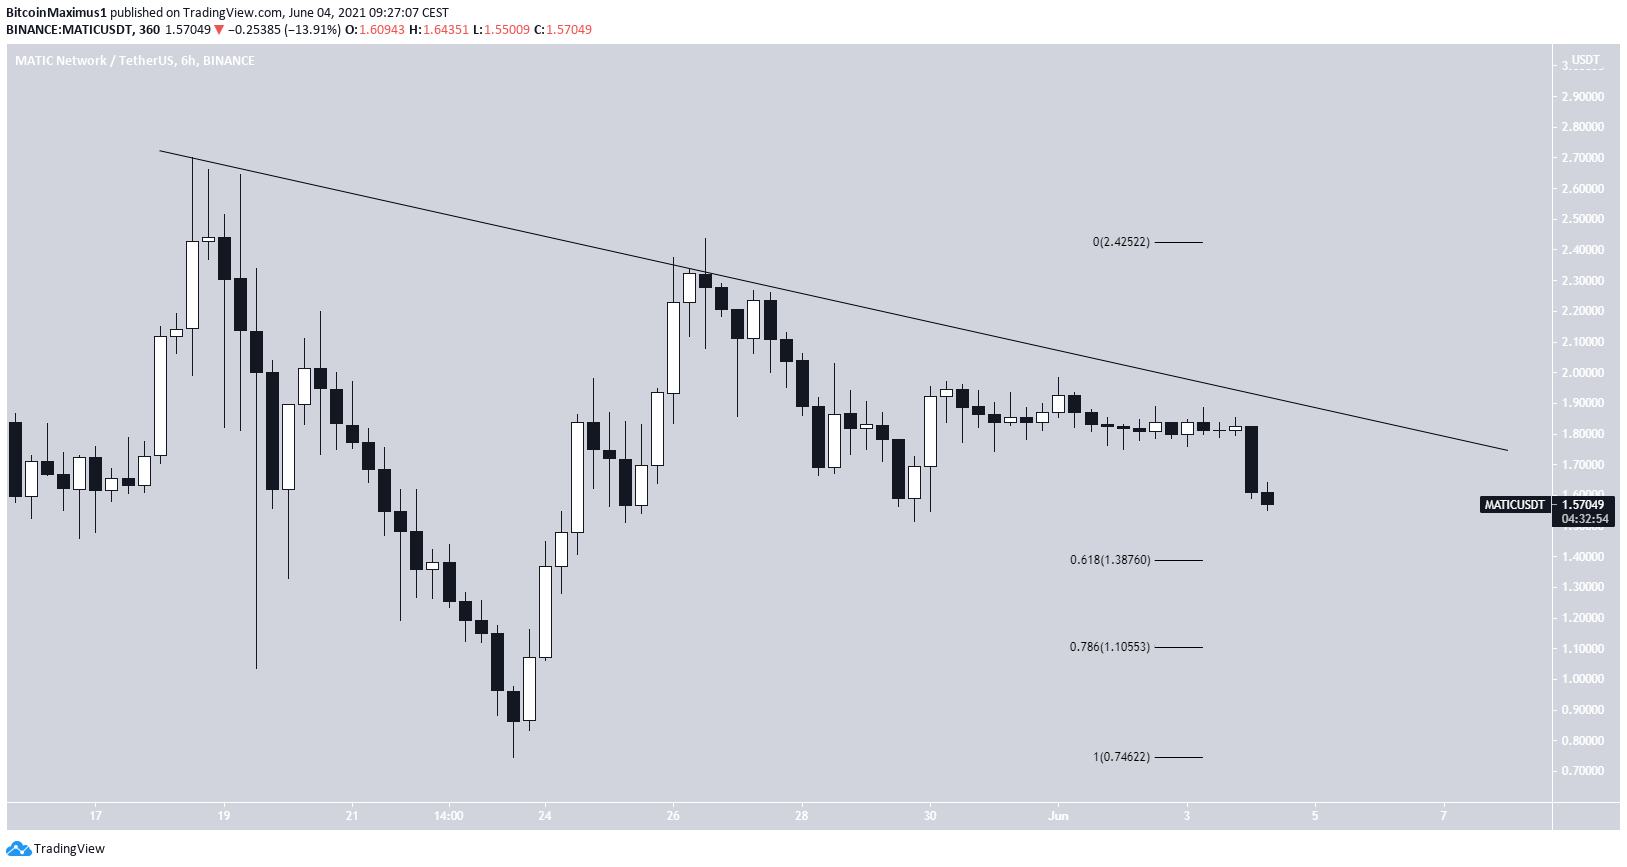
MATIC reached an all-time high price of $2.70 on May 18 before falling sharply. The ensuing bounce caused another lower high to be created on May 26.
However, MATIC was rejected once more and is falling again. The lower high served to validate a descending resistance line.
The main support levels are found at $1.38 and $1.10.
KLAY
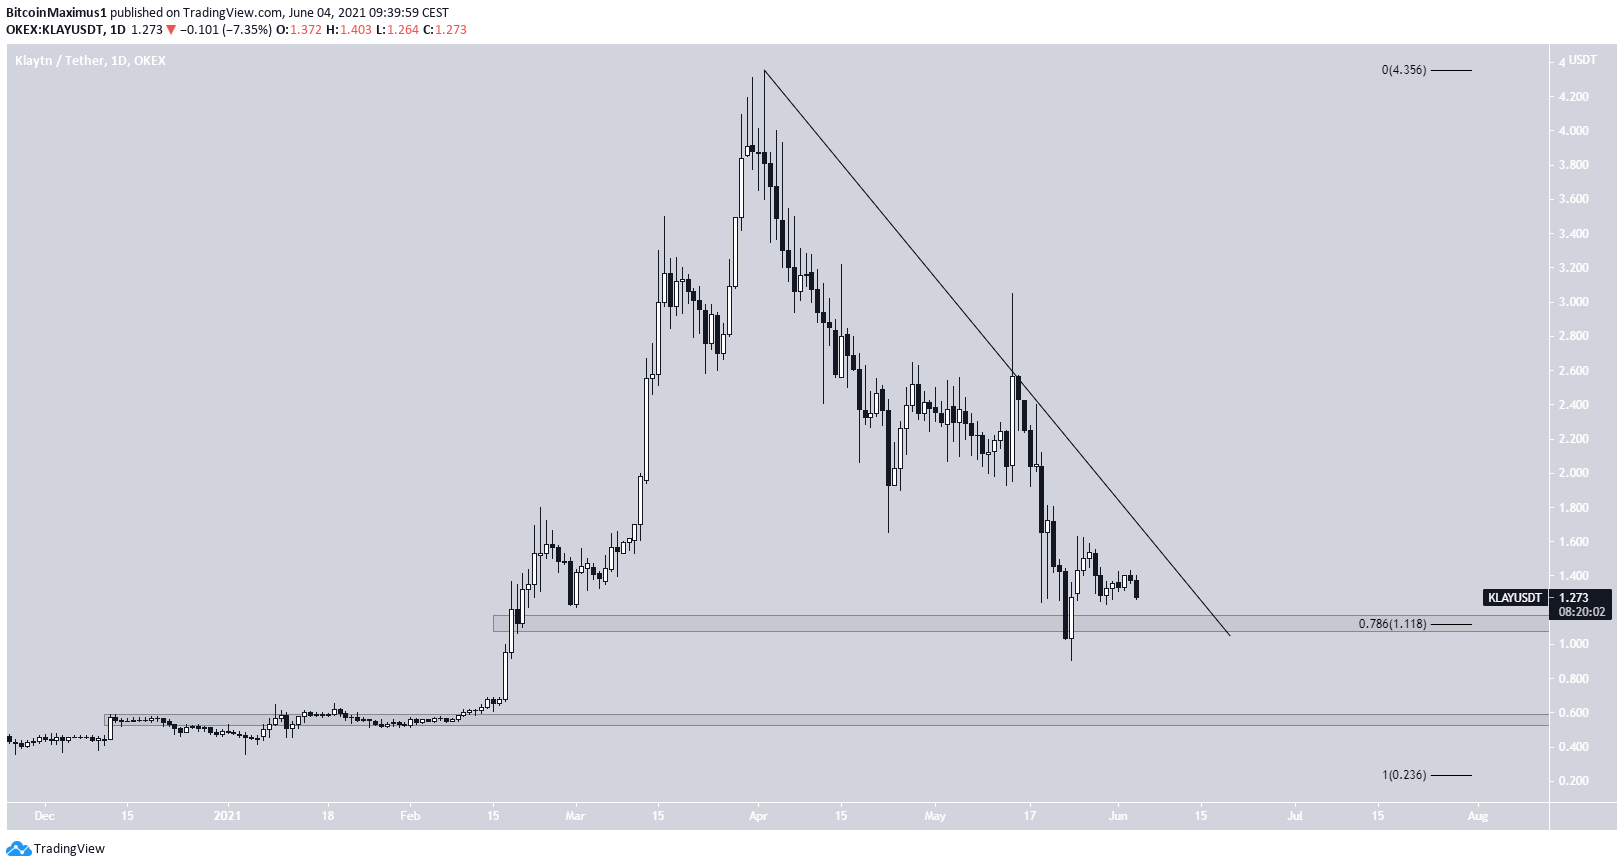
On May 24, KLAY reached a low of $0.90 and bounced. This move served to validate the $1.10 area as support. The area is the 0.786 Fib retracement support level.
However, the bounce was short-lived, and KLAY is close to returning to this support line once more.
Furthermore, it’s following a descending resistance line. Until it breaks out above this resistance, the trend cannot be considered bullish.
The next closest support area is found at $0.58.
ETC
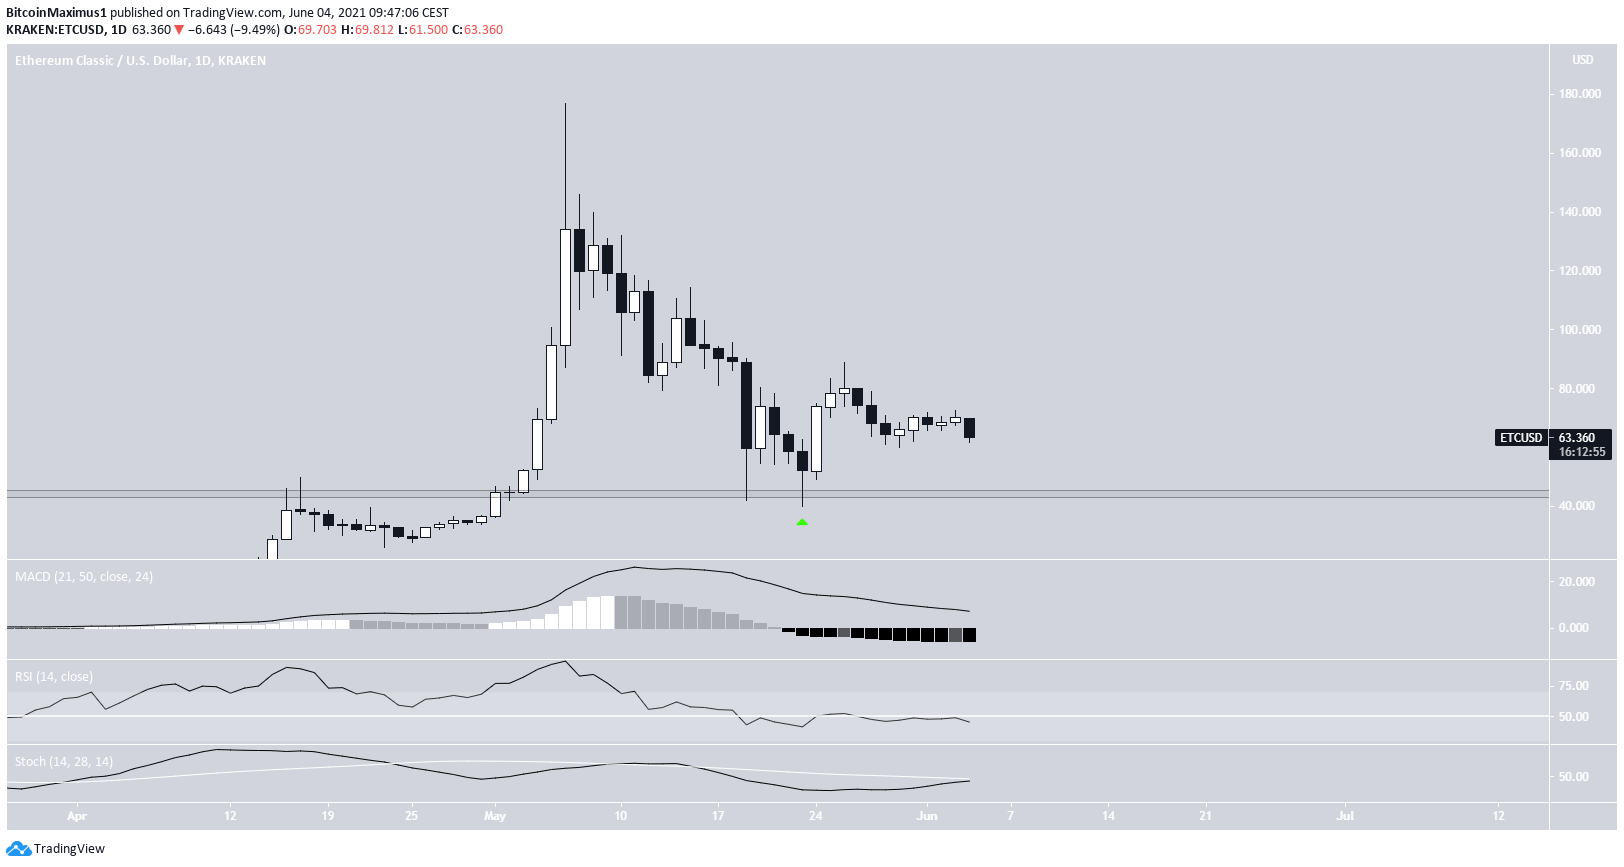
ETC has been moving downwards since May 6, when it reached an all-time high price of $176.72. The decrease continued until a low of $40 was reached on May 23.
This validated the previous all-time high resistance area as support. ETC has been moving upwards since.
However, it has yet to created a higher low and was rejected on May 26.
Technical indicators do not yet provide any bullish signals. The MACD and RSI are decreasing, and the latter is below 50.
In addition, the Stochastic oscillator has yet to make a bullish cross, even though it’s close to doing so.
REV
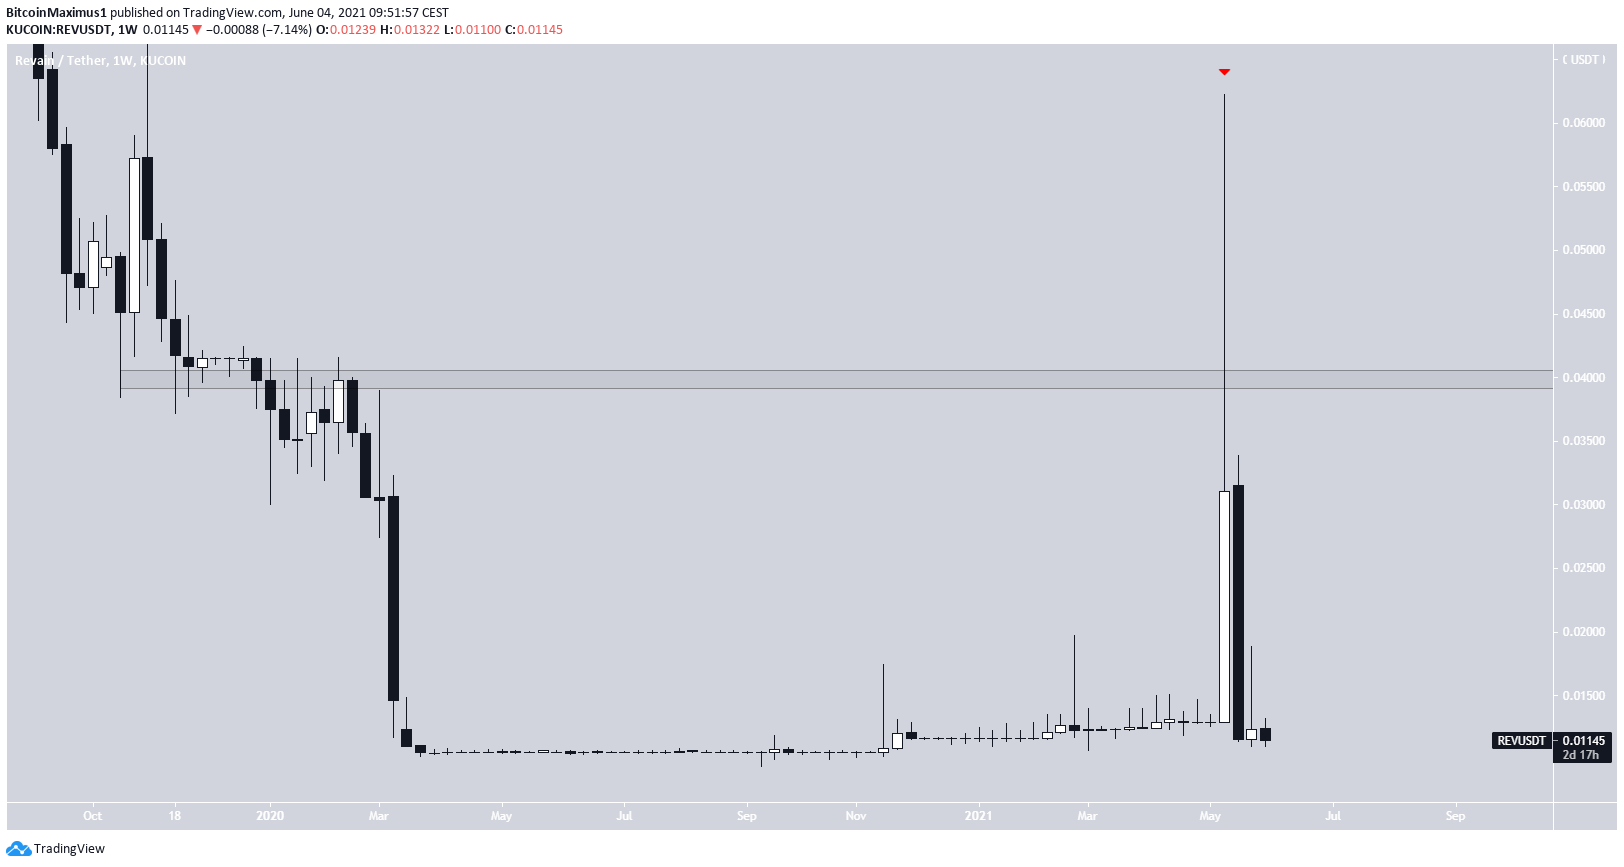
REV has been decreasing since being rejected by the $0.04 resistance area on May 11, creating a very long upper wick.
It has currently returned close to its all-time low levels of $0.01.
The price movement is extremely unusual and lacks a discernible pattern.
ICP
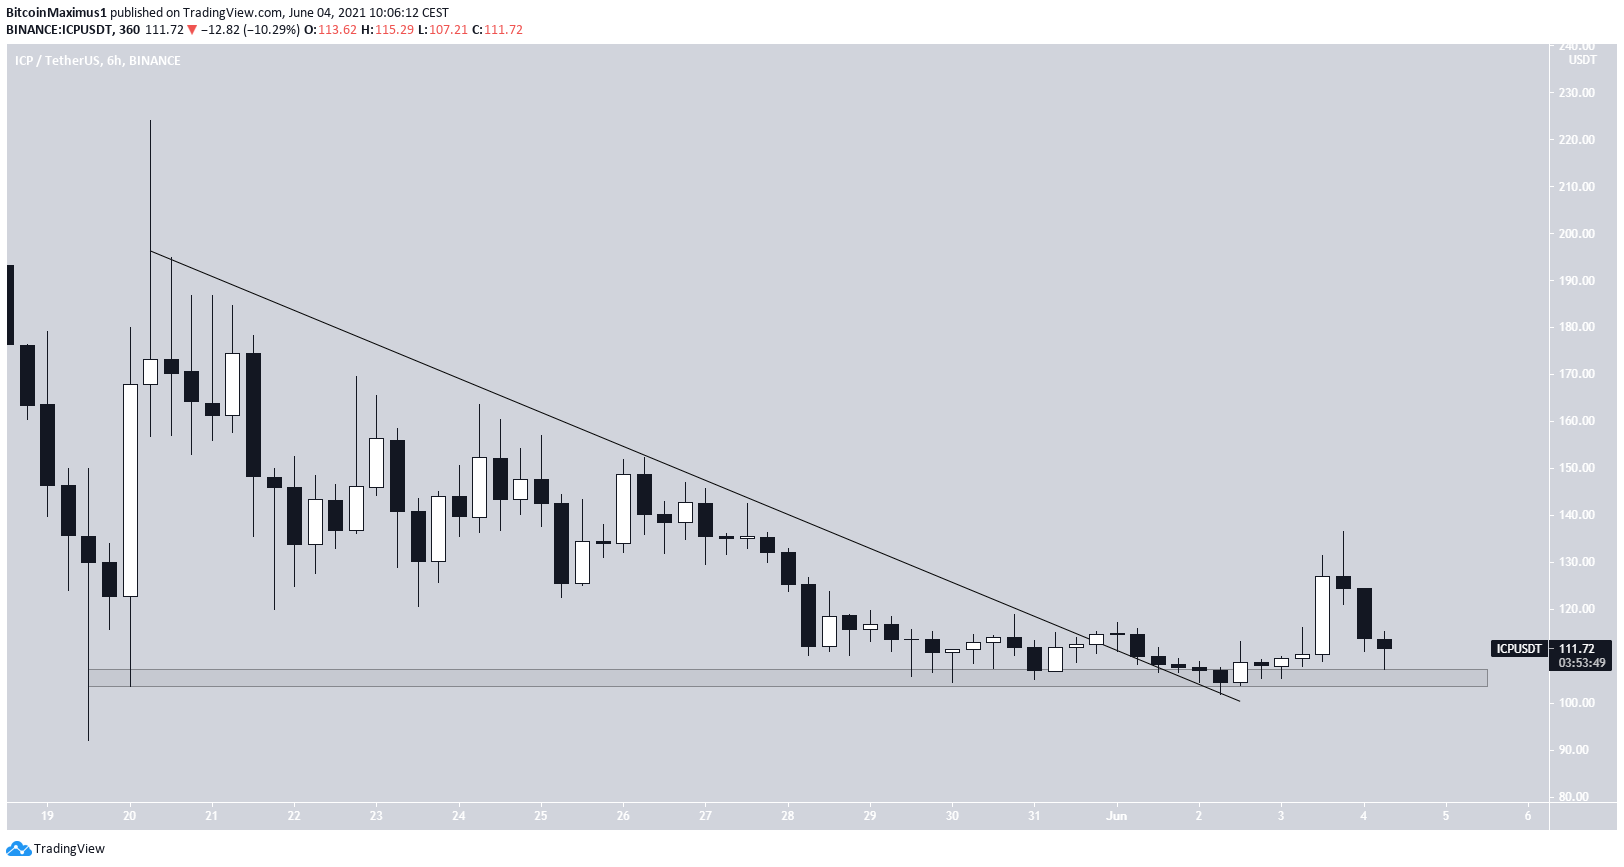
ICP has been moving upwards since reaching an all-time low price of $92 on May 19. It bounced immediately, reaching a high of $224 the next day before falling once more.
On May 31, ICP managed to break out from a descending resistance line.
However, it has returned once more to the $105 support area. A breakdown below this level would take ICP to a new all-time low.
EGLD
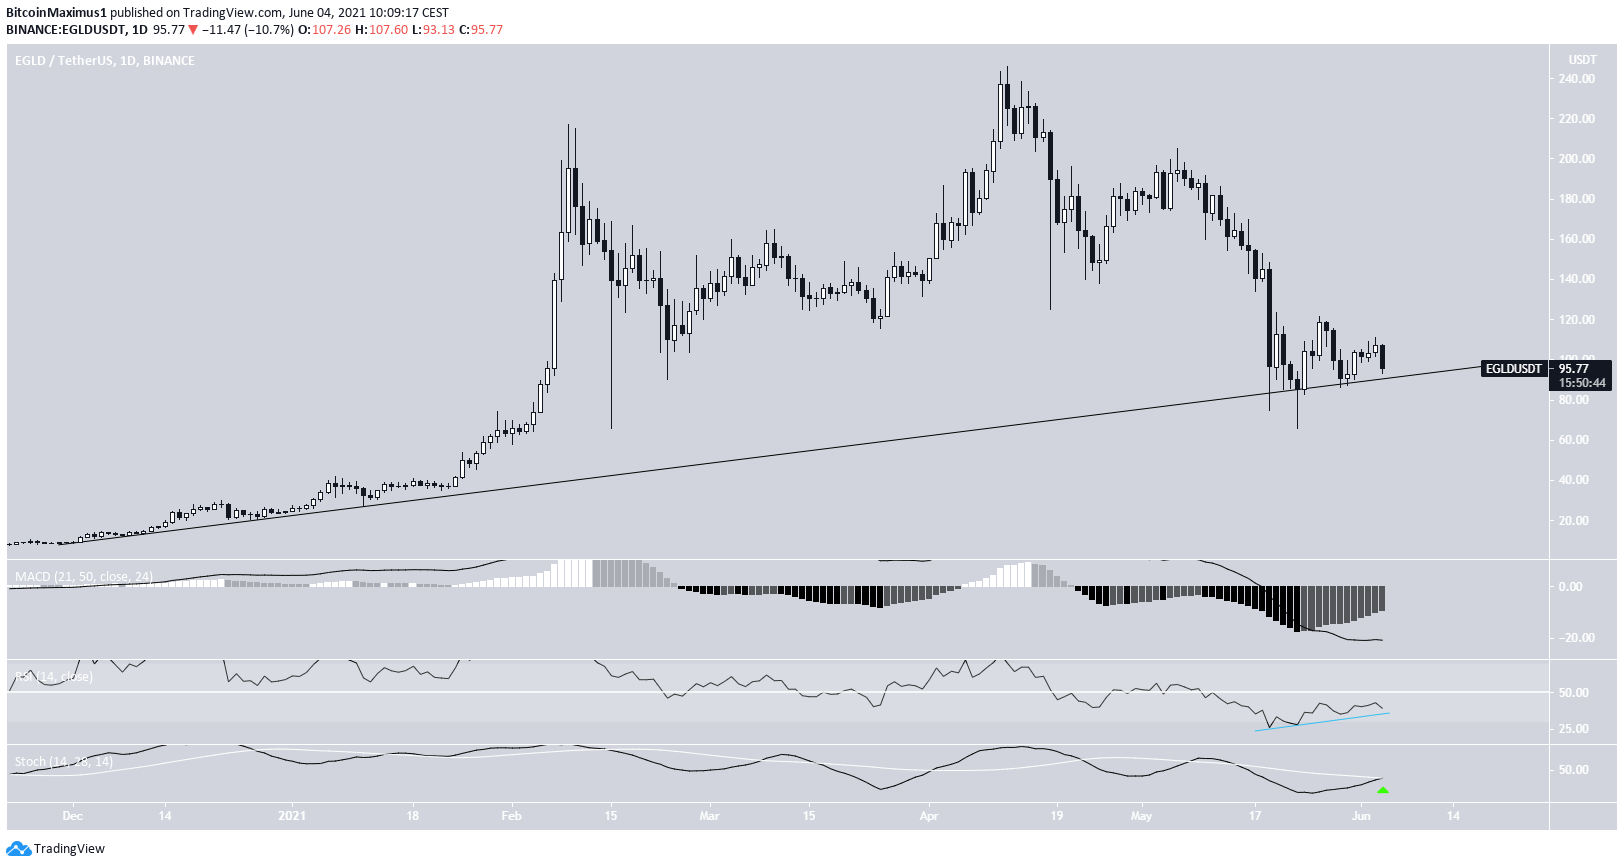
EGLD reached an all-time high price of $245 on April 12. It fell sharply after, leading to a low of $65.95 on May 23.
The decrease took EGLD back to a long-term ascending support line that has been in place since November 2020. This is the sixth touch of the support line.
Technical indicators are providing bullish signs. There is a bullish divergence in the RSI, whose trendline is still intact (blue). Additionally, the Stochastic oscillator has made a bullish cross.
As long as both the long-term ascending support line and the bullish RSI divergence trendline are intact, the trend can be considered bullish.
QTUM
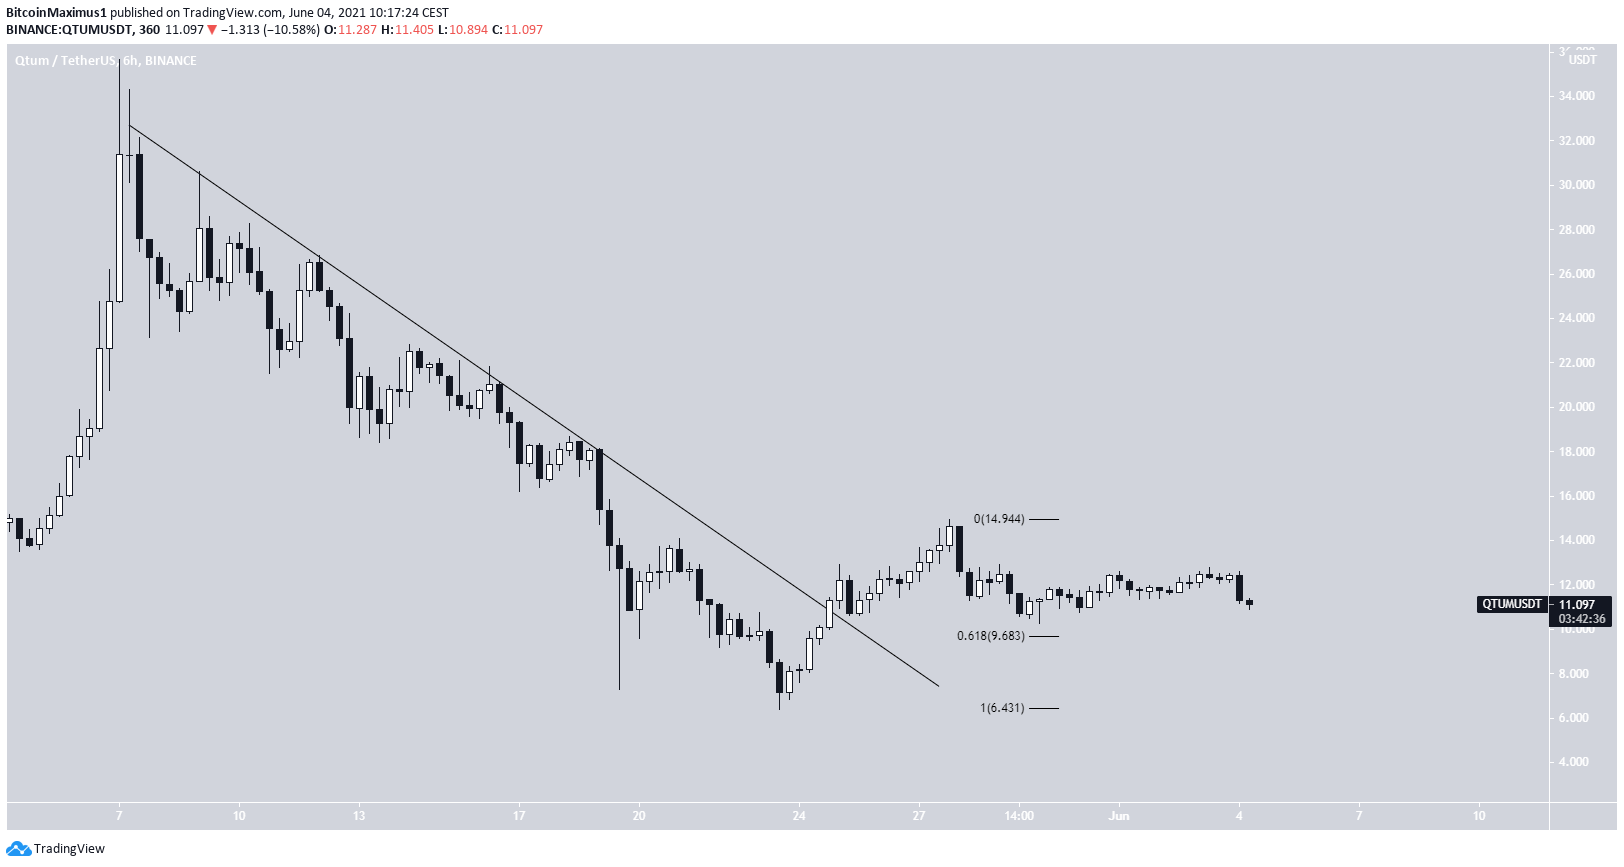
QTUM had been following a descending resistance line since reaching an all-time high price on May 7. While it managed to break out on May 24, the upward movement could not be sustained.
Currently, QTUM is attempting to create a high low. The main support area is found at $9.68, which is the 0.618 Fib retracement support level.
For BeInCrypto’s latest bitcoin (BTC) analysis, click here.


