


BeInCrypto takes a look at the eight altcoins that decreased the most over the past seven days, from Aug 20 to 27.
These altcoins are:
- Audio (AUDIO) : -25.21%
- SushiSwap (SUSHI) : -17.70%
- The Graph (GRT) : -17.32%
- Perpetual Protocol (PERP) : -16.49%
- KLaytn (KLAY) : -16.21%
- SHIBA INU (SHIB) : -15.74%
- Internet Computer (ICP) : -14.64%
- Dogecoin (DOGE) : -14.52%
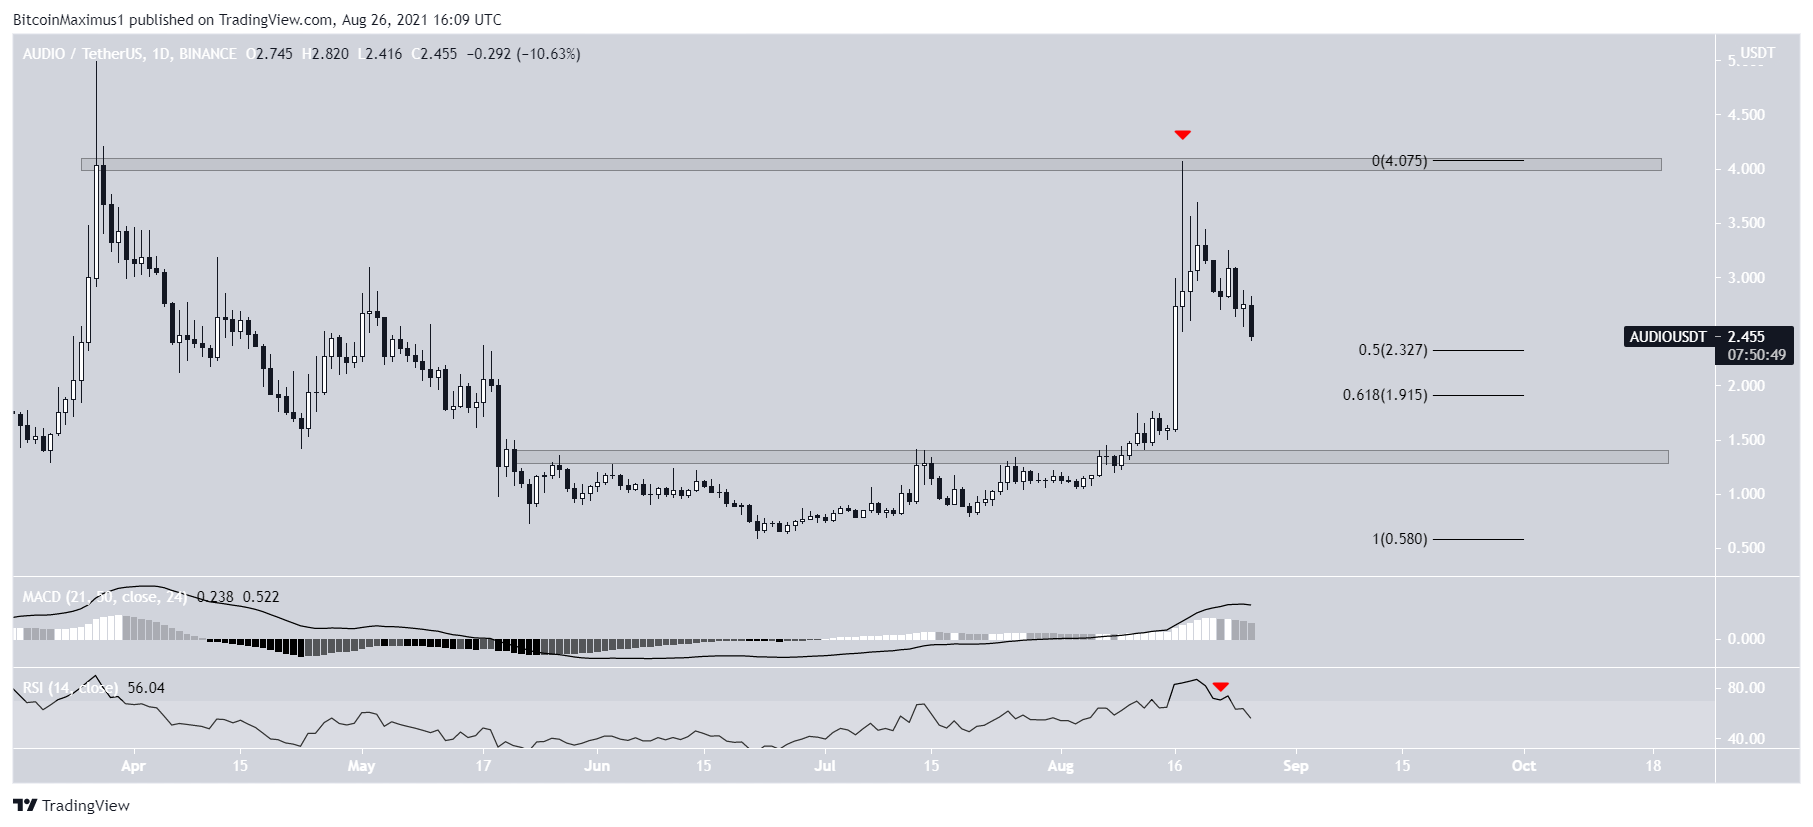
AUDIO
On Aug.17, AUDIO reached a high of $4.07, just slightly below the all-time high price of $4.99.
It decreased immediately after and created a long upper wick (red icon). Following this, the RSI fell below 70 and the MACD gave a bearish reversal signal.
The main support area is found between $1.91-$2.33. This range is created by the 0.5-0.618 Fib retracement support levels. However, the closest horizontal support area is located at $1.35.
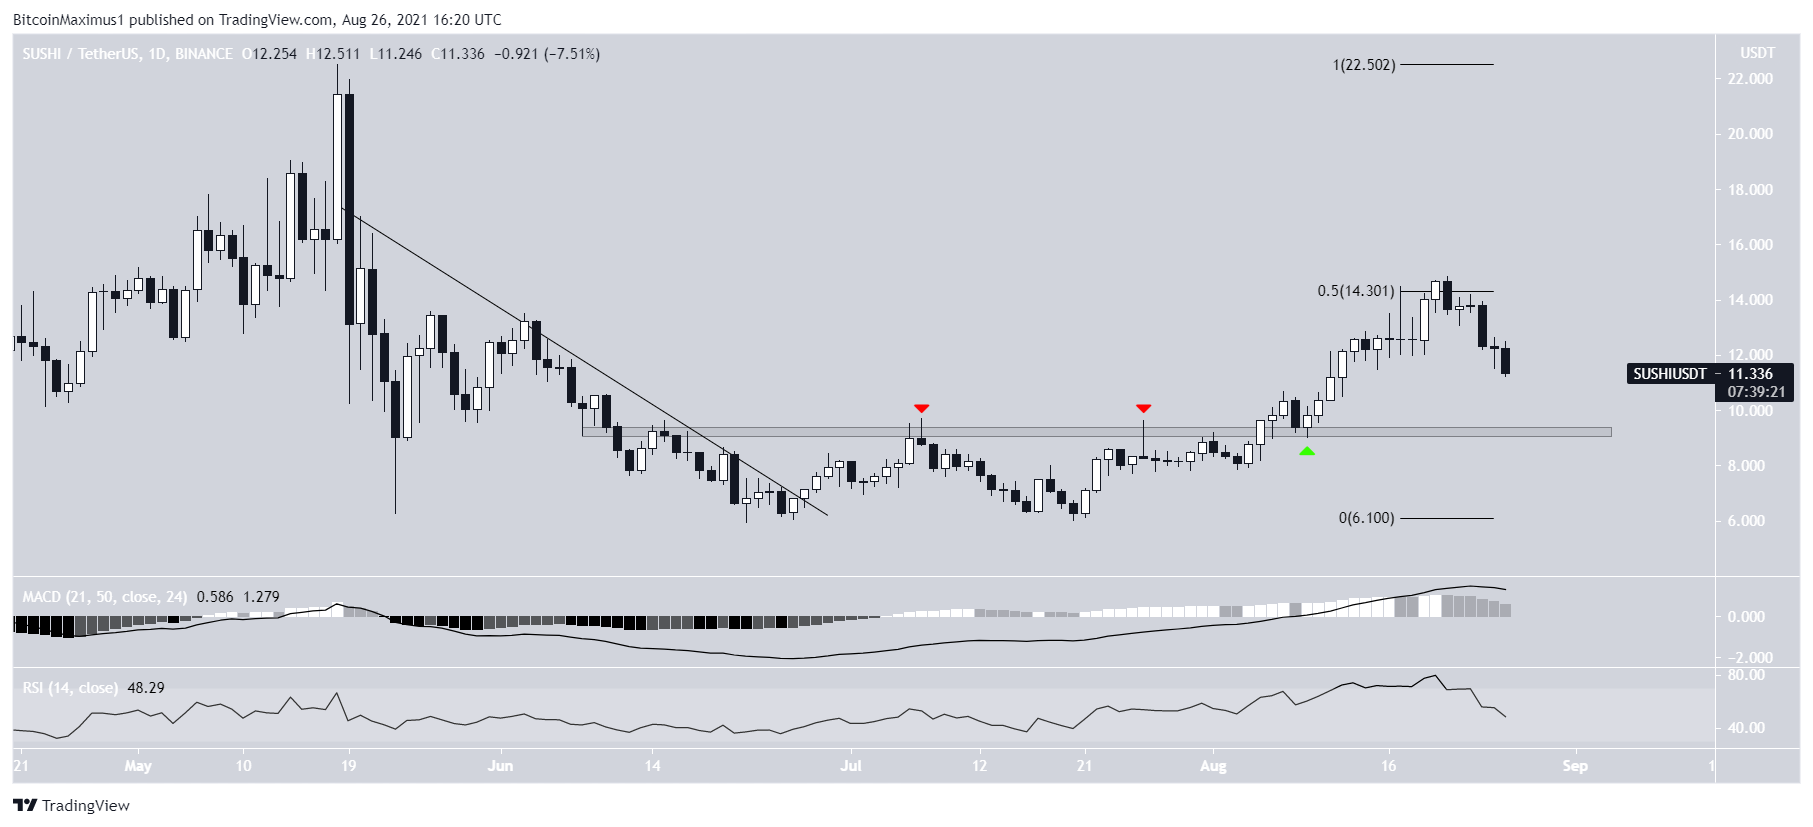
SUSHI
SUSHI has been moving upwards since breaking out from a descending resistance line on June 27. After two unsuccessful attempts, it finally managed to move above the $9.20 horizontal resistance area. After this, it validated the level as support on Aug 9.
SUSHI accelerated after this and reached a high of $14.85 on Aug 21. However, it was rejected by the 0.5 Fib retracement resistance level and has been falling since.
Both the RSI and MACD have turned bearish. The former has fallen below 70 while the latter has given a bearish reversal signal. Therefore, it seems like SUSHI is going to retest the $9.20 horizontal area once again.
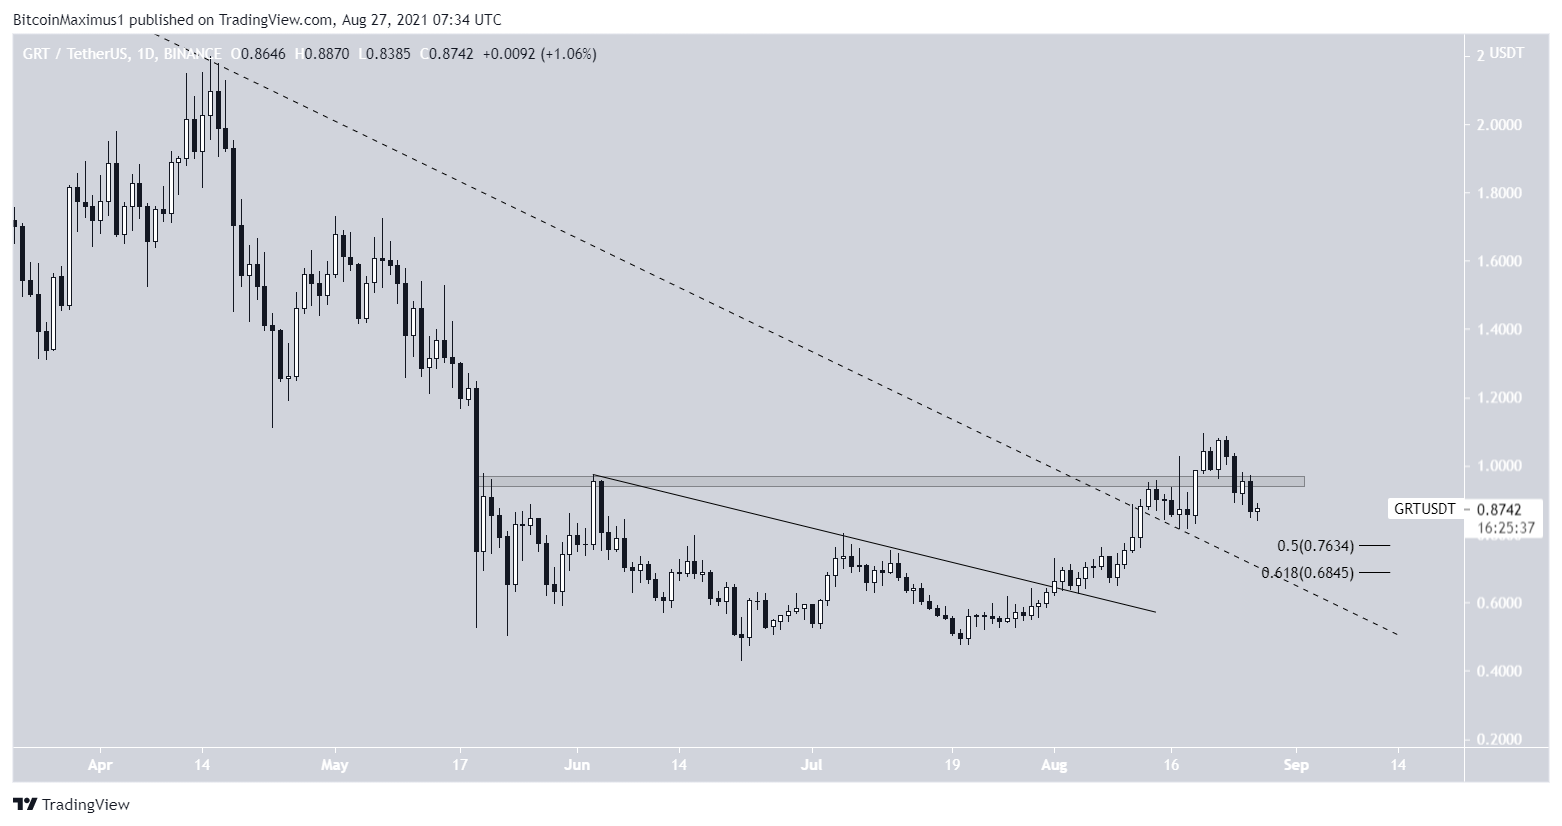
GRT
On Aug 1, GRT broke out from a short-term descending resistance line (solid). It followed this up with a breakout from a longer-term descending resistance line (dashed) on Aug 13.
Several days later, it looked like GRT was going to break out from the $9.50 horizontal resistance area. However, it failed to sustain the upward movement and has been decreasing since Aug 20. The $9.50 area is expected to act as resistance once more.
GRT is currently attempting to find support between $0.68-$0.76. This range is made up of the 0.5-0.618 Fib retracement support levels. A drop to this area would also validate the long-term descending resistance line as support.
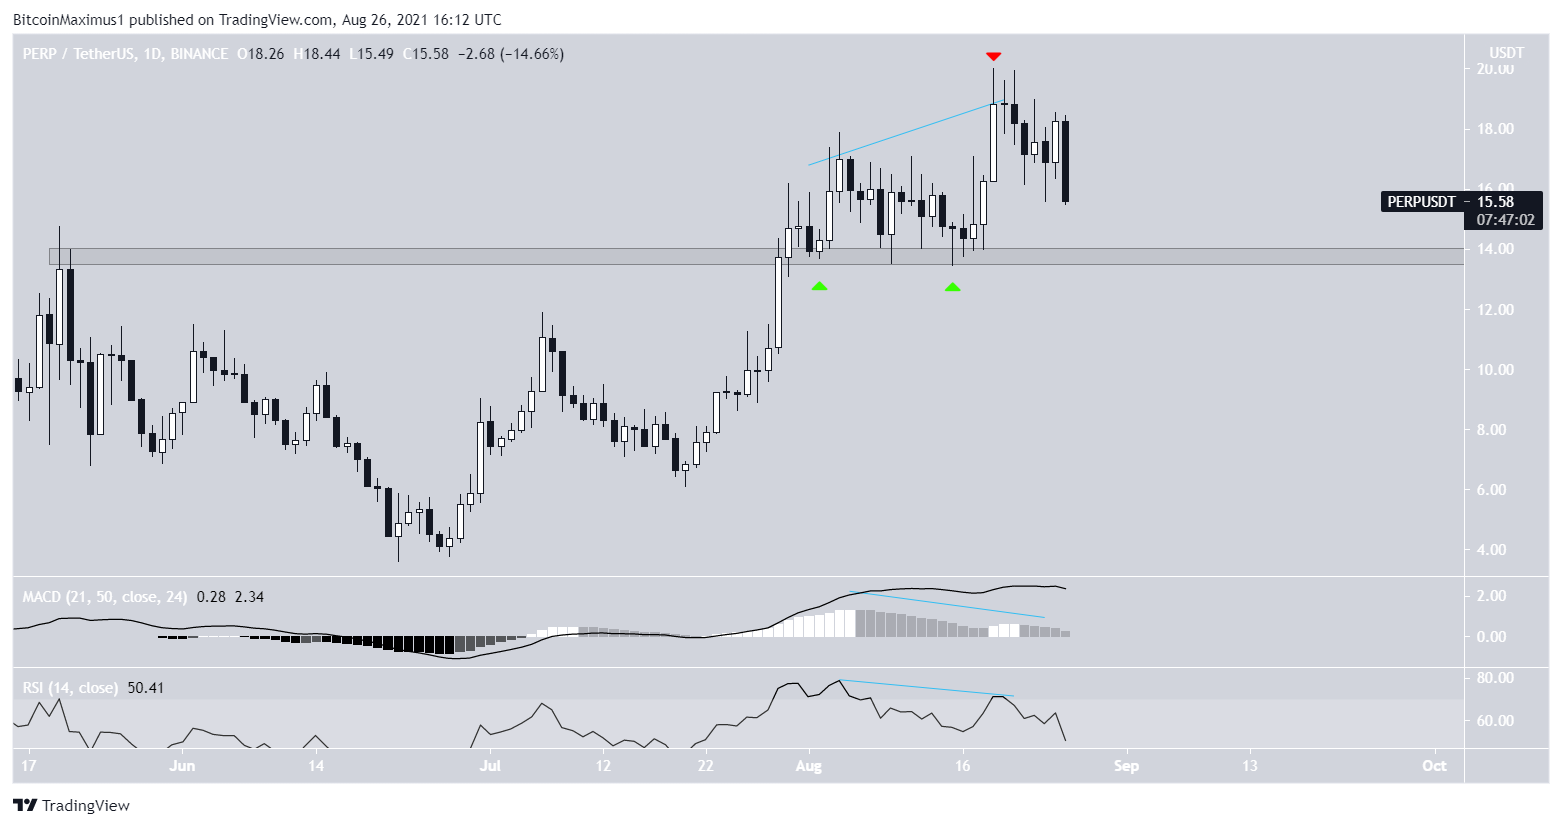
PERP
On Aug 19, PERP Reached a new all-time high price of $20. However, the high was combined with considerable bearish divergences in both the RSI and MACD. The price began to fall two days later, creating several long upper wicks (red icon).
On Aug 26, PERP created a bearish engulfing candlestick.
The closest support area is found at $13.90. This is the previous all-time high level which turned to support in August (green icons).
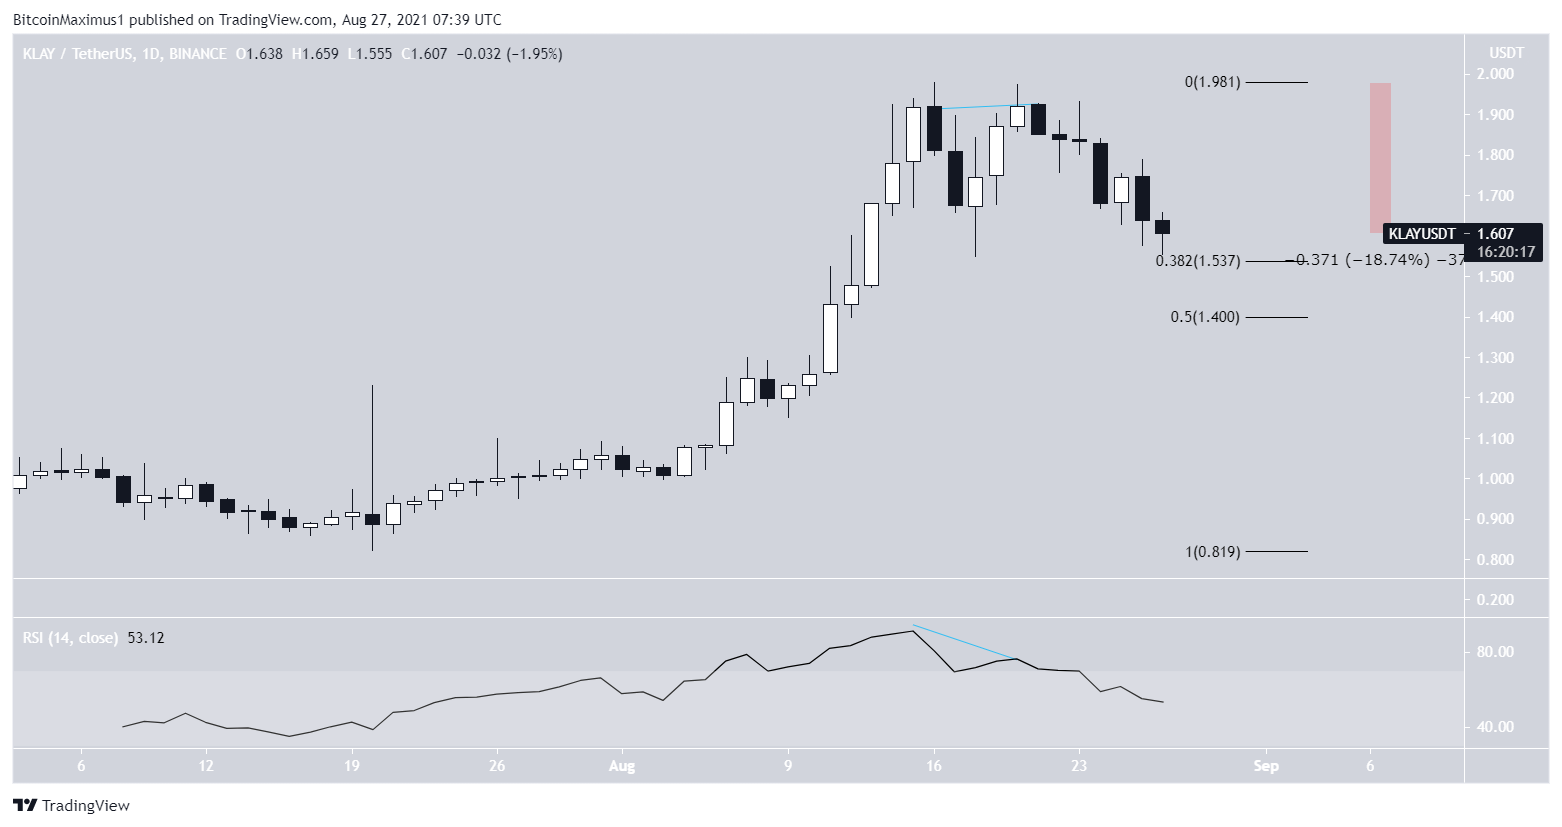
KLAY
On Aug 16, KLAY reached an all-time high price of $1.98. After a slight drop, it initiated an upward move but created a double top pattern on Aug 20. The bearish pattern was combined with a bearish divergence in the RSI.
KLAY has been moving downwards since Aug 20 and is currently trading just above the $1.54 Fib support level after decreasing by 19%.
The next support level is found at $1.40.
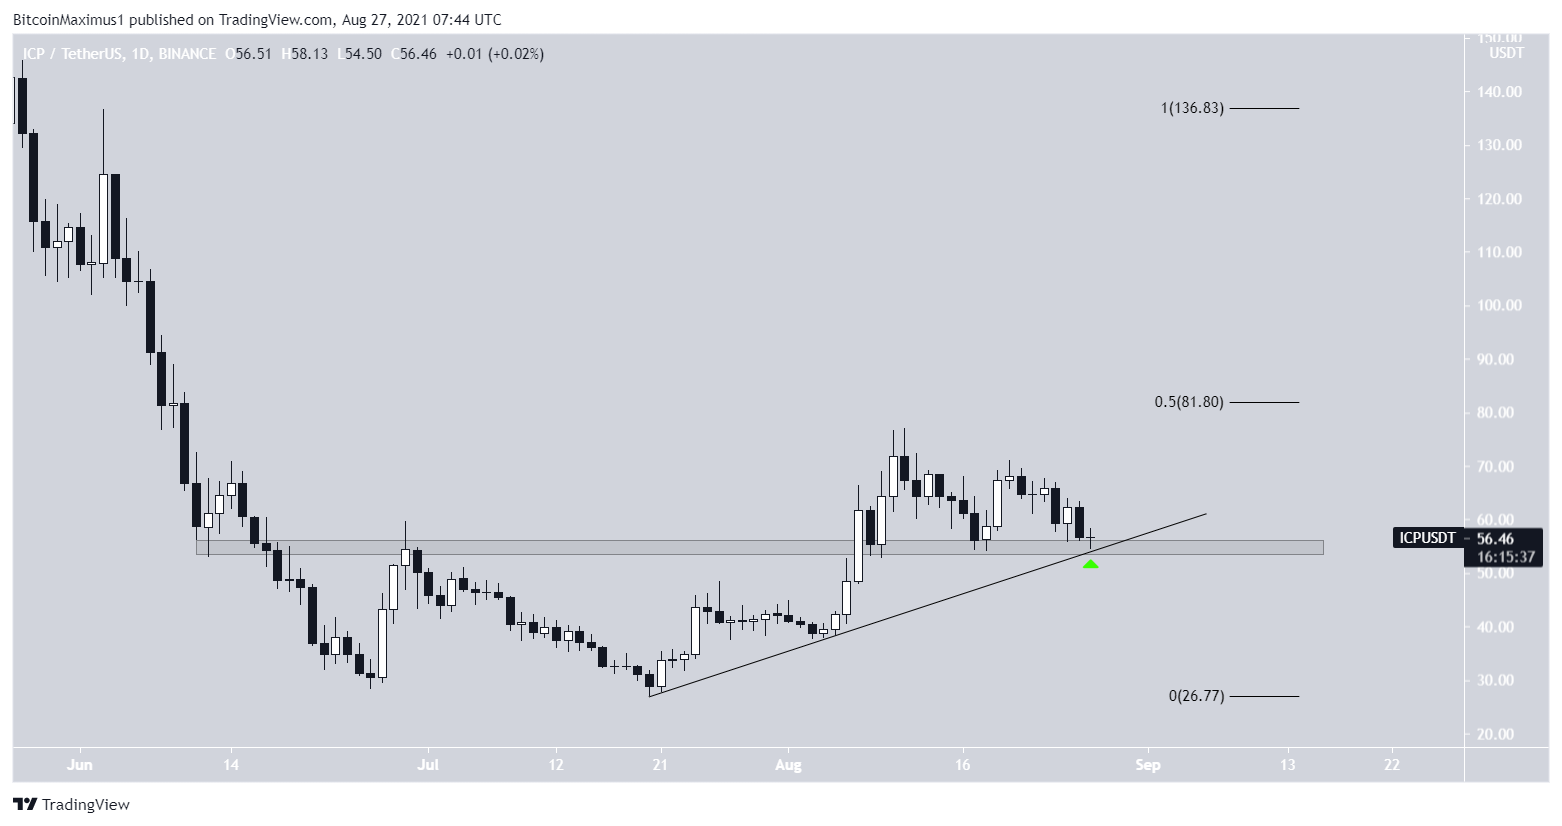
ICP
ICP has been increasing alongside an ascending support line since reaching a low of $26.90 on July 20. On Aug 7, it broke out from the $55 horizontal resistance area and proceeded to reach a high of $77 on Aug 11.
However, it has been moving downwards since then. Currently, ICP is trading at a confluence of support levels, created by the ascending support line and the $55 area, which is now expected to act as support. If the price bounces from the support area, the closest resistance would be found at $82.
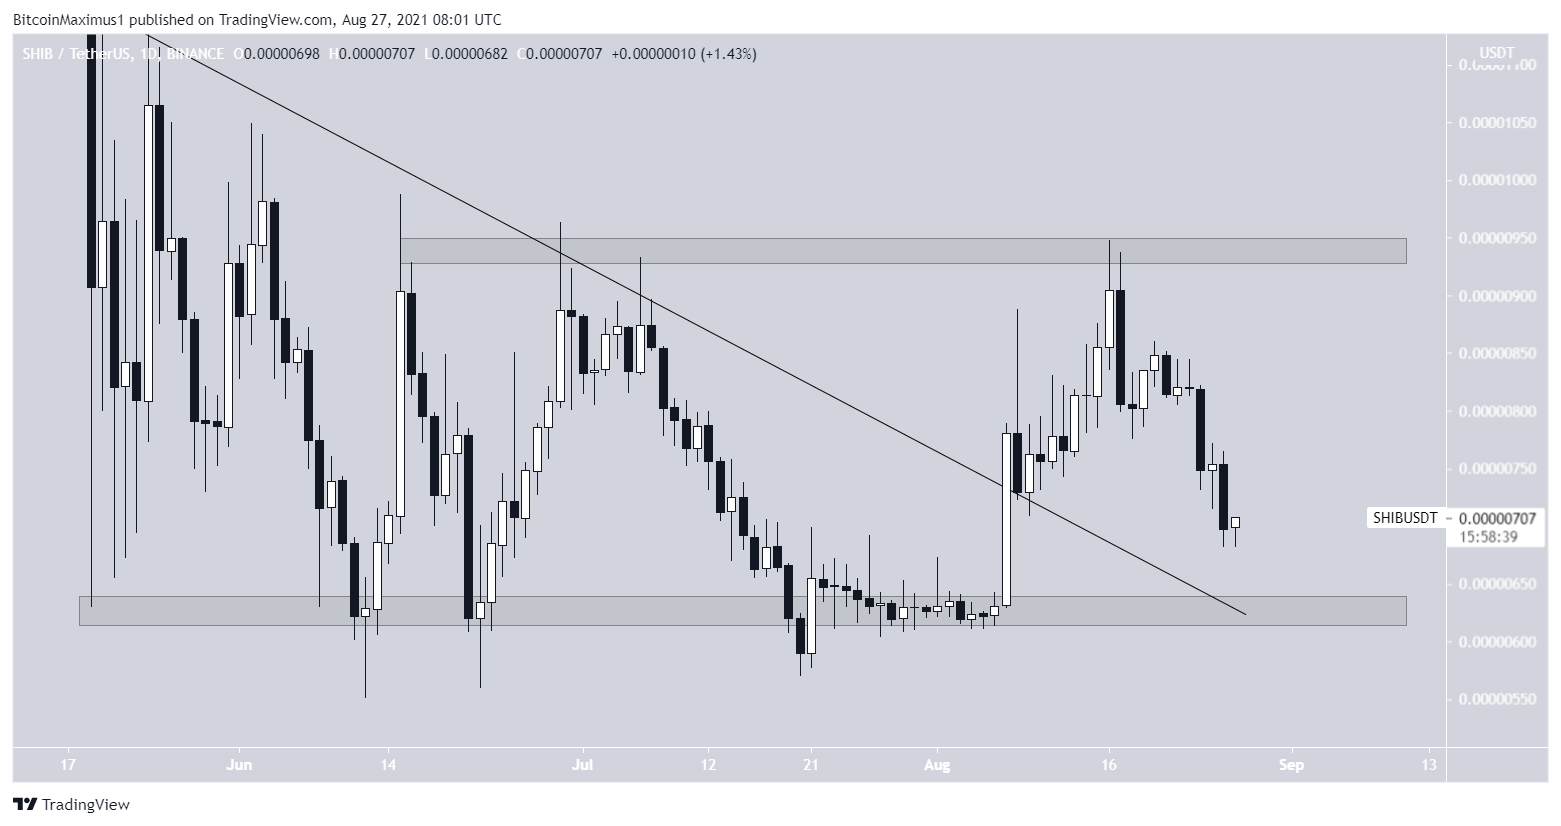
SHIB
Since May 18, SHIB has been consolidating just above $0.00000620. On Aug 7, it initiated an upward move and broke out from a descending resistance line. It proceeded to reach a high of $0.00000948 on Aug 16.
SHIB has been moving downwards since then, and may possibly return to validate the descending resistance line and $0.00000630 area once again. The main horizontal resistance is found at $0.00000950.
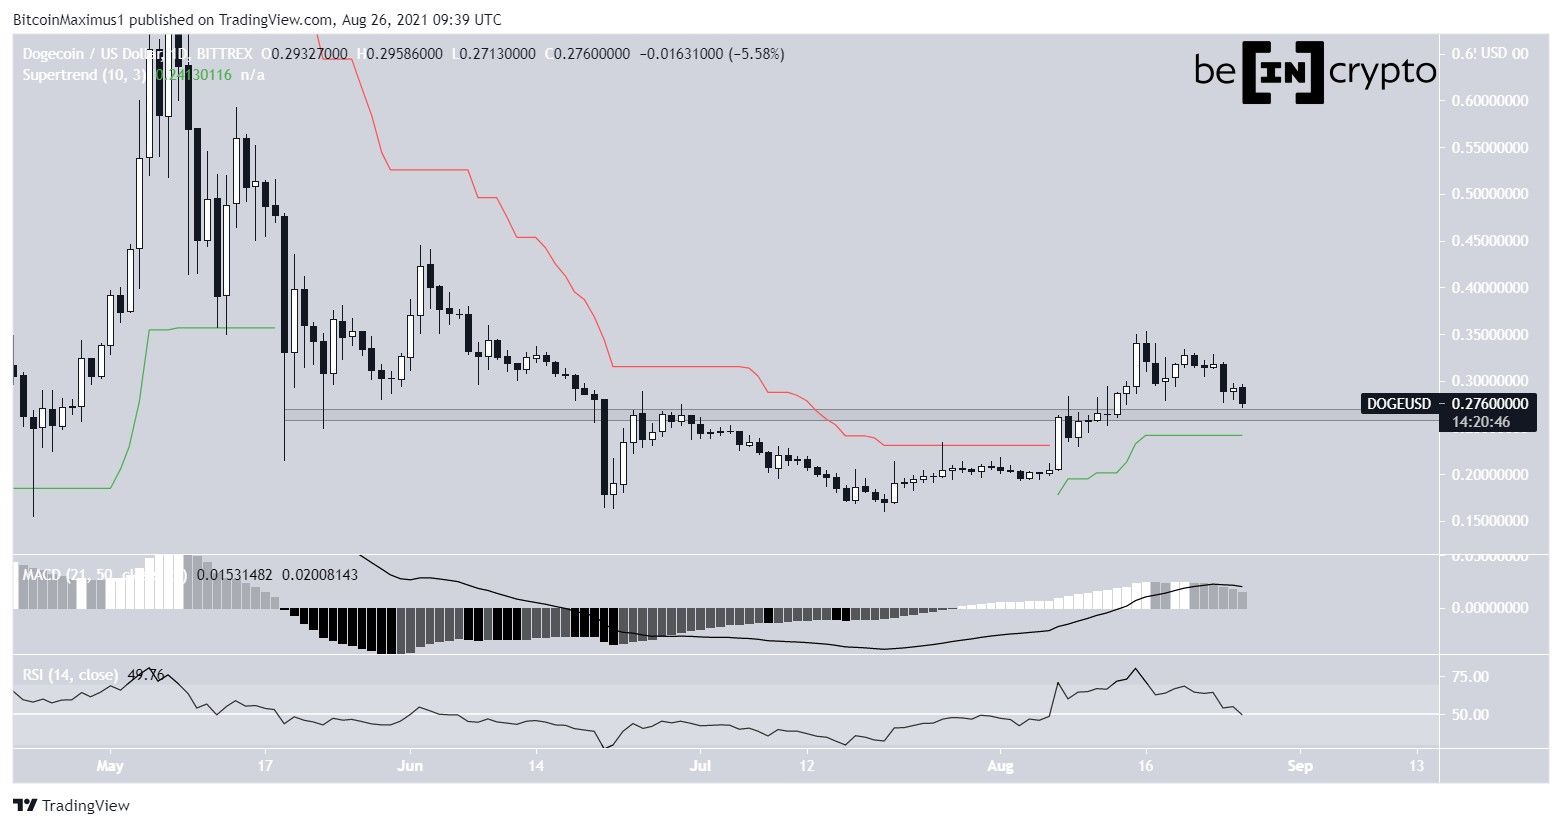
DOGE
DOGE has been increasing since June 22. On July 20, it created a higher low and broke out from the $0.265 resistance area on Aug 11. It then continued moving upwards until Aug 16.
However, DOGE has been moving downwards since then. Both the RSI and MACD are bearish — the former has almost fallen below 50 while the latter has given a bullish reversal signal.
DOGE is attempting to validate the $0.265 area as support. Besides being a horizontal area that previously acted as resistance, this level also coincides with the supertrend support line.
For BeInCrypto’s latest Bitcoin (BTC) analysis, click here.


