


One of the best-known and most effective signals to buy bitcoin (BTC), Hash Ribbons, just turned blue. The indicator has a nearly 100% efficiency, an average return of 4157%, and an average downside risk of -11%.
This article looks at the basics of the Hash Ribbons indicator, its importance, and historical cases of its effectiveness. Additionally, it highlights that the blue buy signal generated could mean that the $30,000 level was a macro bottom for bitcoin. If this is the case, then the price will never fall below this value again.
What is the hash rate?
The Hash Ribbons indicator is based on hash rate. This is one of the most important metrics for the health of the bitcoin network. Simply, hash rate is the amount of computing power that BTC miners are generating at any given time.
Typically, an increase in hash rate and greater effort by miners to mine bitcoin is positively correlated with an increase in price. Also, a decrease in mining costs leads to an increase in the hash rate.
On the other hand, if this indicator decreases, we also see a decrease or stabilization of the BTC price. The activity of miners decreases because the mining of coins becomes less profitable in a given period of time.
The chart below for the past five years shows three situations (in red) in which a significant drop in the hash rate was correlated with deep corrections in the bitcoin price chart.
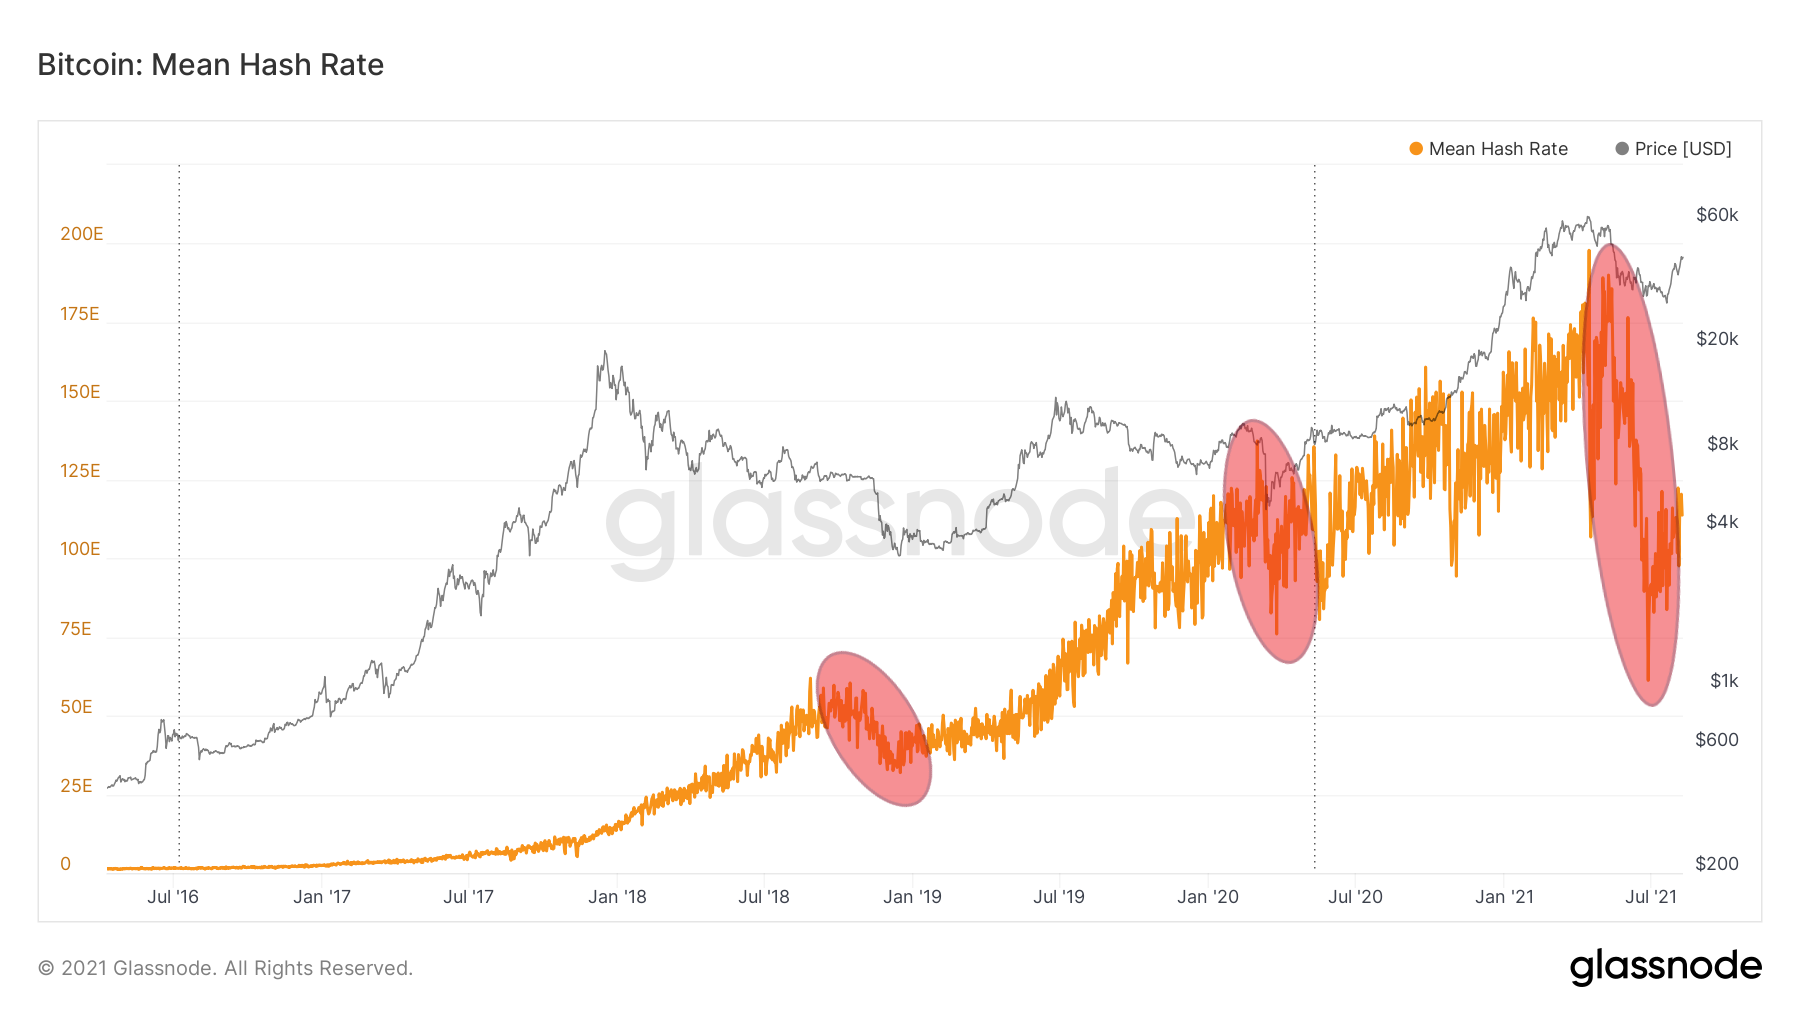
Hash rate chart of BTC by Glassnode
What is Hash Ribbons?
Hash Ribbons is a long-term signal that is used to indicate macro bottoms on the bitcoin price chart. Analysis of its historical effectiveness suggests it is an important indicator for identifying a buying opportunity.
Its creator Charles Edwards describes how it works in an October 2019 article. He calls it “possibly the most powerful Bitcoin buy signal ever.”
Hash Ribbons is based on the ratio between two simple moving averages (SMAs) of the hash rate:
- 30-day SMA
- 60-day SMA
In addition to these moving averages of hash rate, the system adds the 10-day and 20-day SMAs of the bitcoin price. According to Edwards, this helps to increase the precision of the indicator. It also reduces the possibility of the price downdraw to no more than -15% after the signal flashes.
The buy signal from the Hash Ribbons indicator is generated in three stages:
- Miner Capitulation: The 30-day SMA falls below the 60-day SMA, the chart turns red.
- End of Capitulation: The 30-day SMA rises above the 60-day SMA, the green dot turns on, the chart turns green.
- Recovery of BTC price momentum: The 10-day SMA of the Bitcoin price rises above the 20-day SMA, the “buy” dot turns blue.
On the long-term chart of the Hash Ribbons indicator, we can see that the blue “buy” signal has already flashed on a dozen times in the history of BTC. This has always occurred after the end of the Miner Capitulation (red).
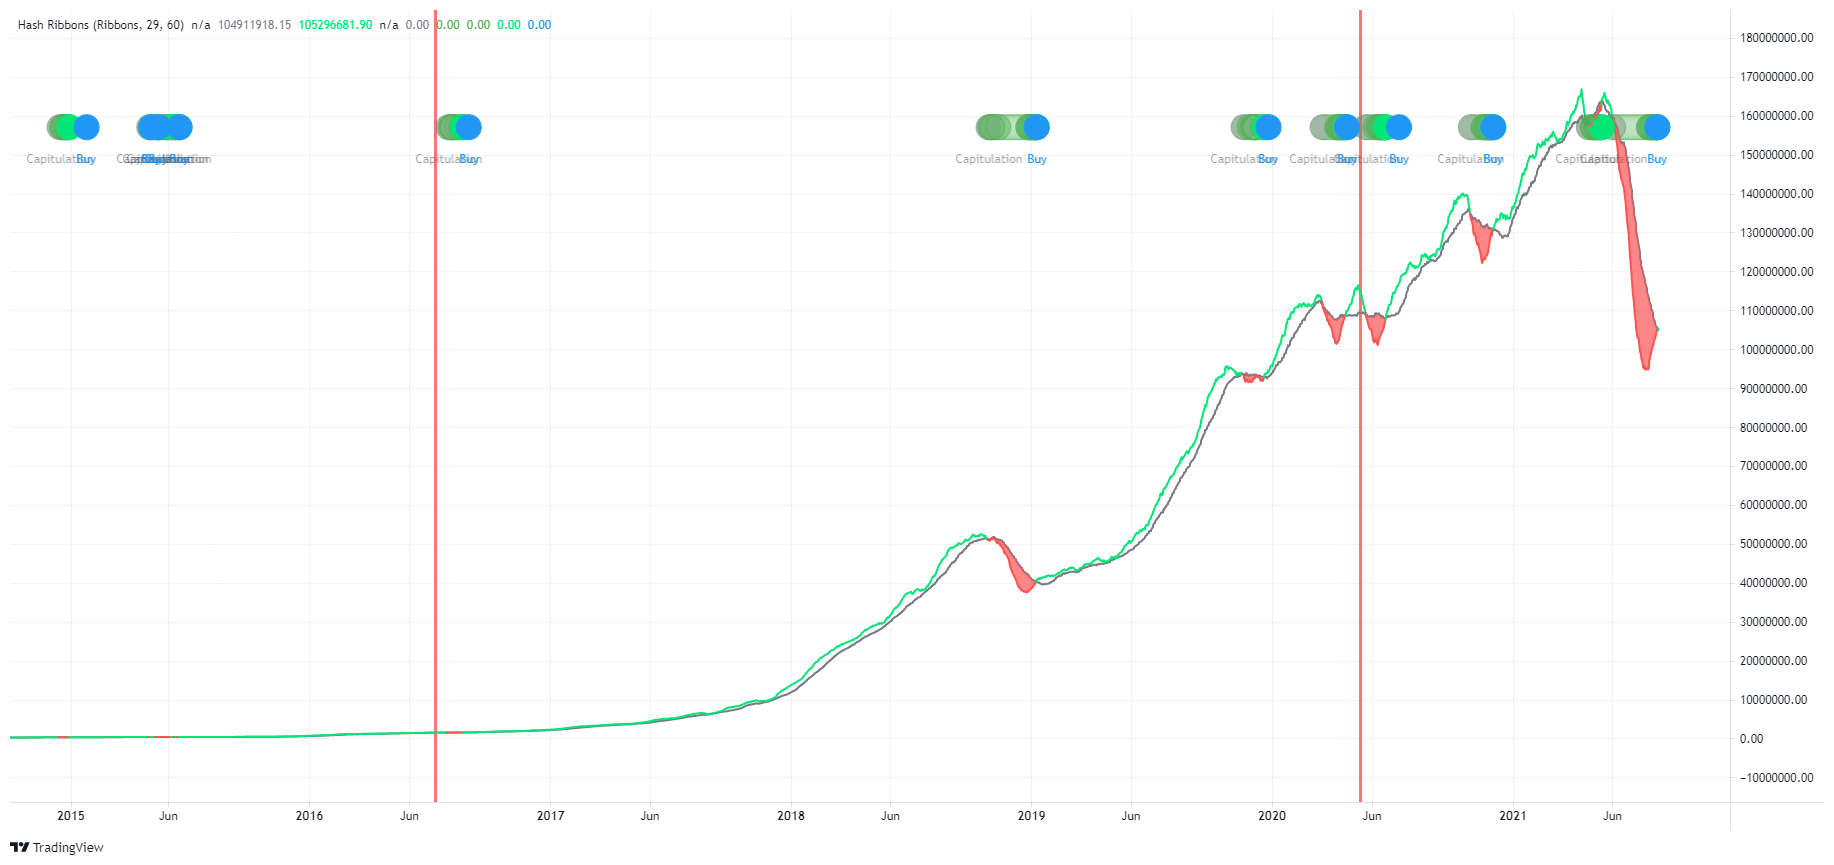
Hash Ribbons chart by Tradingview
The meaning of the blue “buy” signal
To understand the meaning of the Hash Ribbons indicator, it is essential to compare the moments when the “buy” signal flashed with the long-term price action of bitcoin.
The basic interpretation is that the blue dot signals that the higher low printed before it on the daily chart of the BTC price were a macro low in the market.
This means that the daily low before the “buy” signal appeared sets a price to which BTC has never returned in the future.
Analysis of historical signals almost flawlessly confirms this interpretation of the dozen historical blue signals from Hash Ribbons, all but one set macro lows on BTC.
The blue vertical line marks the price action point on BTC, where the dot on Hash Ribbons turned blue. Higher lows on the chart are marked by red circles. The logarithmic chart is used to better illustrate the relative differences in the price of BTC.
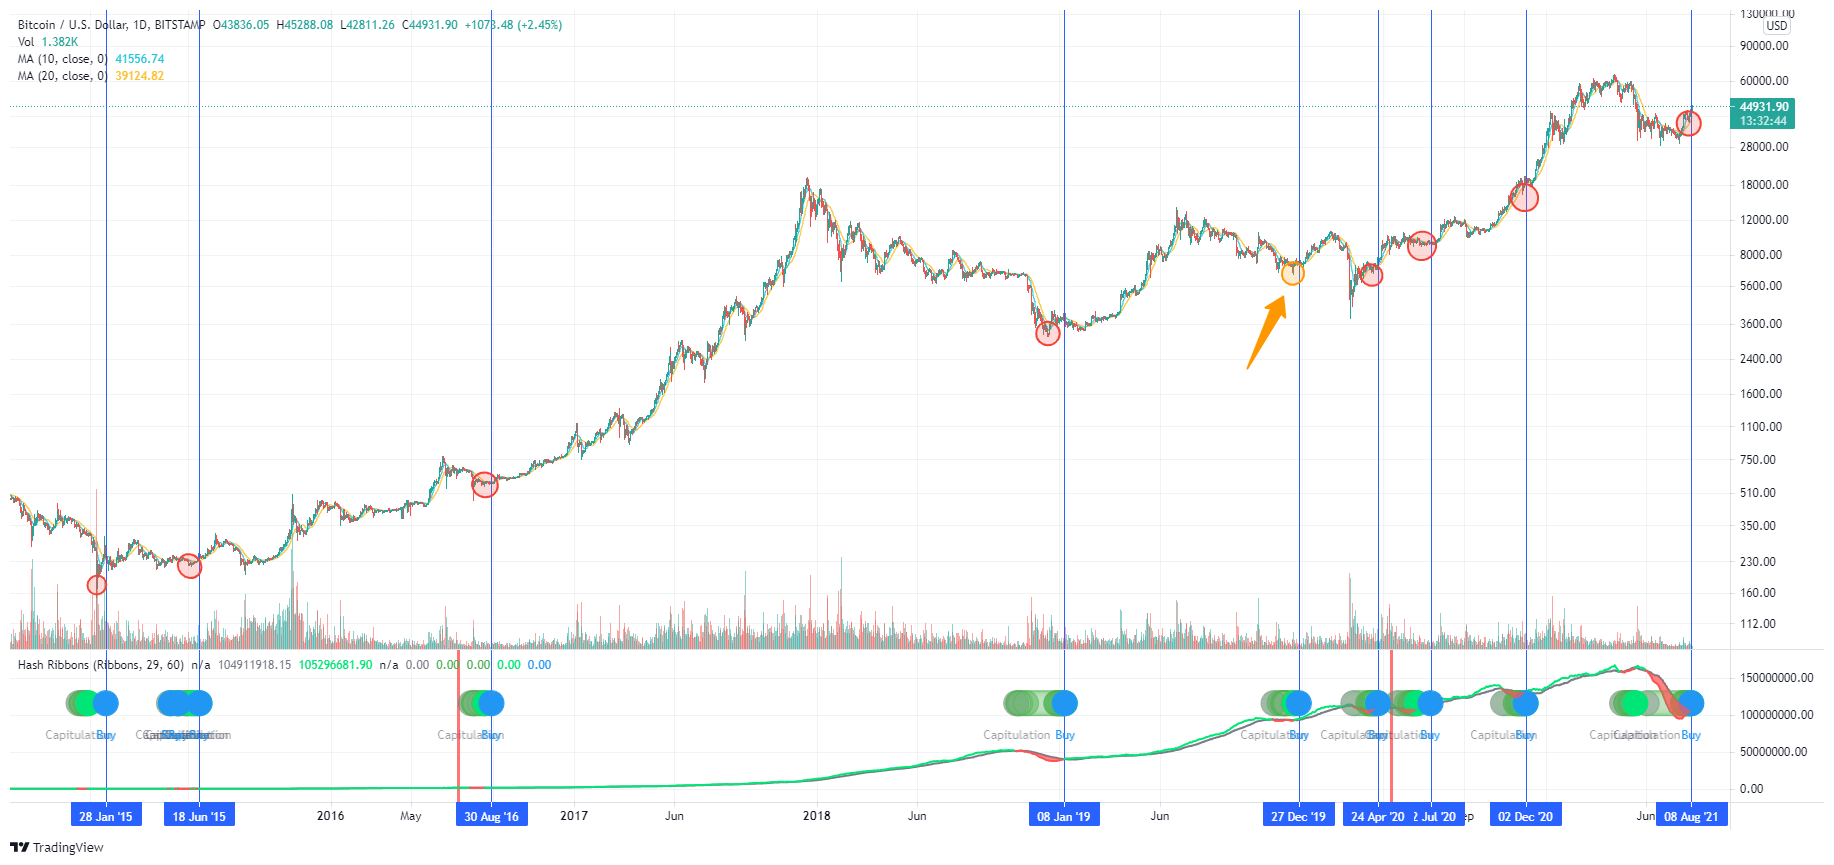
In eight out of nine cases in the history of the Hash Ribbons indicator over the last six years, the bitcoin price had never fallen below the low before the blue dot flashed. The only such situation occurred after the December 27, 2019 signal (orange dot).
Immediately after this signal, bitcoin indeed increased by 64%. However, the crypto market crash due to the COVID-19 pandemic took the price below the value previously set by Hash Ribbons for the very first time.
The average gains are 4157%
If we now look at the increases in the BTC price after the blue dot was generated, each time, the gains are impressive. Without a doubt, the blue dot was proving to be an excellent opportunity for buying the dip.
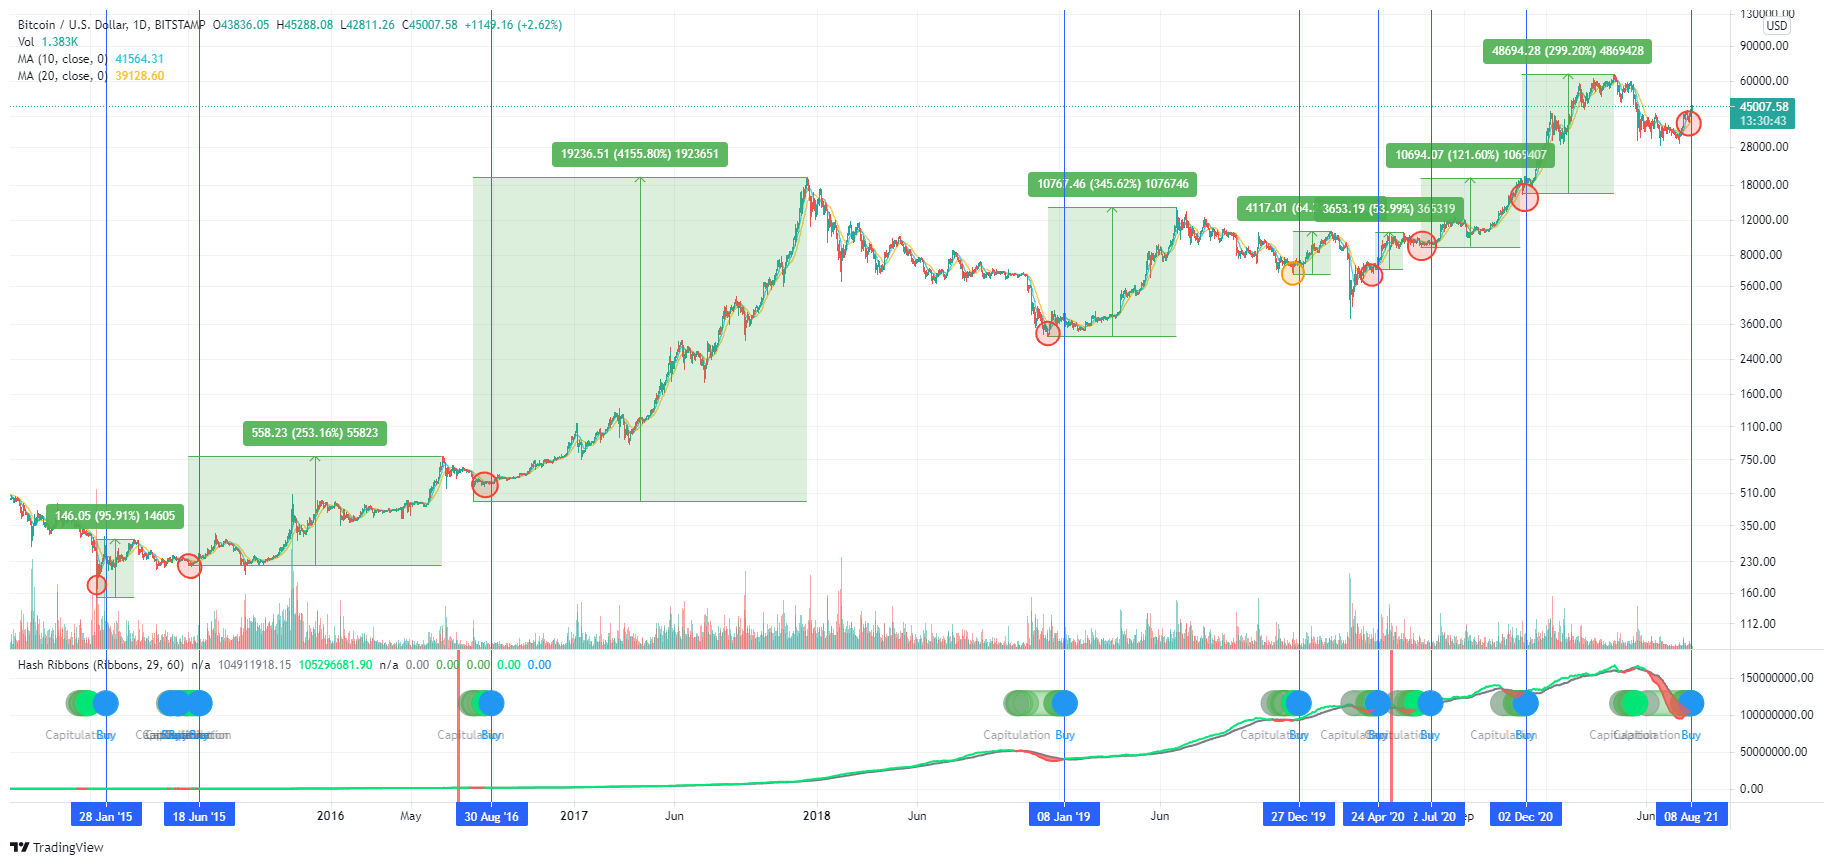
The table below compiles data from all 13 Hash Ribbons signals that have regularly appeared since December 2011. It includes data on both the maximum decline after the appearance of the blue dot (including -45% from the COVID-19 crisis) and the maximum rise measured to the absolute peak.
So with such extreme data, we get the average upside for buying with the Hash Ribbons signal at 4157% maximum gain and only -11% possible maximum loss.
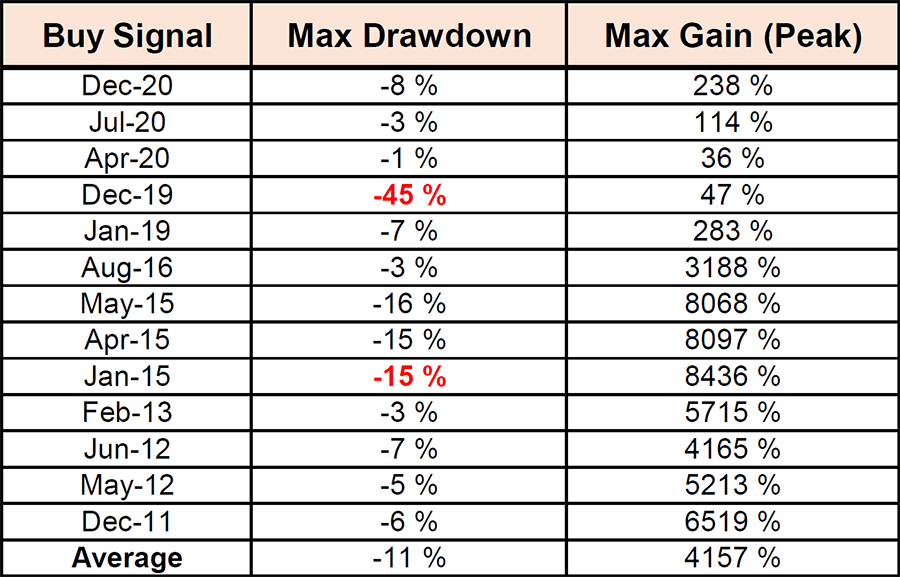
Historical buys for Hash Ribbons / Source: honestcrypto.io
Was $30,000 a macro bottom?
Despite one mistaken blue signal from Hash Ribbons, many cryptocurrency market analysts put a lot of weight on this indicator.
For example, trader and YouTuber Eric Crown claims that a strong indicator of a macro bottom in the BTC market is the confluence of 3 indicators. These are the low volatility of bitcoin, the beginning of an uptrend on the daily chart of BTC, and the very blue “buy” signal from Hash Ribbons.
In a recent article, BeInCrypto pointed out how volatility in the BTC market reached a one-year low at the end of July.
That’s when the BBWP indicator generated a blue minimum volatility signal. Combined with the start of an uptrend – a higher high and a higher low – on the BTC price chart and the blue dot from Hash Ribbons, the conditions mentioned by Crown are in confluence just now.
Does this mean that bitcoin has a straight shot at $100k? Probably not. Could the bottom in the $30,000 area, which served as support from May to July, be the price below BTC will never fall again? Historical data suggests that it might be the case.


