


The TRON price has been increasing since the January 14 breakout. However, the rally has stalled near 205 satoshis — since the price has failed to break through after numerous attempts.
TRON Price Highlights
- The TRX price broke out from a descending resistance line.
- The price is trading above its 200-day moving average.
- There is resistance at 205 and 230 satoshis.
- TRX is trading inside an ascending wedge.
- There is support at 187 satoshis.
Trader @livercoin tweeted a TRX price chart, outlining the range high as the likely target that is likely to be reached by the current price increase.
And we're running $TRX #Crypto pic.twitter.com/kAxHsLgeSk
— Livercoin (@Livercoin) January 28, 2020
Let’s take a closer look at the TRON price and determine if the price will actually get there.
TRON’s Resistance Line
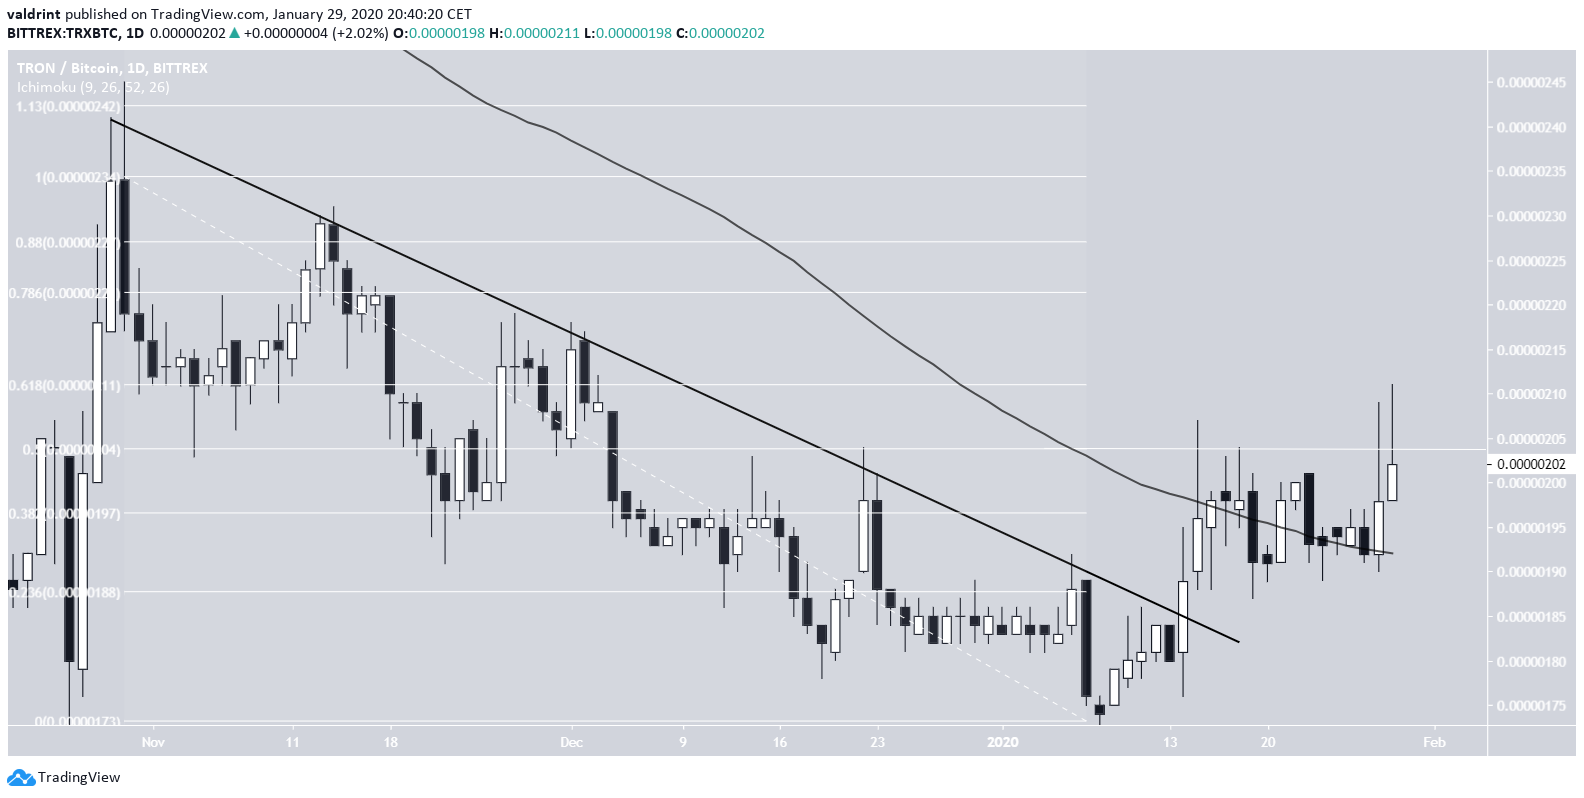
The TRX price broke out from a descending resistance line on January 9. While the increase has continued, the price has struggled to increase above the 0.5 Fib level of the entire downward move — creating several long upper wicks in the process.
On a more positive note, the price has moved above its 200-day moving average (MA) and is seemingly using it as support.
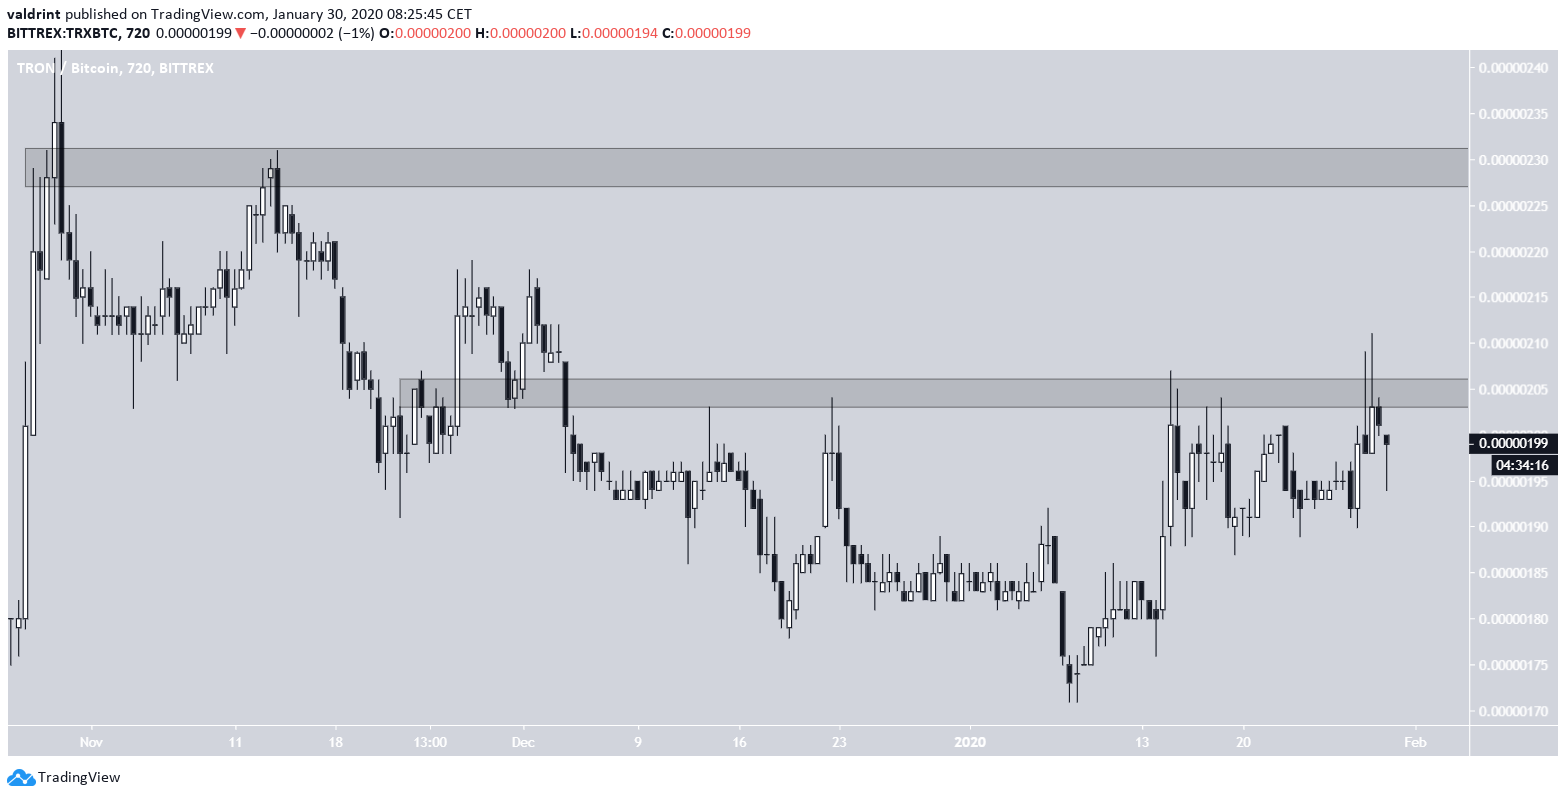
Looking closer at this movement, we can see that the price has been struggling to break out above the 205 satoshi resistance area for quite some time. If it is successful in doing so, it could initiate a rapid increase towards 230 satoshis.
Each time that the price has reached this area it has created a long upper wick and decreased afterward.
Ascending Wedge
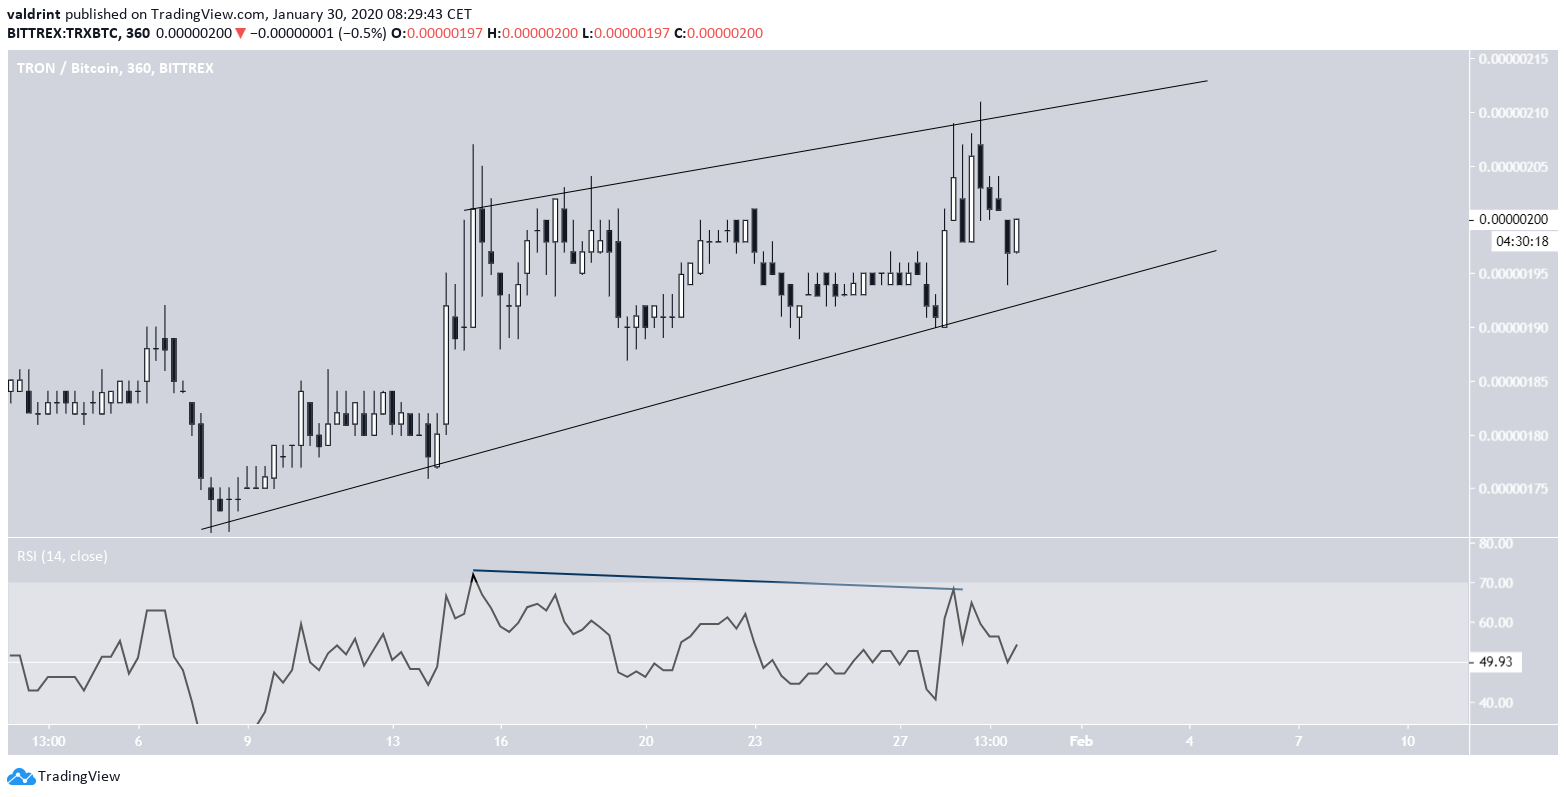
In the shorter-term, the TRON price has created an ascending wedge — which is considered a bearish reversal pattern. This bearish pattern fits with the creation of several long upper wicks since it gives a bearish sentiment.
Furthermore, the RSI has generated bearish divergence and it is struggling to hold on above the 50 line. This suggests that the price is expected to break down.
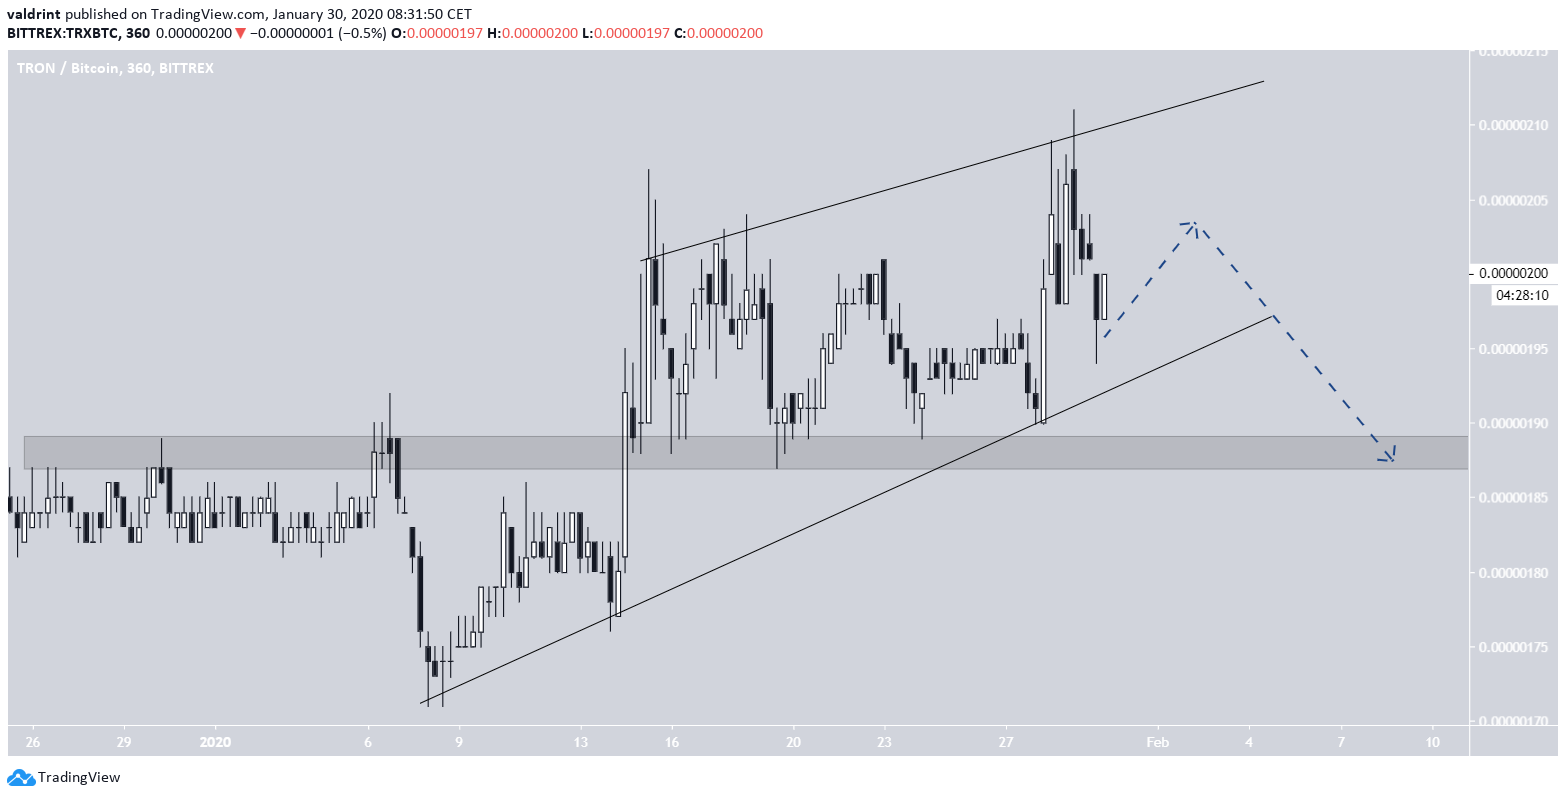
If the breakdown transpires, after possibly another attempt at making an upward move. The closest support area is found at 187 satoshis.
This possible breakdown would also serve to validate the 200-day MA once more, a level from which the TRON price could begin another rally.
Future Movement
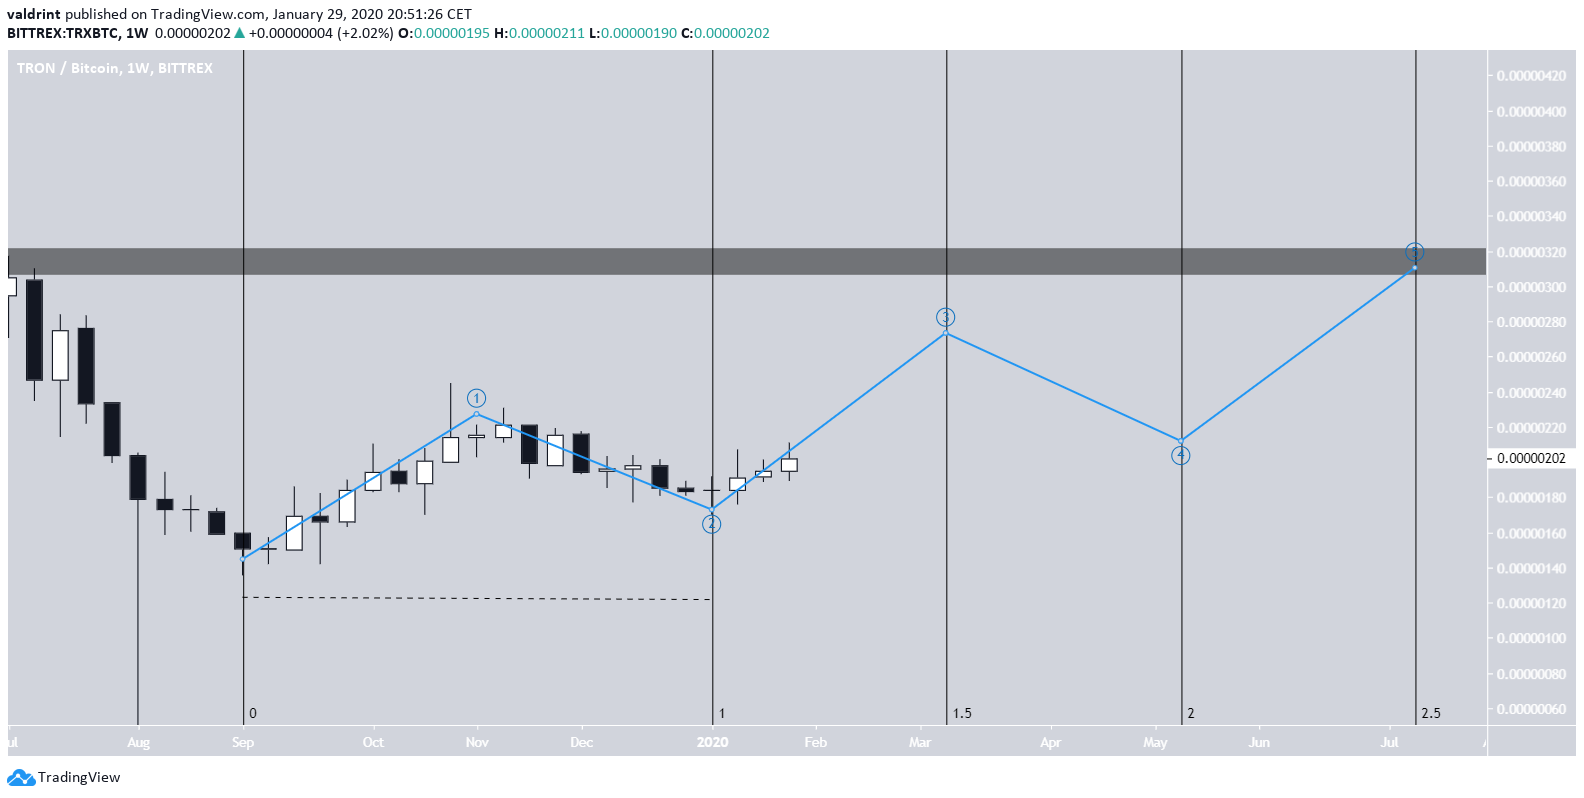
In the long-term, we can make the assumption that the breakout from the channel marked the end of the second wave inside a five-wave Elliott formation.
A possible outline of this movement would take the price near 270 satoshis by the end of the third wave before the final one is completed at 320 satoshis.
Therefore, even though the TRON price could break down in the short-term, this is expected to be a minor decrease inside a larger bullish wave.
To conclude, the TRX price has possibly finished a corrective wave. While a short-term decrease could occur, we expect the price to eventually continue moving towards 270 satoshis.


