


Bitcoin’s ongoing cycle is significantly different from its historical counterparts. Technical indicators, on-chain analysis, market sentiment and investor expectations are often divergent. The various time frames are often in conflict with each other. This is why many analysts have a hard time clearly determining whether Bitcoin is already in a bear market or still in a bull market.
In such a situation, it is helpful to stop looking for analogies with the previous bull markets of 2012-2013 and 2016-2017. While agreeing with the working hypothesis that this market is different from the previous ones, it is important to focus on the recent history of the BTC price. It turns out that comparing the current correction with the declines of the summer of 2021 provides the most clues about the current health of the market.
In the following analysis, BeInCrypto looks at the fractal similarities between the current BTC price action and the May-July 2021 correction. Smooth, rounded peaks and bottoms, multistep price extremes, or psychologically similar loss realization on dips are just some of the similarities. The analysis provides several arguments that a bottom has already been reached and Bitcoin may soon initiate an uptrend.
Bitcoin price action
Bitcoin reached an all-time high of $69,000 on November 10, 2021. Since then, the largest cryptocurrency has been falling and saw a bottom at $32,917 on January 24, 2022. This represents a decline of 52%.
The rebound so far has been relatively small. The corrective upward movement did not even reach the 0.382 Fib retracement level and ended at $45,821.
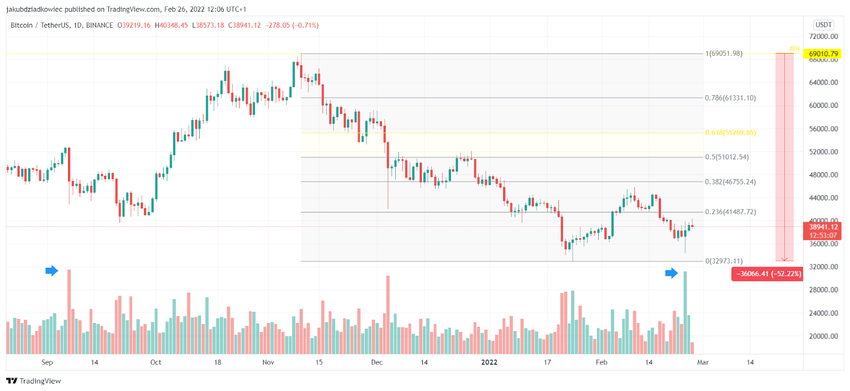
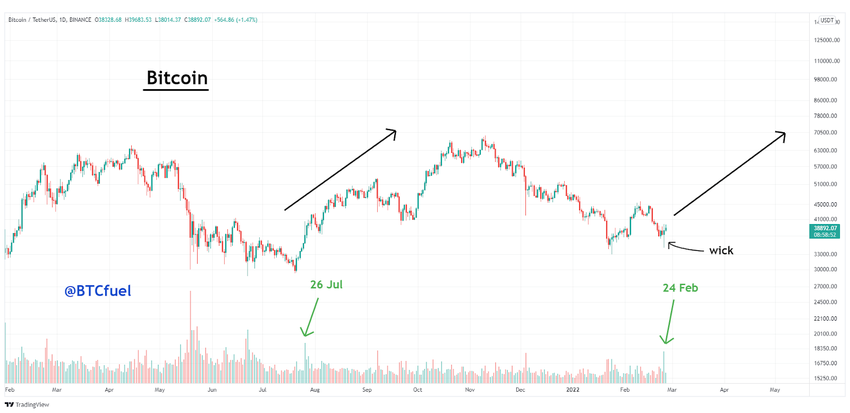
One month later, on February 24, Bitcoin reached a higher low of $34,322 and left behind a 9% lower wick. Moreover, the rebound was confirmed by an increase in volume, which reached its highest level since September 7, 2021 (blue arrows).
The significance of this price rebound and spike in volume was pointed out by analyst @BTCfuel. In a chart posted on Twitter, he saw a parallel with July 2021 and the beginning of the upward movement that ended the previous correction.
Similarities to the summer 2021 correction
Indeed, the structure of the current correction is showing more and more fractal similarities to the summer 2021 correction. At that time, Bitcoin reached a historic ATH of $64,854 on April 14. After that, there was a sharp decline that took BTC to a macro low of $28,805. The entire decline reached a size of 55% and was relatively larger than the current one.
Looking at the long-term chart of BTC going back to early 2021, we see analogous price action. Both Bitcoin’s peaks (blue) and lows (orange, dashed) were not determined by one-off events.
Reaching extreme prices occurred in stages that resembled Wyckoff distribution/accumulation phases. Thus, the BTC chart generated – unlike in previous cycles – gently rounded structures rather than sharpened tops/bottoms.
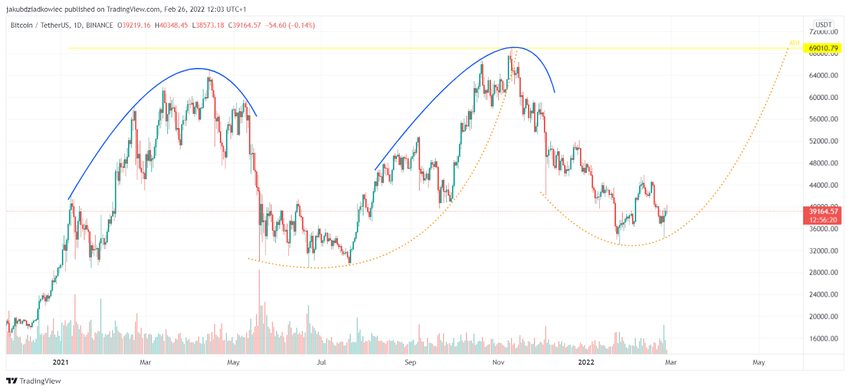
In the perspective of the current correction, it is possible that the higher low generated 2 days ago is the beginning of the next uptrend (orange, dashed). Therefore, if the fractal similarities between the two corrections are maintained, this could be a likely scenario for future events.
Three stages of BTC bottom formation
Taking a closer look at the structure of the ongoing correction, one can see a number of similarities with analogous events in 2021. Obviously, the most parallels can be seen with the summer 2021 correction, but other, smaller corrections also have some similarities in the stages of a bottom formation.
The aforementioned @BTCfuel tweeted another chart of BTC in which he points out the 3 stages of gradual bottoming. According to him, each of the 2021 corrections was characterized by 3 phases:
- Big red candle with long wick
- Big full body red candle followed by correction low
- Higher low
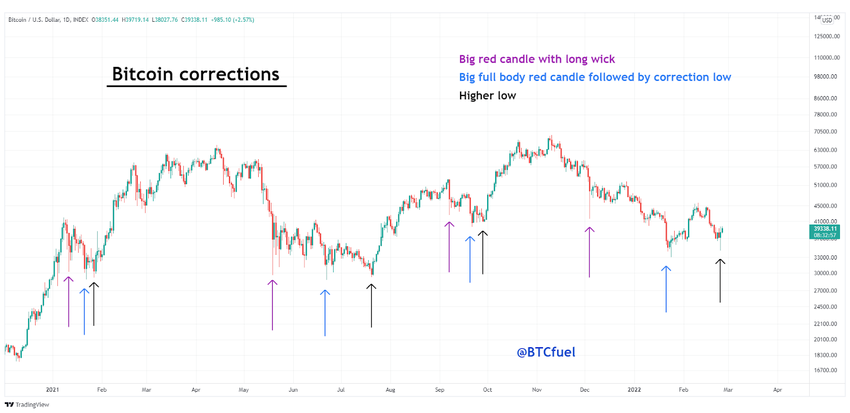
Indeed, this outlook remains consistent with our analysis in the previous section. It suggests that a higher low could signal the end of the correction and the beginning of Bitcoin’s upside. In a comment on this tweet, another crypto market analyst @TheRealPlanC wrote:
“A lot of you are probably thinking, because of the macro climate, these patterns are no longer relevant or valid. Time will tell…”
Realized loss suggests end of correction
An additional argument for the thesis of the end of the current Bitcoin correction is provided by one of the on-chain indicators: Realized Loss. It also shows parallels between the current behavior of investors selling at a loss and the events of the summer of 2021.
On-chain analyst @OnChainCollege tweeted a chart of the Realized Loss indicator, highlighting the structural similarities. Furthermore, looking for reasons for the analogies, he wrote:
“Might be a coincidence. Or it might be a pattern of human psychology during a period of prolonged loss.”
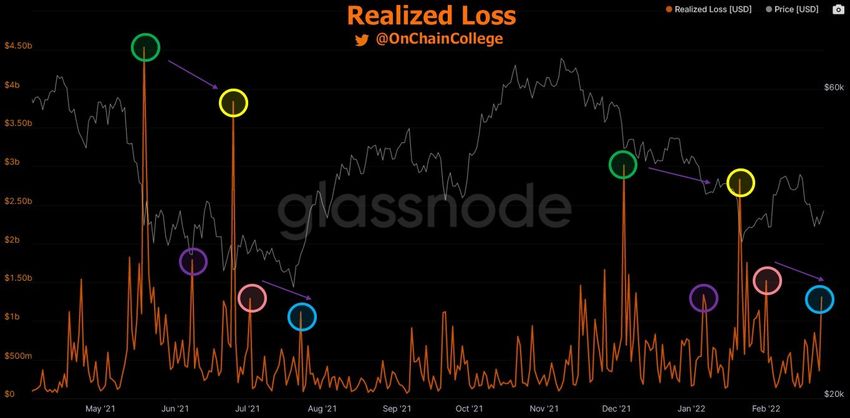
On the chart, we can see that in both cases there were two waves of increased volume selling at a loss (green and yellow). These were followed by two smaller waves (pink and blue), with the second wave completing the correction. Further, there was a large increase in the Bitcoin price, with realized losses returning to their minimums.
For BeInCrypto’s latest Bitcoin (BTC) analysis, click here.


