Harmony (ONE) could confirm its bullish reversal with a breakout from the current descending resistance line and the $0.287 resistance area.
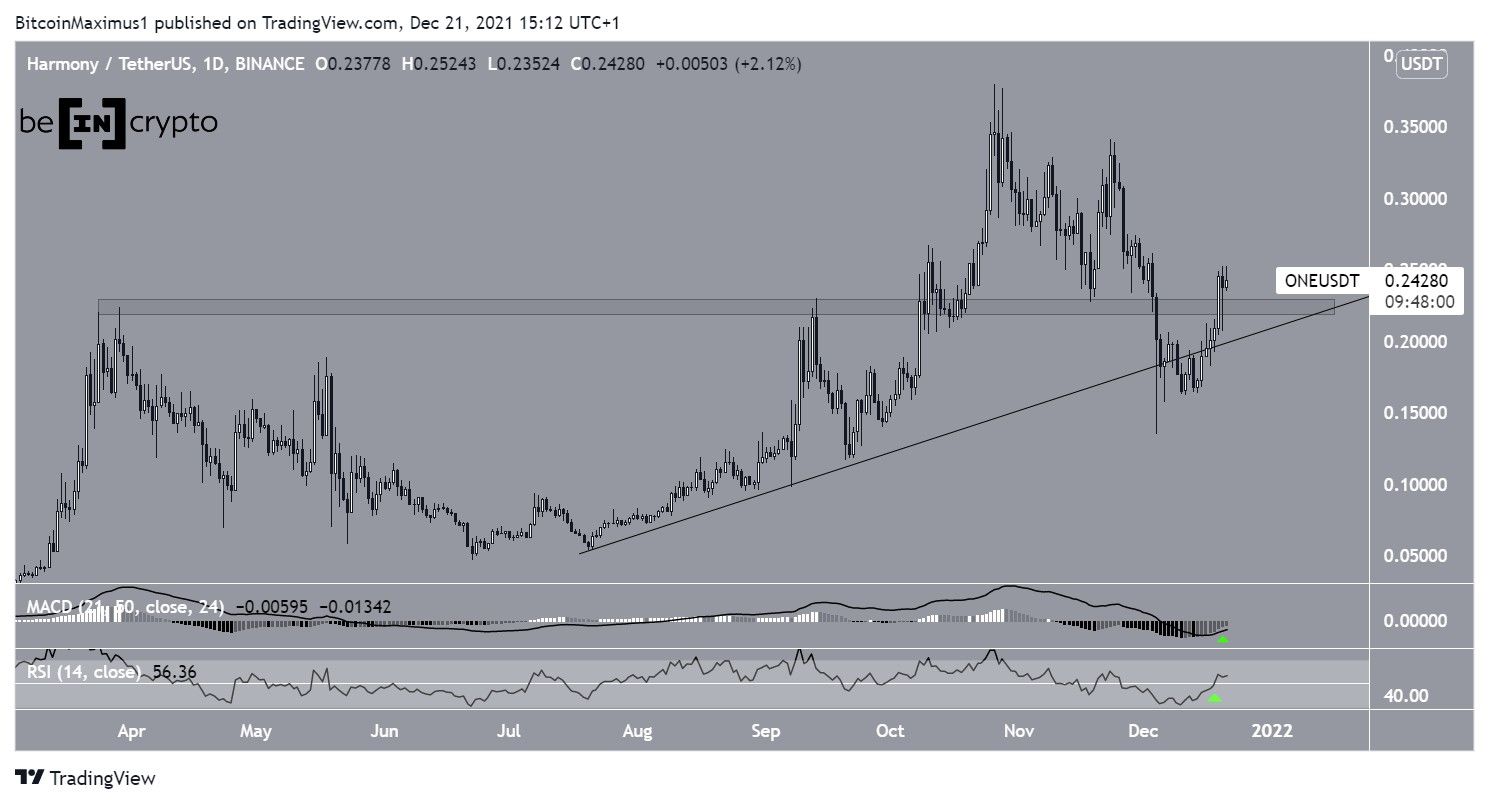
ONE has been decreasing since reaching an all-time high price of $0.38 on Oct 26. The downward move led to a local low of $0.233 on Dec 4.
A significant bounce followed and ONE reclaimed both the ascending support line and the $0.225 horizontal area.
Such reclamations are considered bullish developments and often precede further significant upward moves. The fact that the $0.225 area previously acted as the all-time high resistance further supports this possibility.
Technical indicators have also turned bullish.
The MACD, which is created by short and long-term moving averages (MA), is moving upwards and is nearly positive. This means that the short-term MA is moving at a faster rate than the long-term average.
The RSI, which is a momentum indicator, has just crossed above 50. Movements above the 50-line are often considered to be a sign of a bullish trend.
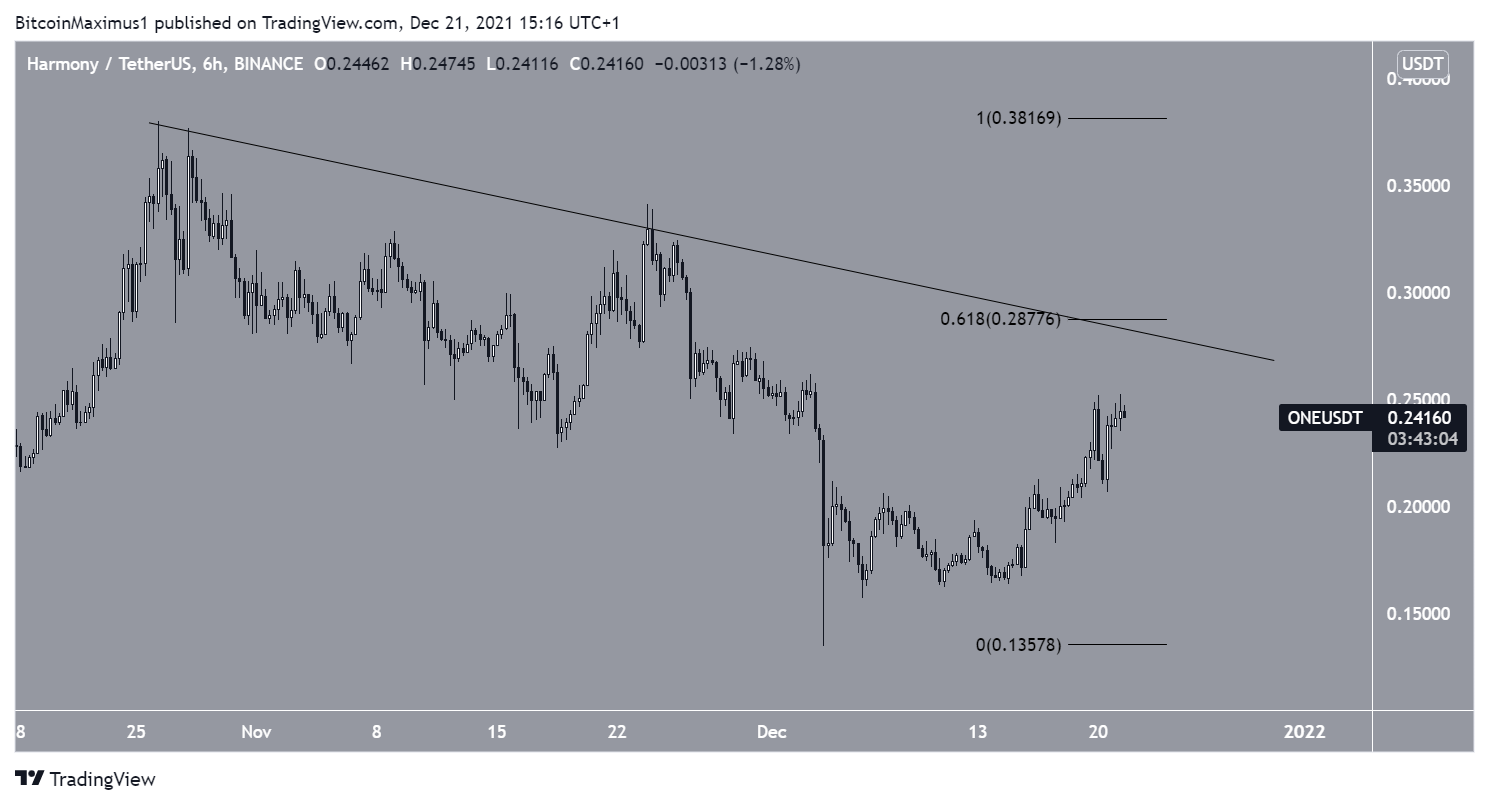
Short-term movement
The six-hour chart shows that ONE has been following a descending resistance line since the aforementioned all-time high price.
The line currently coincides with the $0.287 resistance area, which is created by the 0.618 Fib retracement resistance level. A breakout above this resistance it is required in order for a bullish reversal to be confirmed.
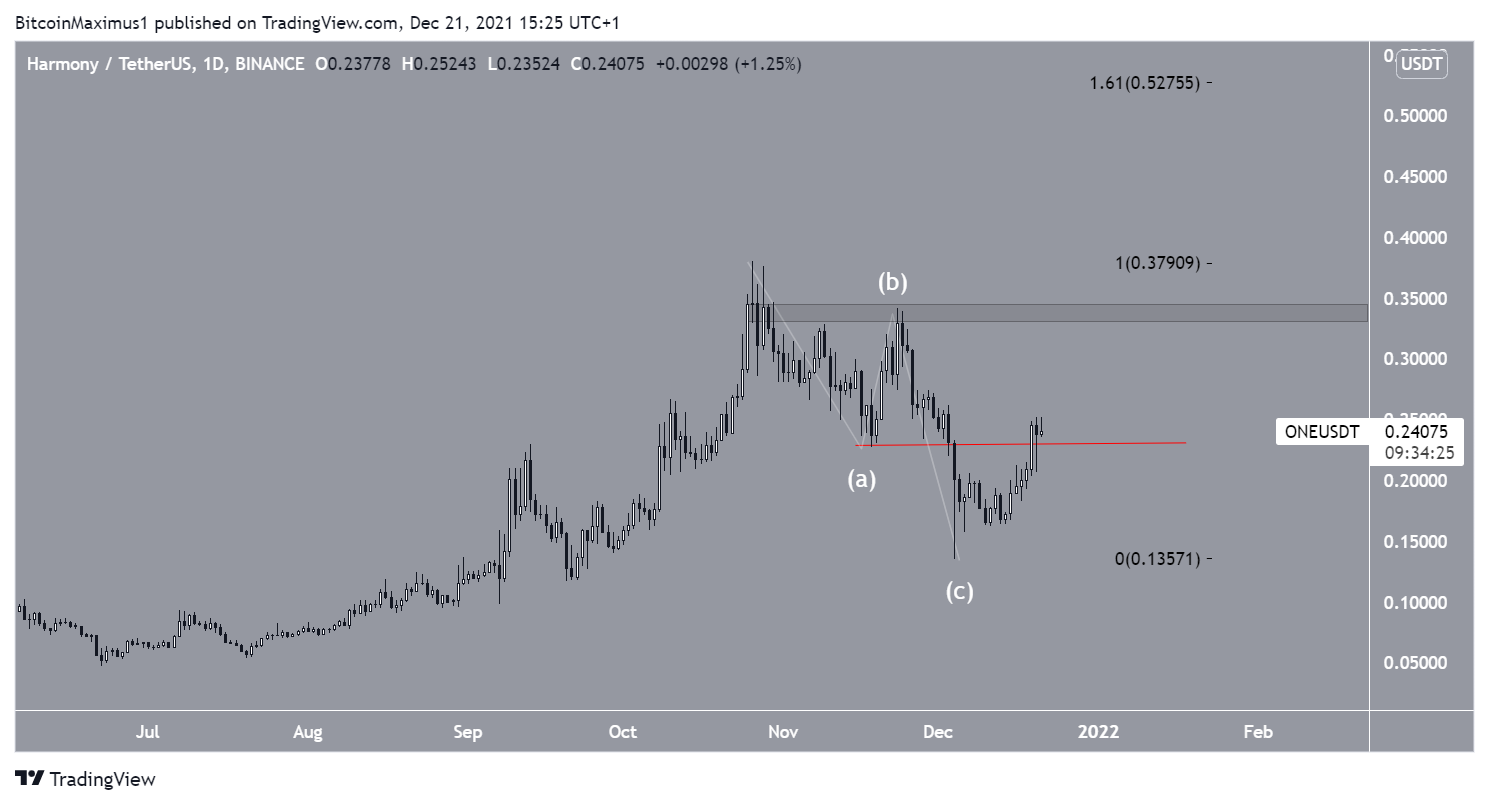
ONE wave count
Due to the overlap between the Nov 18 low and Dec 19 highs (red line), it seems likely that the decrease was part of an A-B-C corrective structure. This means that the correction is complete and ONE will continue moving upwards.
The closest resistance area is found at $0.328, just below the current all-time high price. If ONE is successful in moving above it, the next resistance would be found at $0.527. This target is the 1.61 external Fib retracement resistance level.
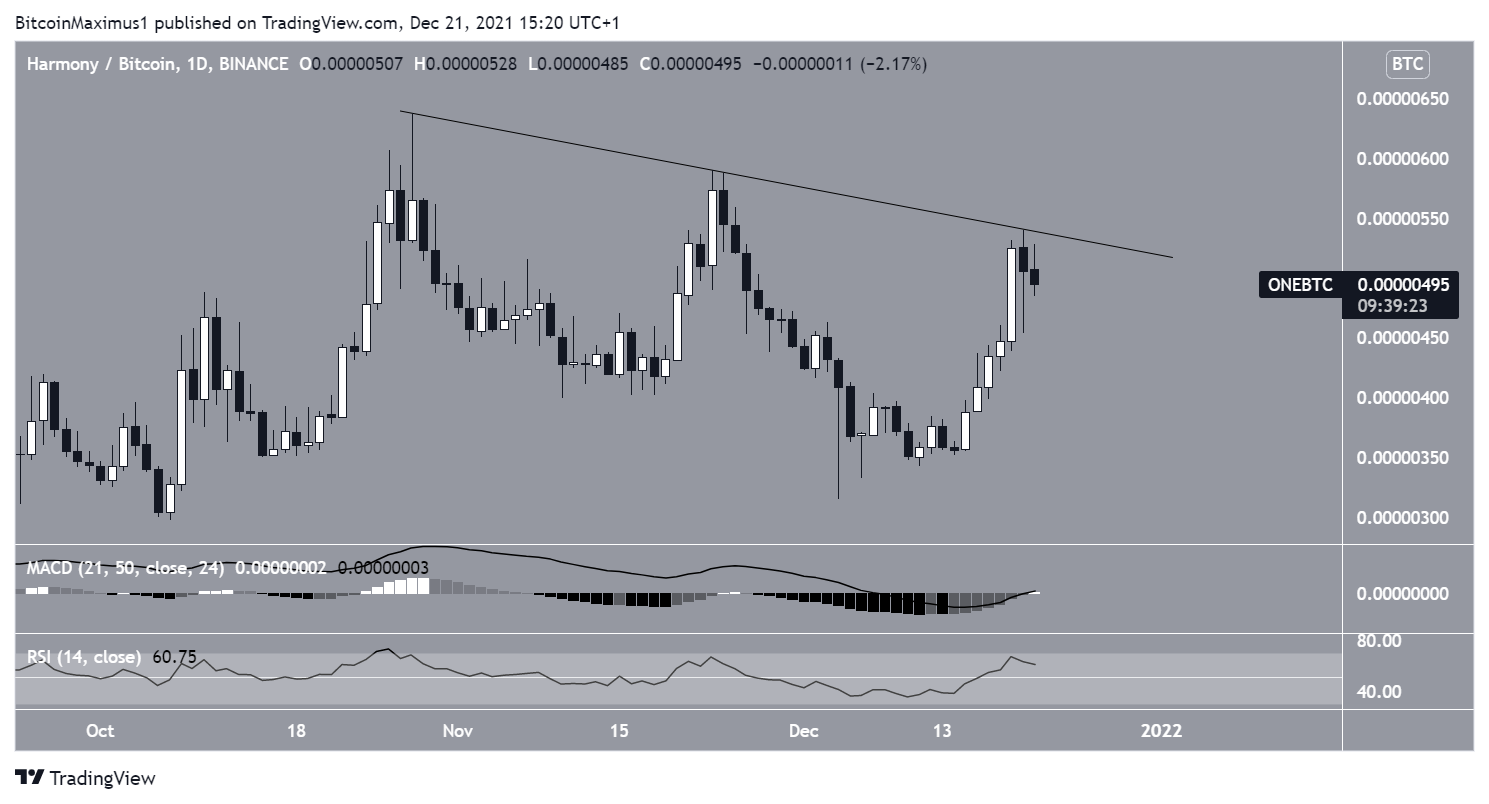
ONE/BTC
Cryptocurrency trader @CryptoNTez tweeted a ONE/BTC chart, stating that the pair could increase towards 520 satoshis.
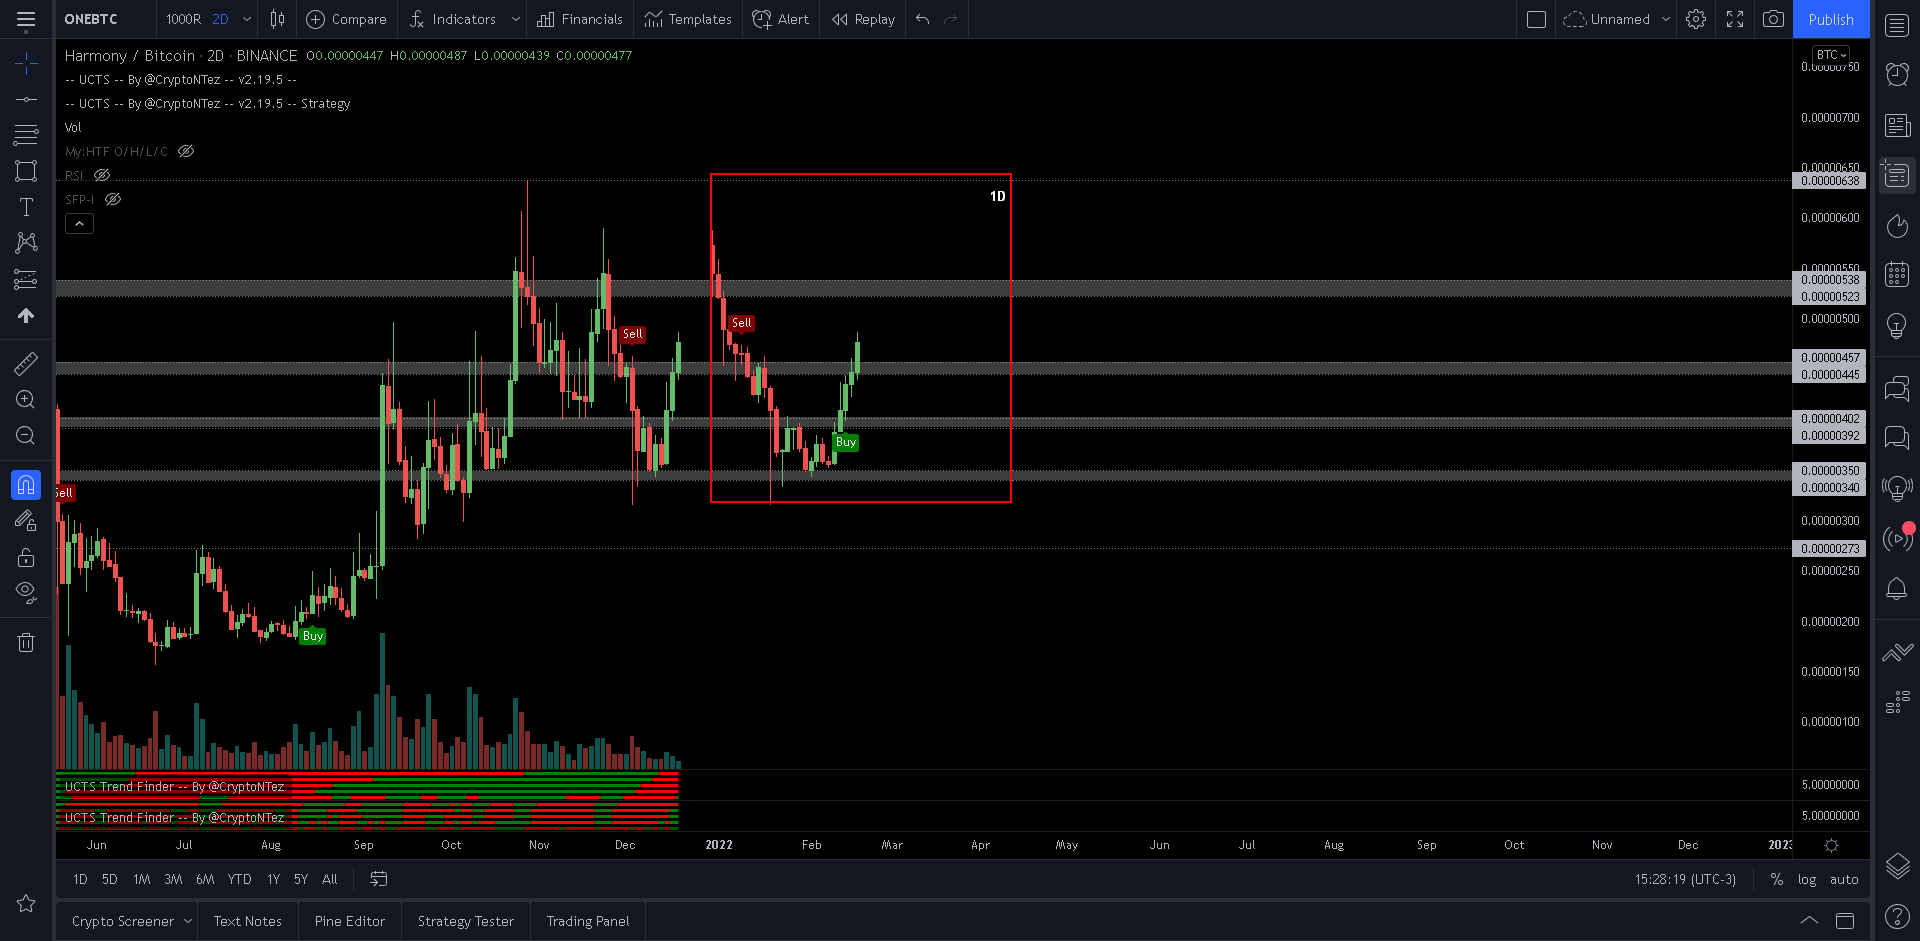
ONE/BTC is also following a descending resistance line that’s been in place since the all-time high.
Similar to the USD pair, the MACD and RSI are both bullish. Therefore, a breakout from the line and an eventual new all-time high is likely.