


Harmony (ONE) is trading in the lower portion of a corrective pattern. It has not yet shown any clear signs of a potential bullish reversal.
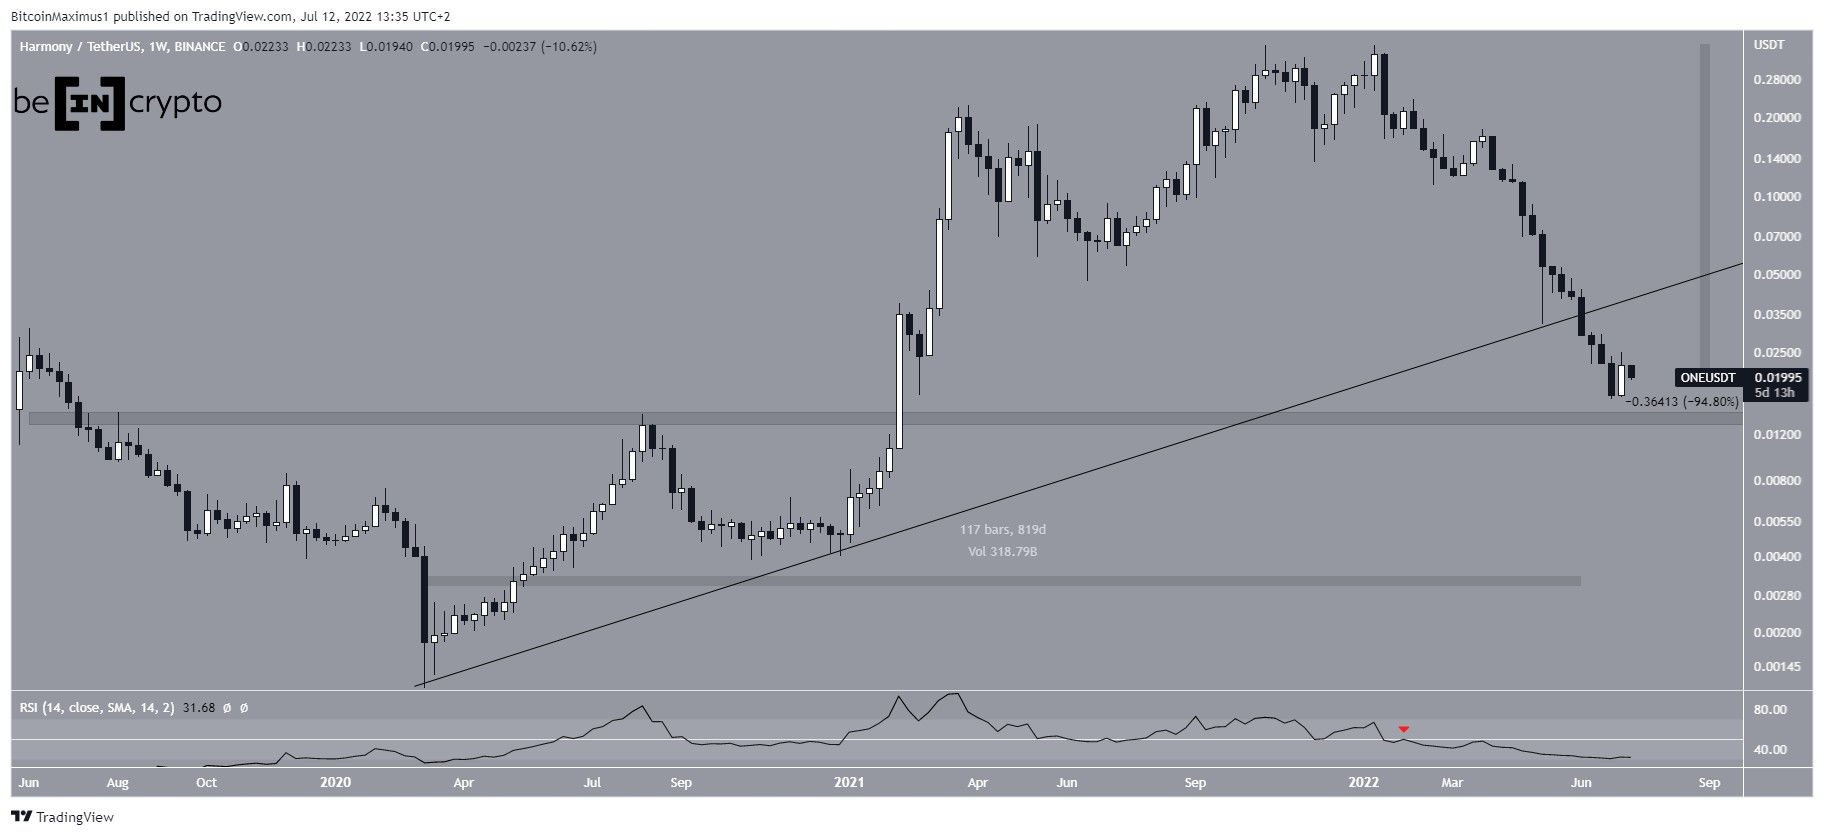
ONE has been falling since reaching a high of $0.38 in Oct 2021. The downward movement has so far led to a low of $0.0164 in June. Moreover, the downward movement caused a breakdown from an ascending support line that had previously been in place for 819 days.
Such long-term breakdowns often indicate that the preceding trend has come to an end. Measuring from the all-time high, the price has fallen by 95%.
The weekly RSI is also below 50 (red icon) and decreasing, in what is seen as a sign of a bearish trend.
The closest horizontal support area is at $0.014, created by the previous resistance from July 2020. The area is now expected to provide support.
Potential breakout
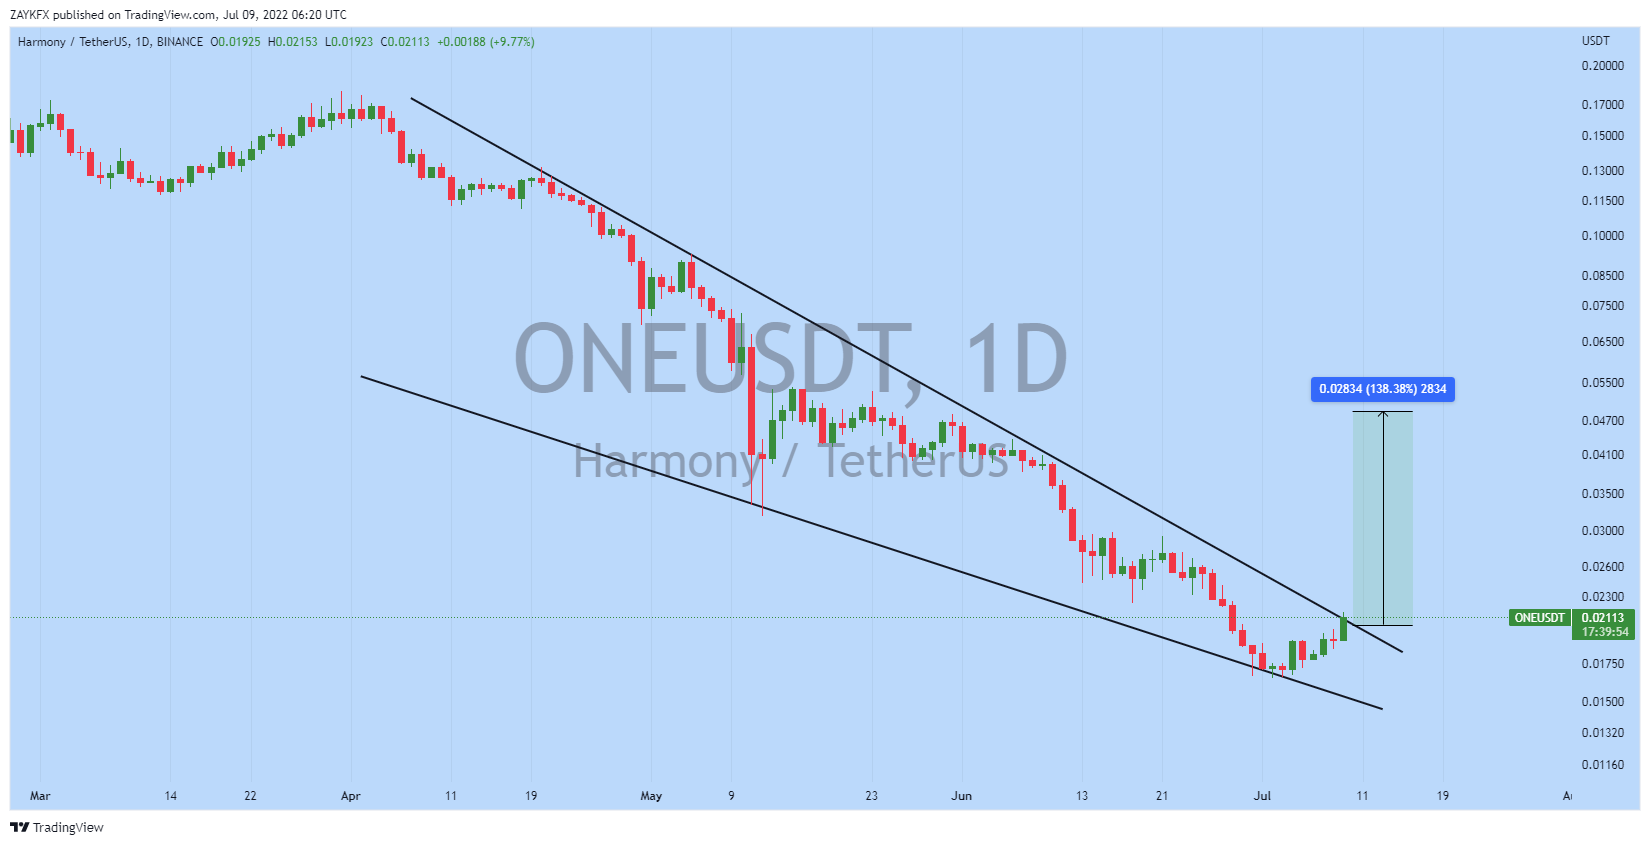
Cryptocurrency trader @ZAYKCharts tweeted a chart of ONE, stating that a breakout from the current pattern is likely.
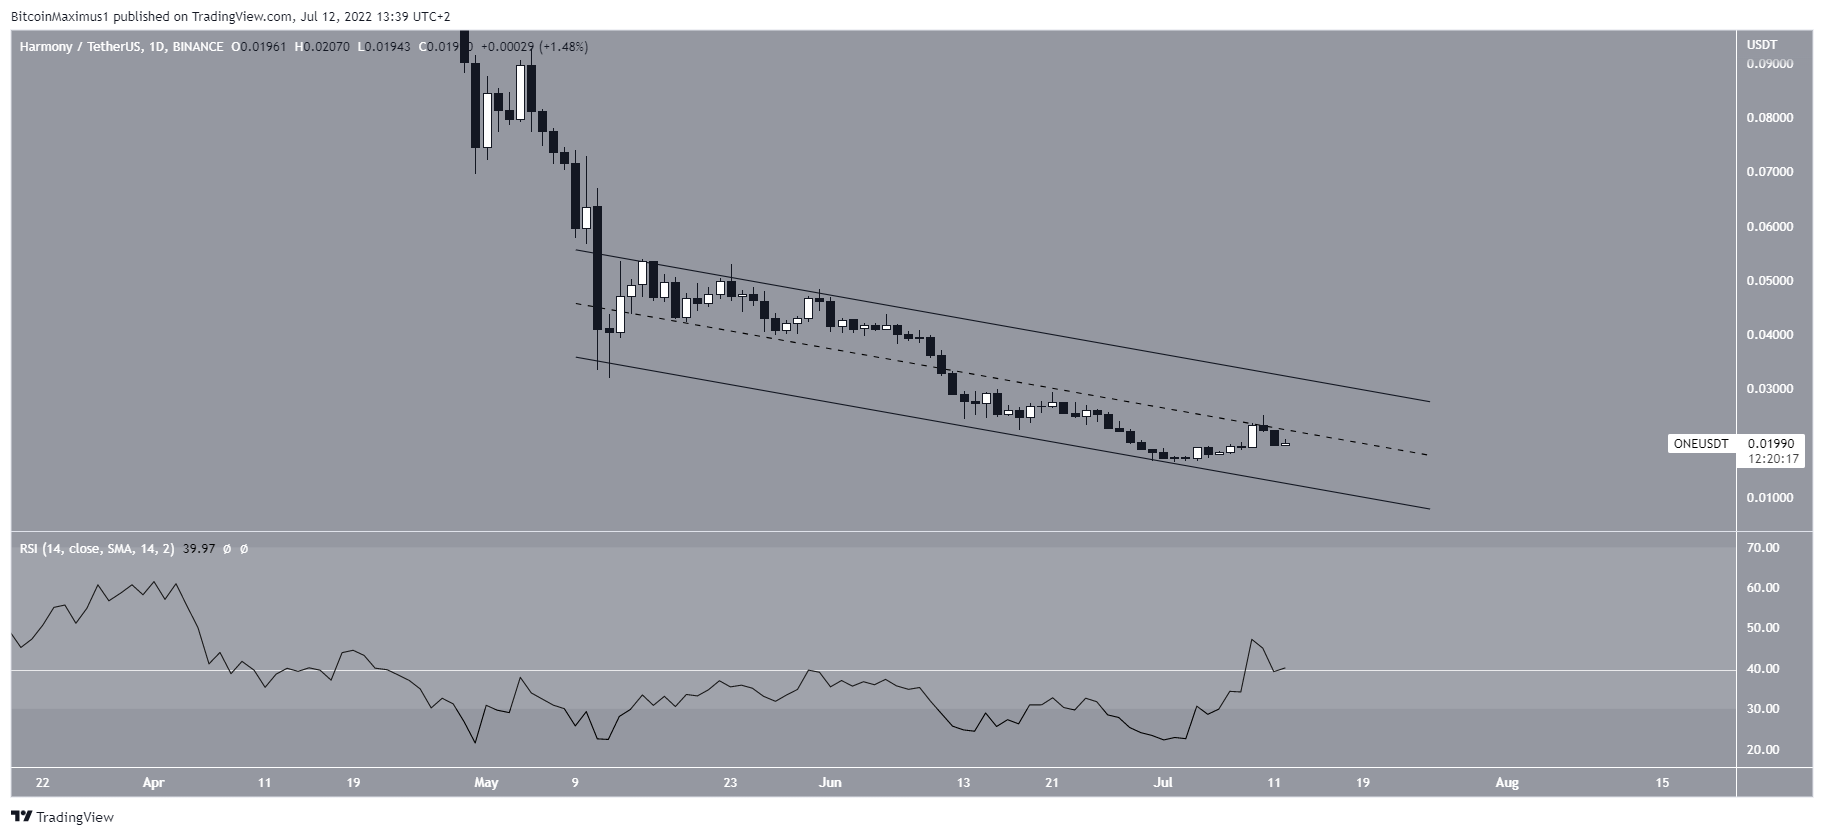
The daily chart does provide a slightly more bullish outlook, since it shows that the price has been trading inside a descending parallel channel since May 12. Such channels usually contain corrective structures, making a breakout likely.
However, the price is still trading in the lower portion of the channel, suggesting that a bullish reversal has not yet begun.
Similarly, while the RSI has seemingly moved above resistance at 40, it has not generated any bullish divergence yet nor has it moved above 50. As a result, these signs are not sufficient to predict a bullish breakout.
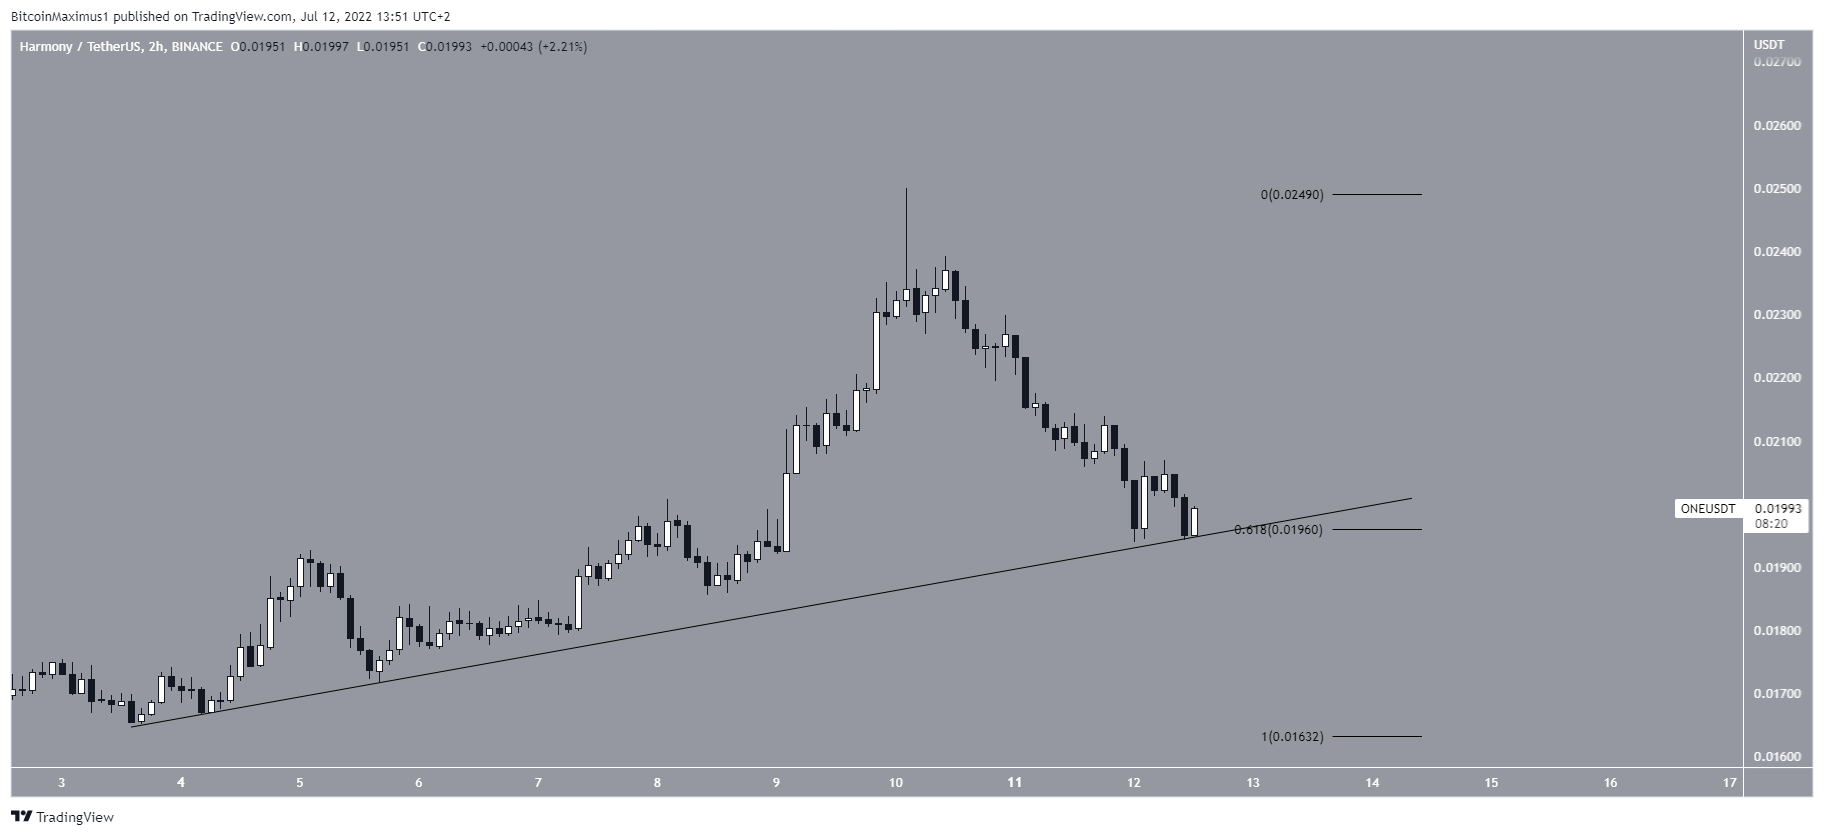
Despite the lack of bullish reversal signs on the daily, the two-hour chart allows for the possibility of bullish continuation. The reason for this is that the upward movement looks impulsive and the price is following an ascending support line.
As a result, if the price manages to create a higher low and bounce at the confluence between the ascending support line and the 0.618 Fib retracement support level, it could eventually break out from the channel.
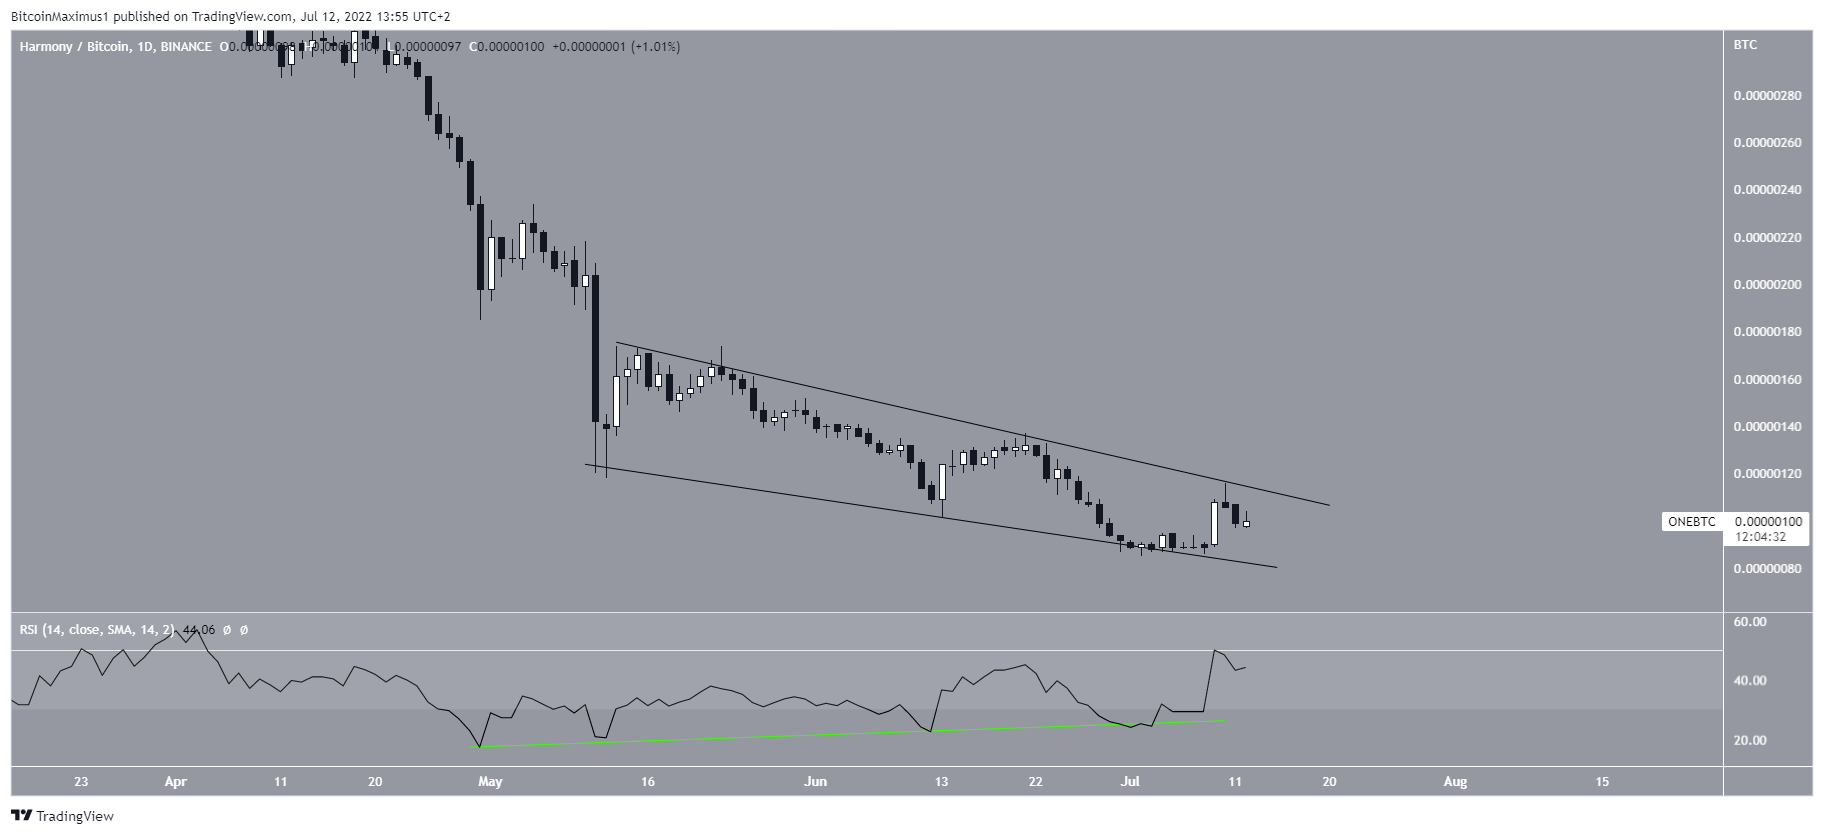
ONE/BTC
The ONE/BTC pair is more bullish than its USD counterpart. The reason for this is that the price has been trading inside a descending wedge since the beginning of May. The descending wedge is considered a bullish pattern and has been combined with bullish divergence in the RSI. As a result, it is possible that a breakout will transpire.
For Be[in]Crypto’s latest bitcoin (BTC) analysis, click here.


