


The Graph (GRT) has been increasing since bouncing on Feb. 23.
Once it breaks out above the current resistance area, GRT is expected to reach a new all-time high price.
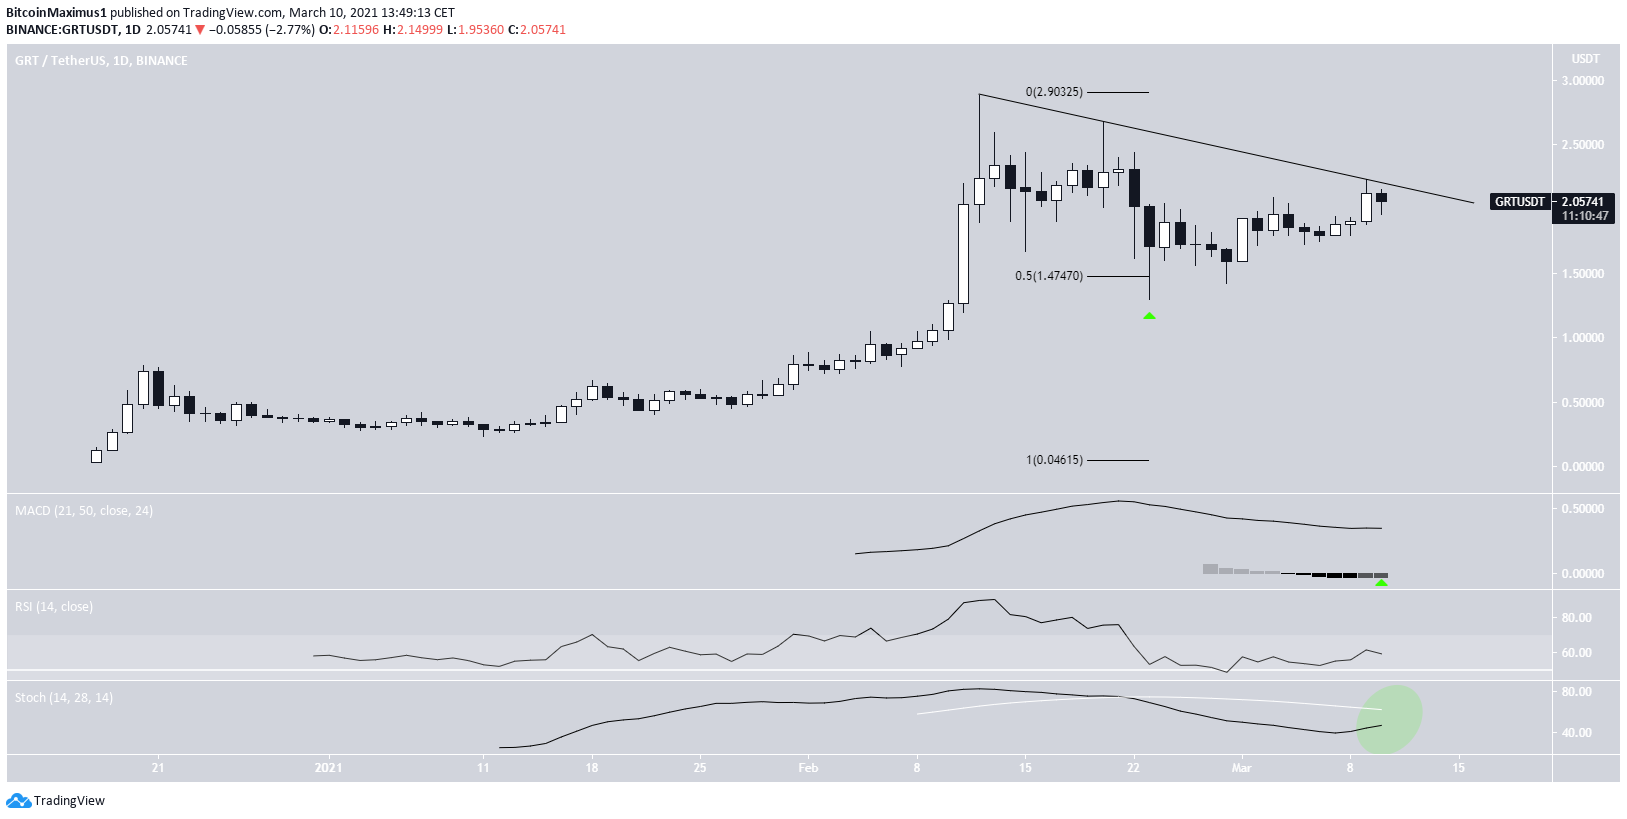
GRT Follows Resistance
GRT has been moving downwards since reaching a high of $2.88 on Feb. 12. The decrease continued until Feb. 23, when the token reached a low of $1.30. The token bounced and has been increasing since. The bounce occurred right above the 0.5 Fib retracement level of the most recent upward movement.
Despite the ongoing increase, it is still following a descending resistance line, having just been rejected by it for the third time.
Technical indicators are turning bullish, as evidenced by the potential bullish cross of the Stochastic oscillator and bullish reversal of the MACD.
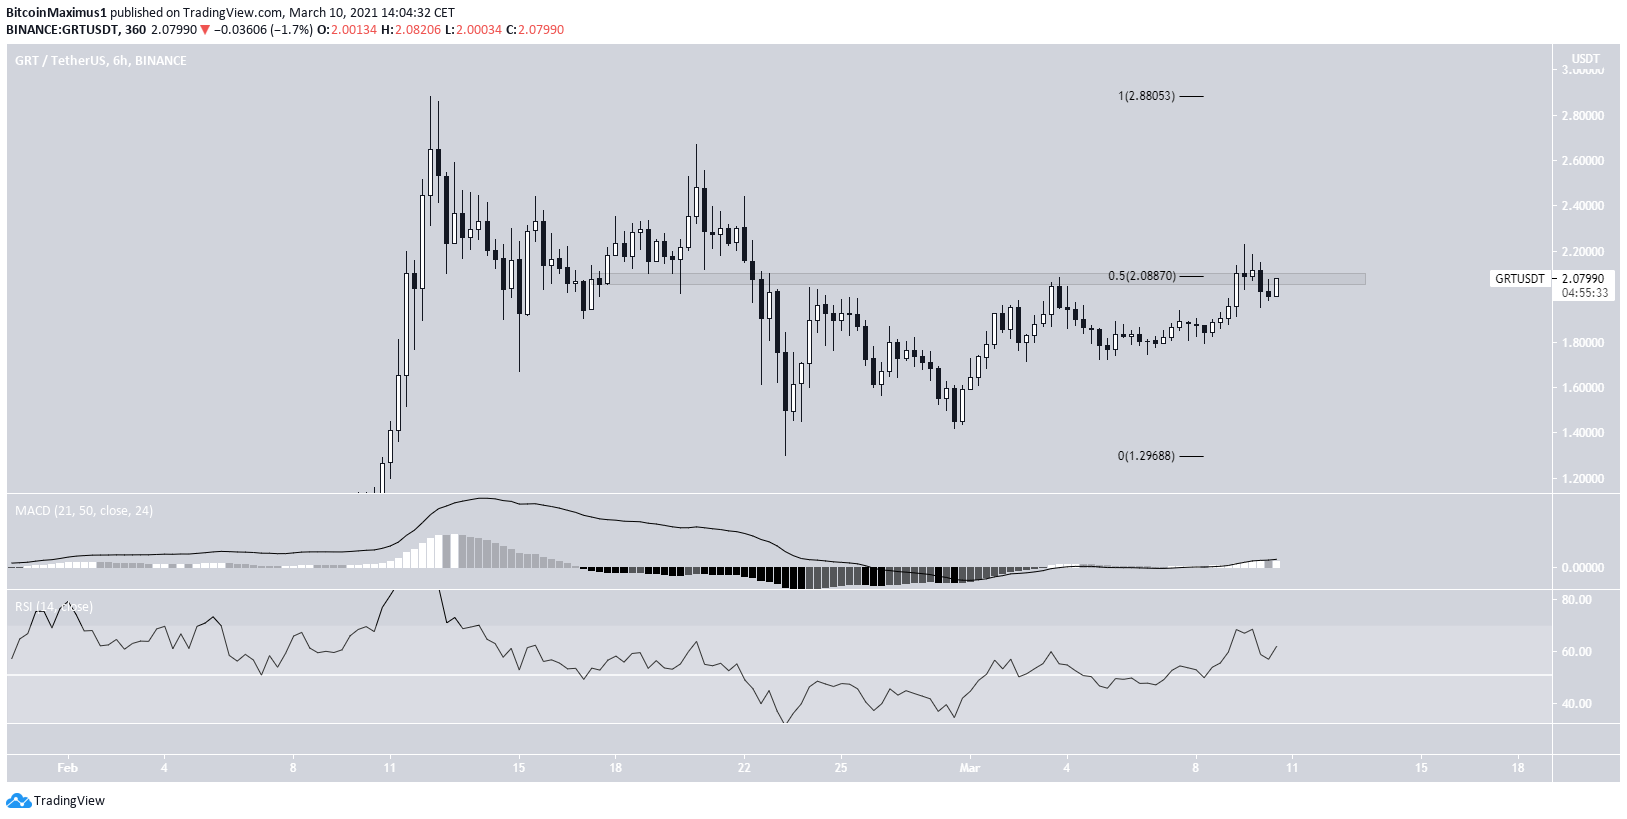
Future Movement
The shorter-term six-hour chart shows that the token’s price initially broke out above the 0.5 Fib retracement level resistance at $2.08.
However, that turned out to only be a deviation since GRT fell right back below it afterward.
While the RSI & MACD are bullish, it has to break out above this level to confirm the bullish trend.
A breakout above this level would also coincide with a breakout above the previously outlined resistance line.
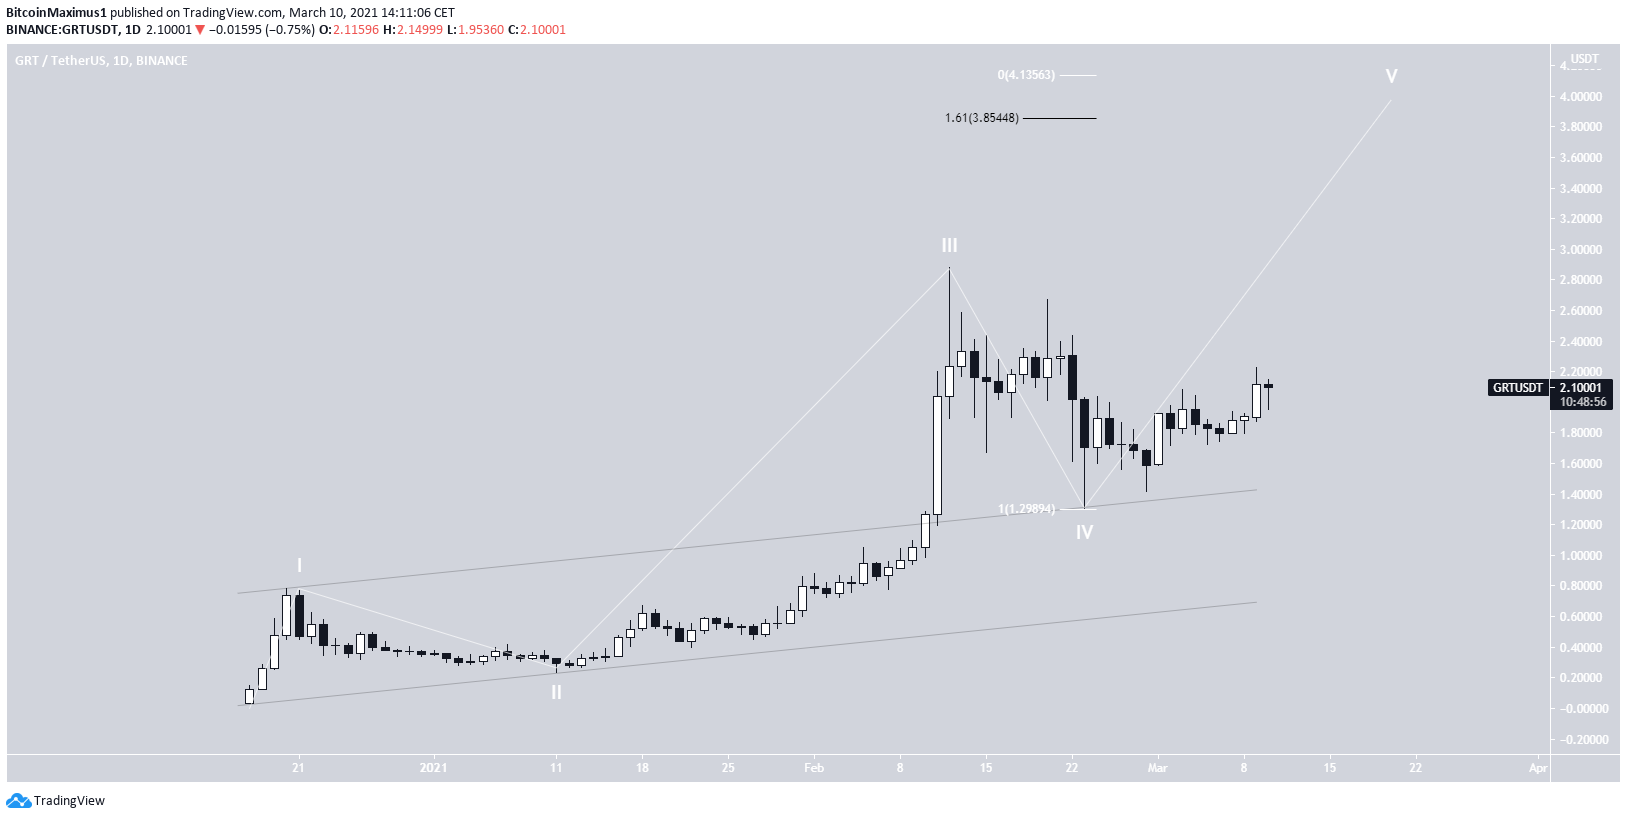
Wave Count For GRT
Cryptocurrency trader @Altstreetbet outlined a GRT chart, stating that a new all-time high is on the horizon.
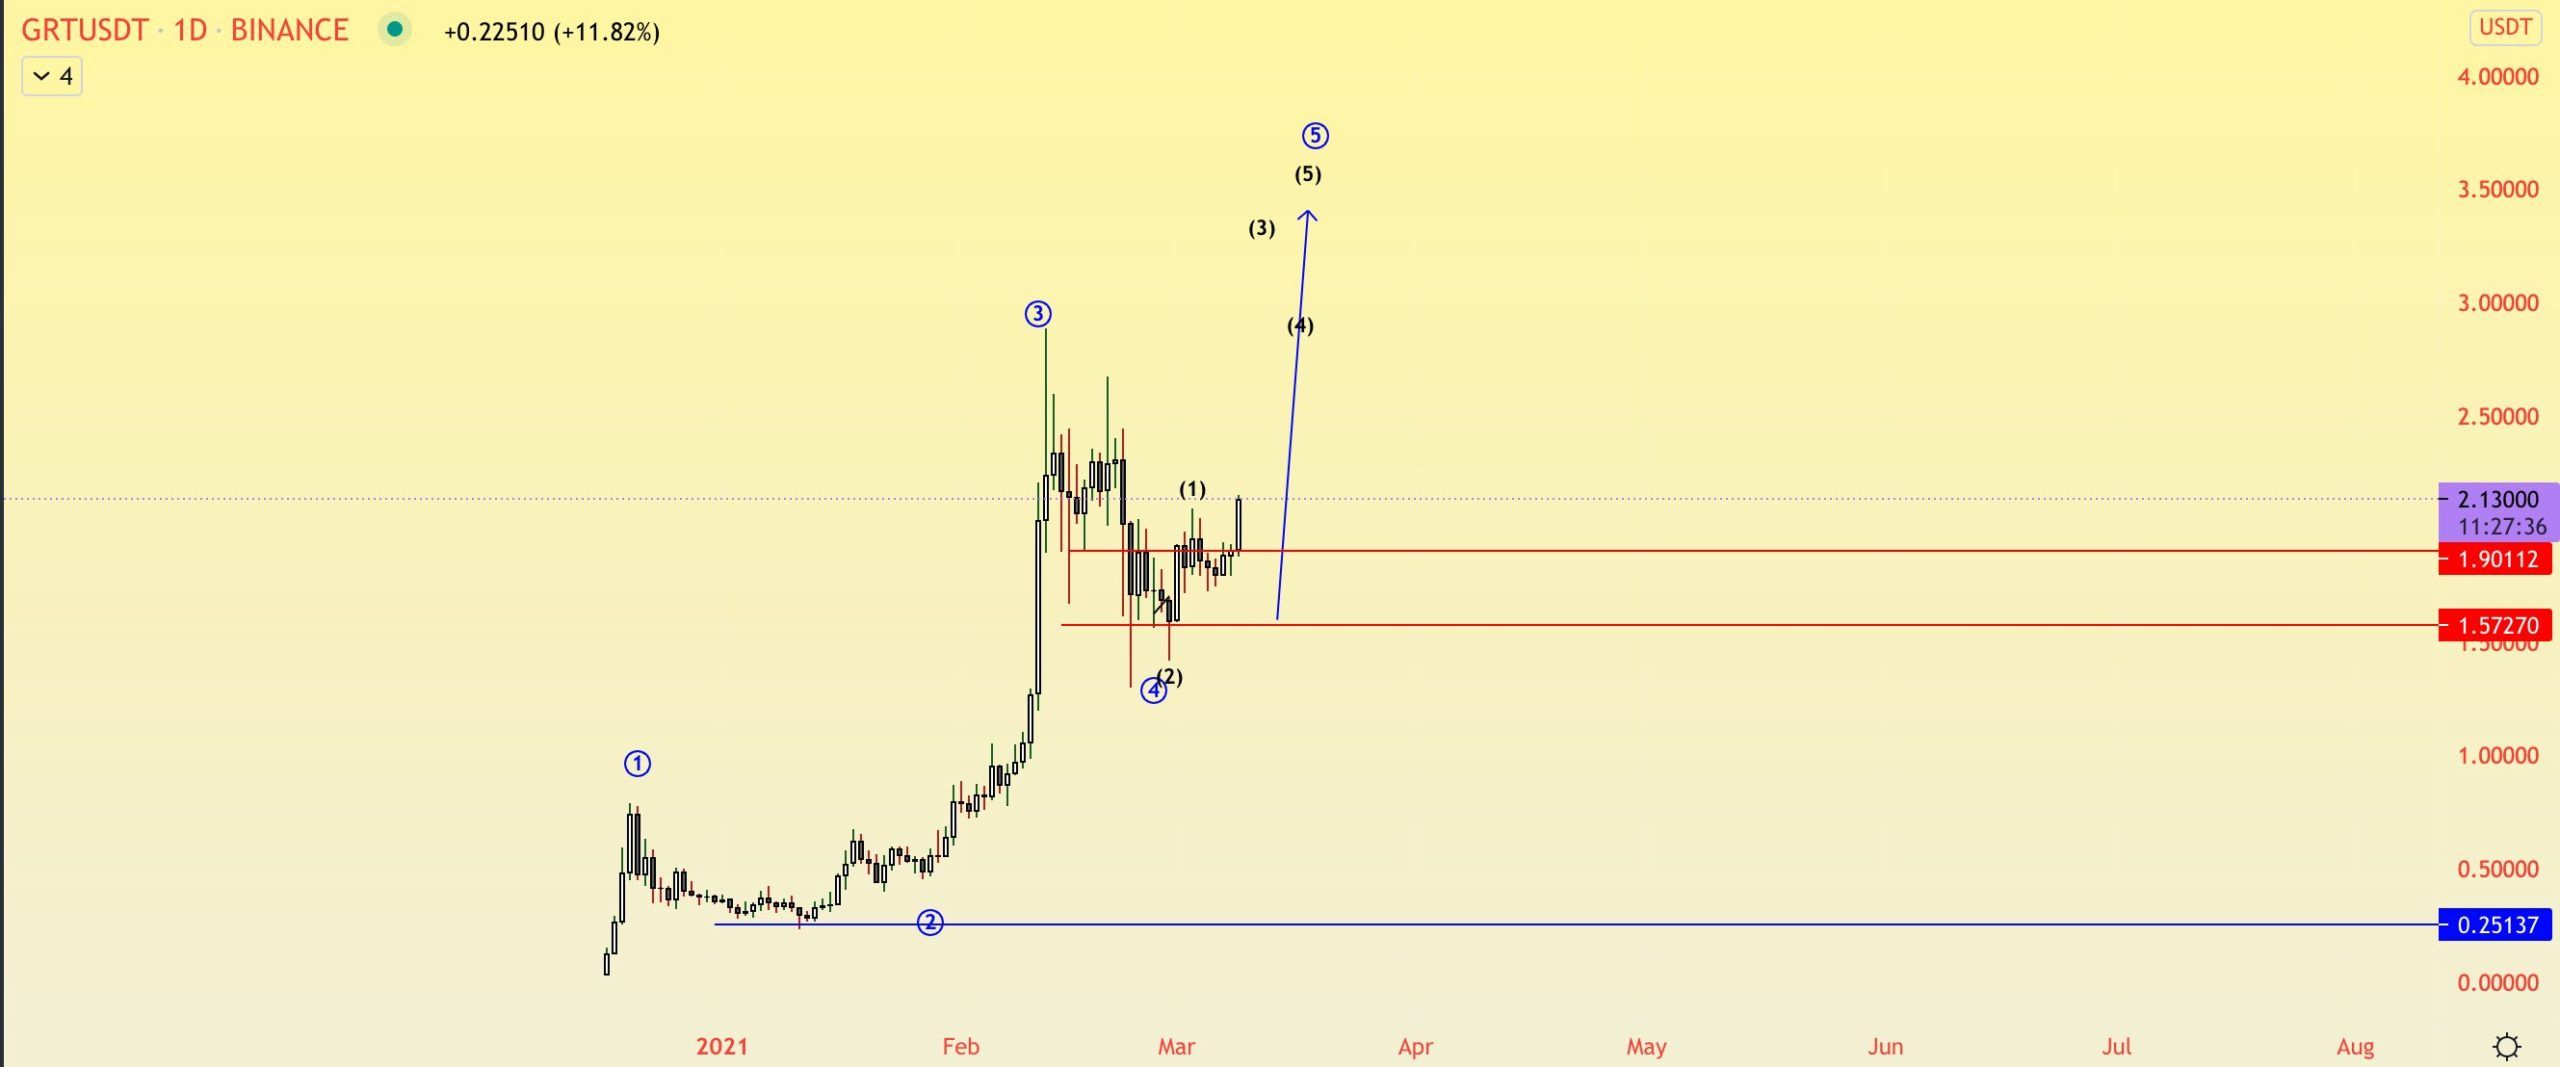
The wave count agrees with this assessment since it shows that GRT has likely begun wave five (white) of a bullish impulse. Before doing that, GRT completed a fourth wave pullback.
The most likely target for this movement’s top is found between $3.85 and $4.13, found by using an external retracement and fib projection.
Conclusion
To conclude, GRT is expected to eventually reach a new all-time high, potentially increasing all the way to $4.
A breakout from the current descending resistance line and horizontal resistance area would confirm this.
For BeInCrypto’s latest Bitcoin (BTC) analysis, click here.


