


GMX is trading back towards the best of the year, following a short-lived panic in the broader cryptocurrency market due to the lawsuit against Binance and its CEO Changpeng Zhao by the CFTC.
GMX Rides the Latest Crypto Wave
On-chain metrics currently depict a network-wide accumulation trend, as the Mean Coin Age (360d) indicates. Blockchain forensics platform Santiment describes this indicator as the average number of days each GMX token has stayed in its current address.
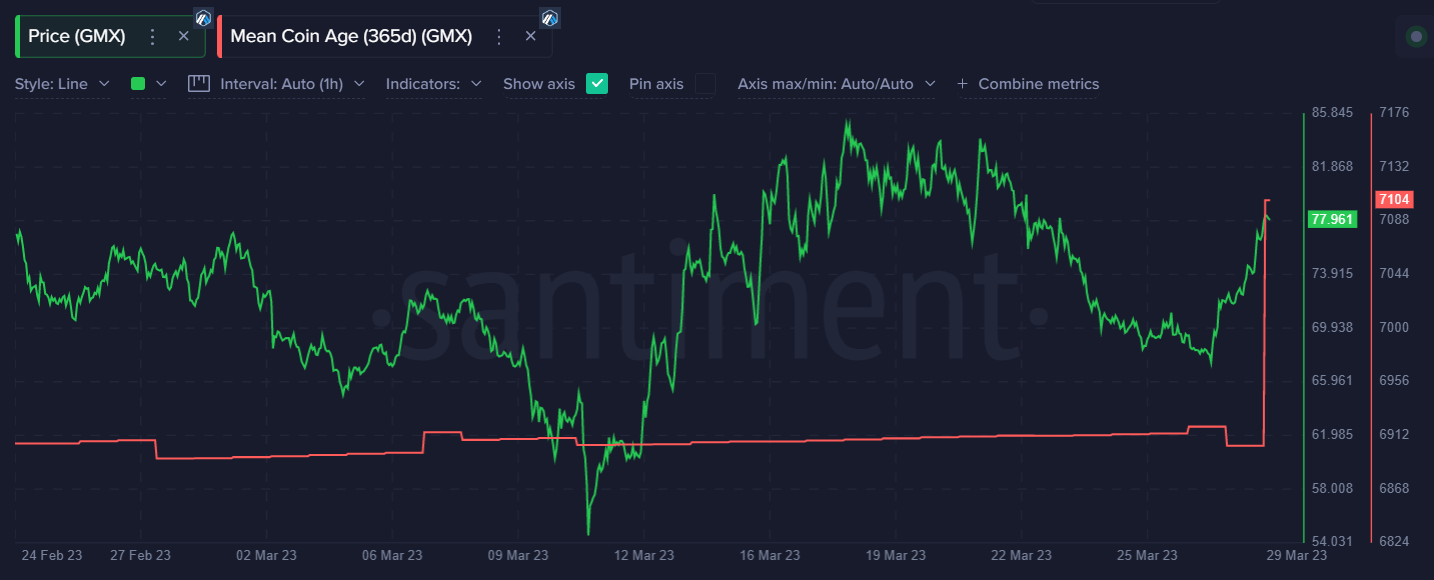
Historically, GMX prices have tended to spike when the Mean Coin Age starts to accelerate to the upside. Since yesterday, a major spike higher has taken place in (360d) Mean Coin Age.
This declining sell pressure and resumption of the bullish market means that a strong start to April 2023 may be on the cards for GMX.
The recent accumulation trend among GMX whales is another critical metric that has driven the GMX price upwards in the past week. Santiment data shows that whales holding 10,000 to 100,000 GMX, have added 34,400 more tokens to their balances this week, totaling $2.65 million.
GMX supply distribution chart shows that the whales with 10,000 to 100,000 coins now hold around 6.40% of the supply. This is up from just over 3.49% at the start of 2023.
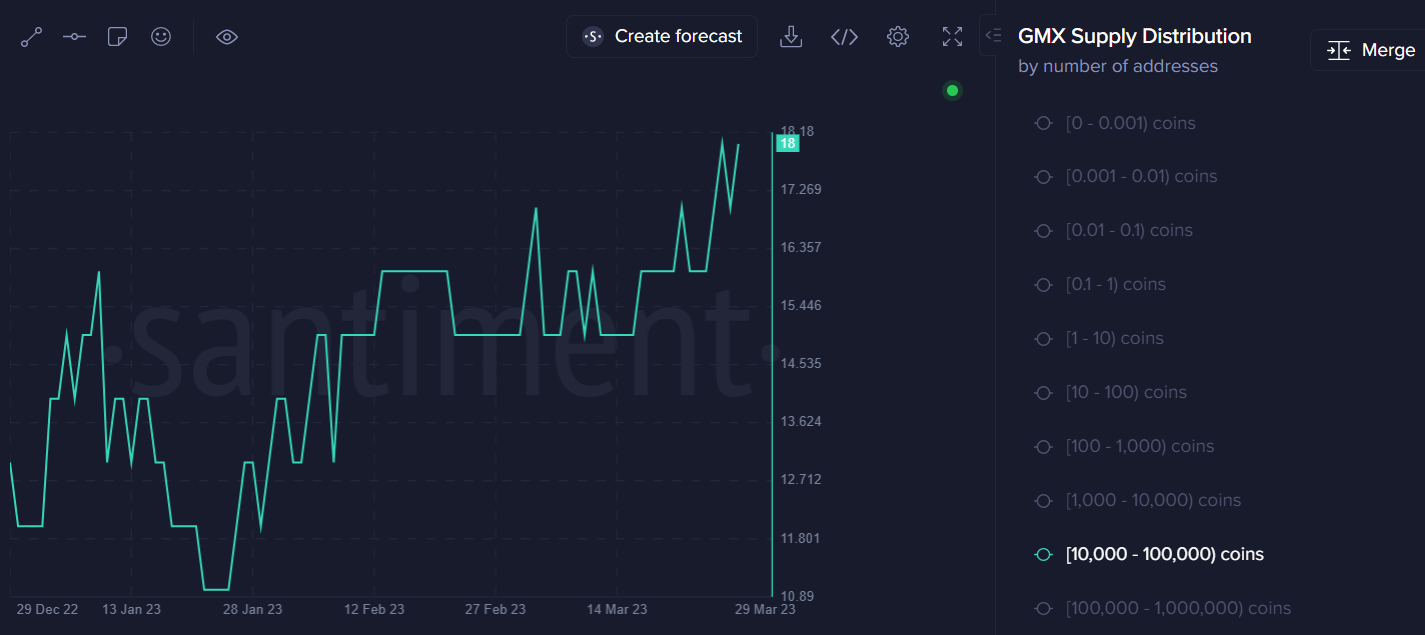
GMX whales with 10,000 to 100,000 coins also increased their holding by around 1% over the past twenty-four hours to add to the bullish accumulation case.
GMX Price Prediction: Targeting $100
The GMX chart appears to also be forming an inverted head and shoulders pattern on the daily time frame chart to further complement the bullish on-chain developments surrounding the project.
Inverted head and shoulders price patterns are amongst the most bullish patterns for technical analysts. Once the neckline of the pattern is broken explosive price movements often follow.
As such, a move above the $88 level could easily cause a 13.66% increase toward the $100 level.
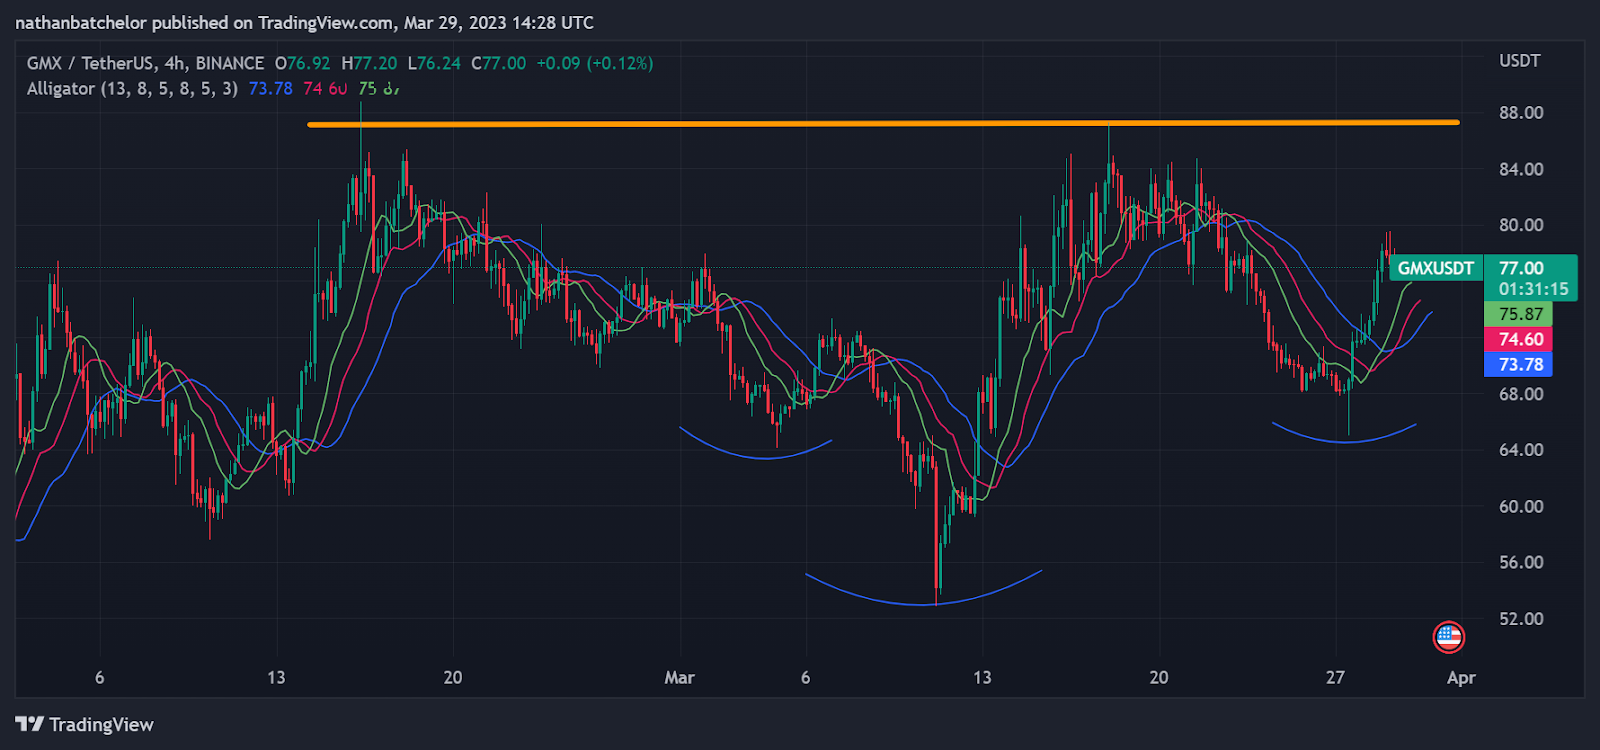
Still, if the bears take charge and GMX price slips below $65, expect a larger drop toward $50 before they choose to cut their losses.
It is also worth noting that GMX will likely be guided by the broader market moves. If other altcoins are heading higher, then GMX’s path will more likely than not be higher.


