


FunFair (FUN) has been decreasing since Aug. 24 and broke down from an ascending support line on Sept. 7.
However, it is still trading above a horizontal support level, allowing for the possibility that the upward movement will continue.
FUN holds on above support
The weekly chart shows that FUN has been moving upwards since July 21. The August movement above the $0.023 area indicated that what previously seemed like a breakdown was only a deviation.
Currently, FUN has returned to validate the area as support once more.
Technical indicators are at a crucial level. The RSI has moved back above 50 and the MACD has given a bullish reversal signal.
However, this week’s close is crucial, since it could invalidate both these bullish signs.
On the other hand, if the token manages to hold on above the $0.023 support area, the bullish structure and readings would remain intact.

Future movement
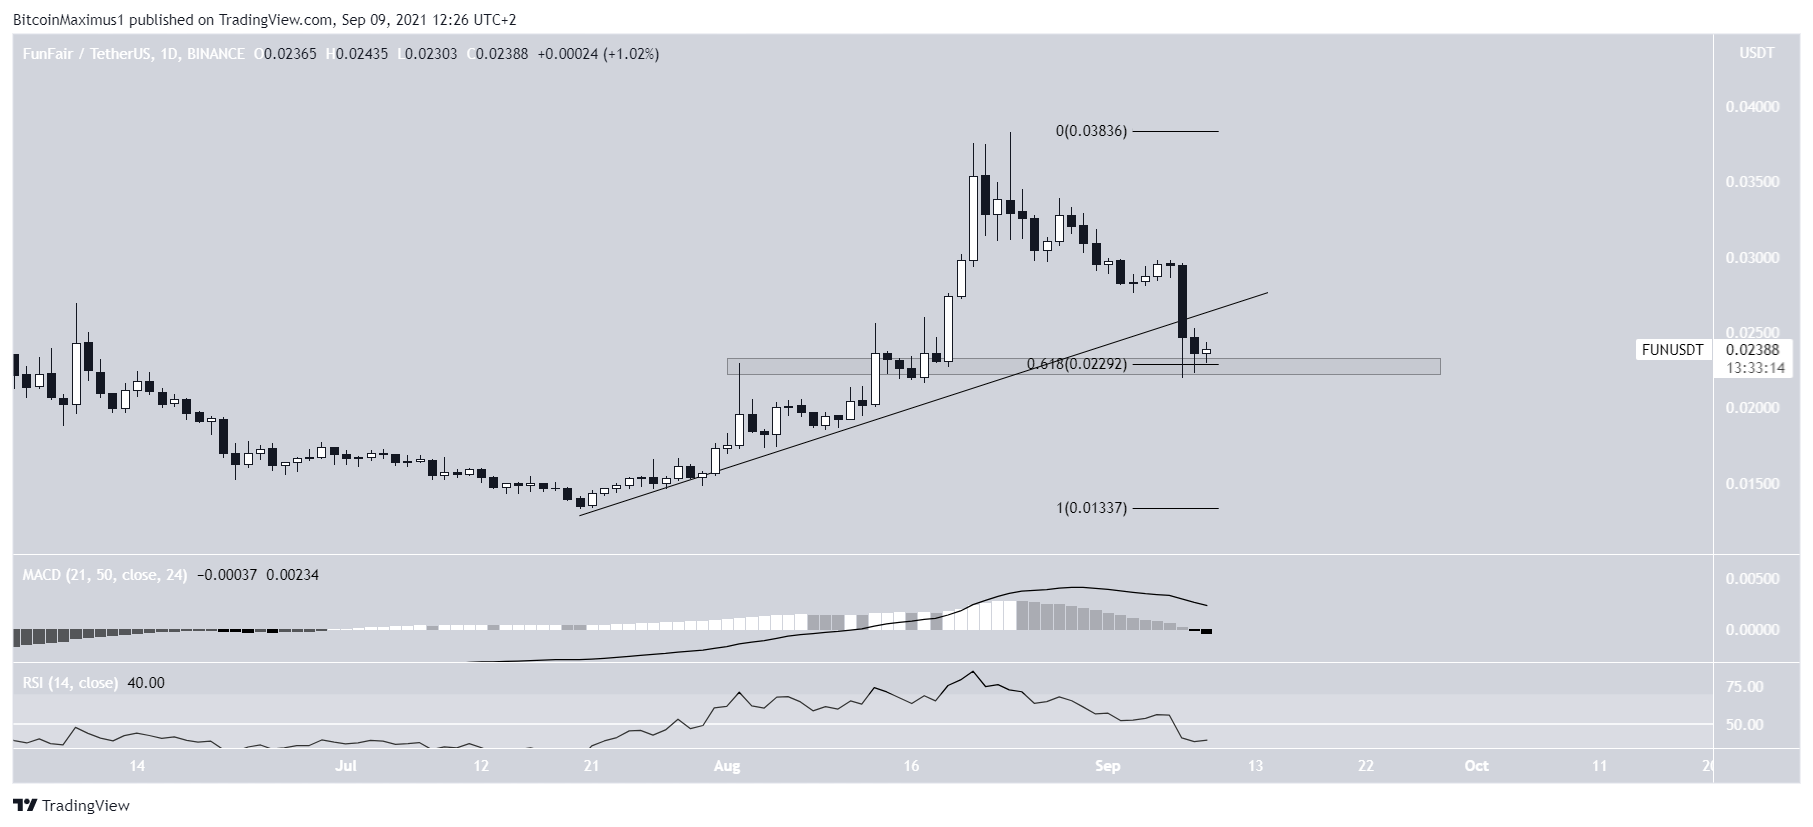
A look at the daily chart shows that FUN has been following an ascending support line since July 21.
While the Sept. 7 drop caused it to break down, the token is still holding on above the 0.618 Fib retracement support level. The level coincides with the previously outlined $0.023 horizontal support area.
However, technical indicators in the daily time-frame are turning bearish. The MACD is negative and the RSI has moved below 50.
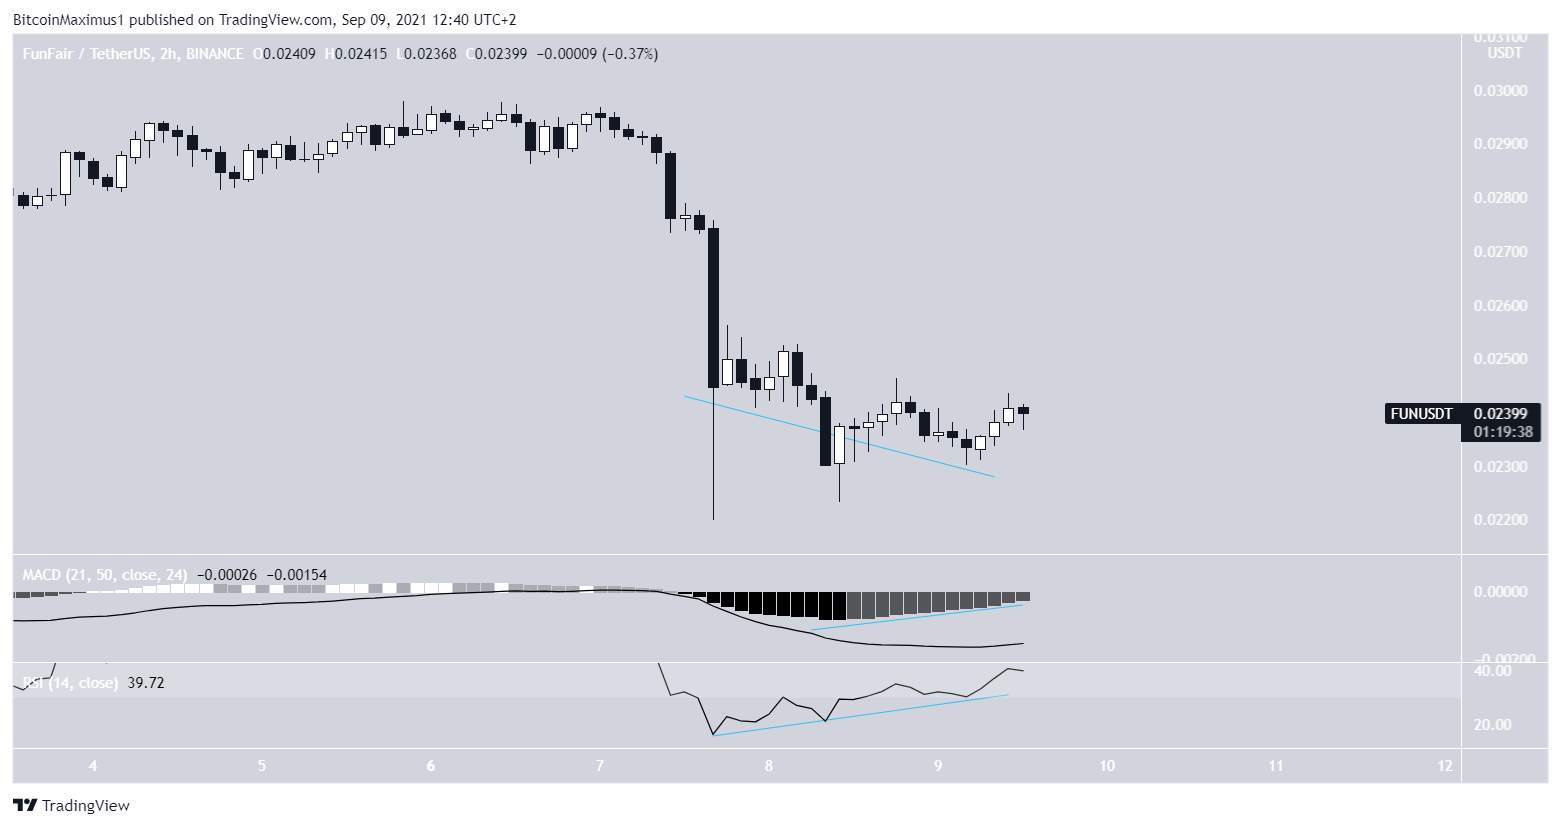
According to the two-hour chart a bounce is expected. This is so because there is a considerable bullish divergence in the RSI and MACD, whose trendline is still intact.
Therefore, while a short-term bounce is likely, which could validate the previous ascending support line as resistance, the longer-term trend cannot be determined yet.
FUN/BTC
Cryptocurrency trader @thebull_crypto outlined a FUN/BTC chart, stating that the reclaim of the 60 satoshi horizontal area could be the catalyst for a significant upward movement.

The weekly chart for FUN/BTC does indeed look more bullish than its USD pair.
The token has broken out from a long-term descending resistance line and validated it as support afterwards (green icon).
While the MACD and RSI provide relatively neutral readings, the price action does look bullish.
The closest resistance area is at 100 satoshis. A breakout above it could trigger a sharp upward movement.

For BeInCrypto’s latest Bitcoin (BTC) analysis, click here.



