FTX Token (FTT) has potentially completed a corrective phase and is now approaching the $53.80-$60 resistance area. The upward movement was preceded by a significant bullish signal.
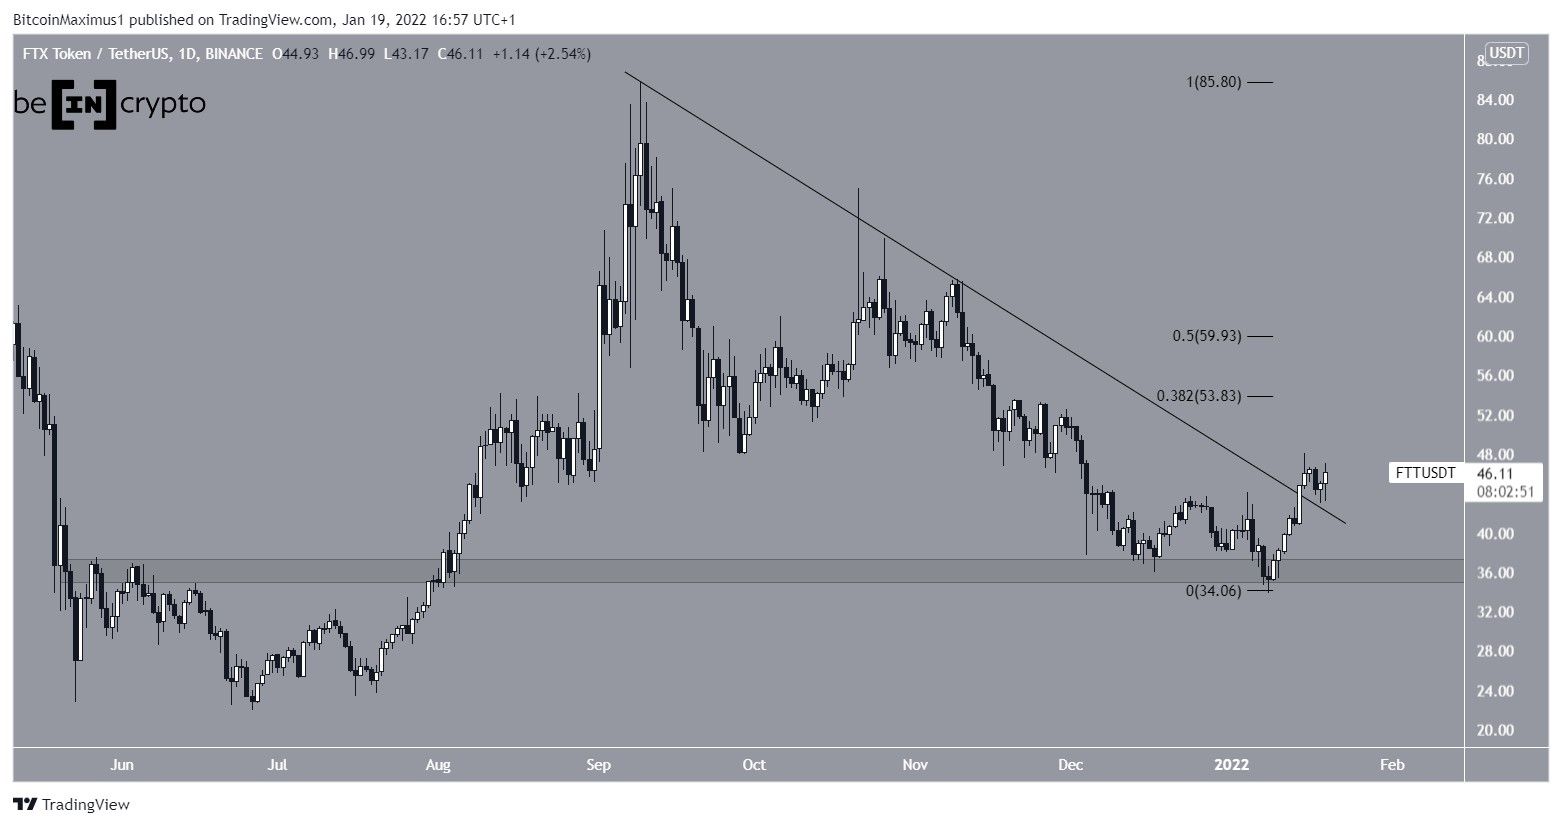
FTT had been on a downtrend since reaching an all-time high price of $85.74 on Sept 9. Throughout the decrease, it has been trading underneath a descending resistance line. So far, FTT has reached a local low of $33.76 on Jan 8.
From this low, FTT rebounded and initiated an upward move, serving to validate the $36 area as support. This is a crucial area that previously acted as resistance.
On Jan 14, FTT broke out from the aforementioned descending resistance line. Prior to the breakout, the line had been in place for 127 days.
The next closest resistance now falls between $53.80-$60. This resistance range is created by the 0.382-0.5 Fib retracement resistance levels.
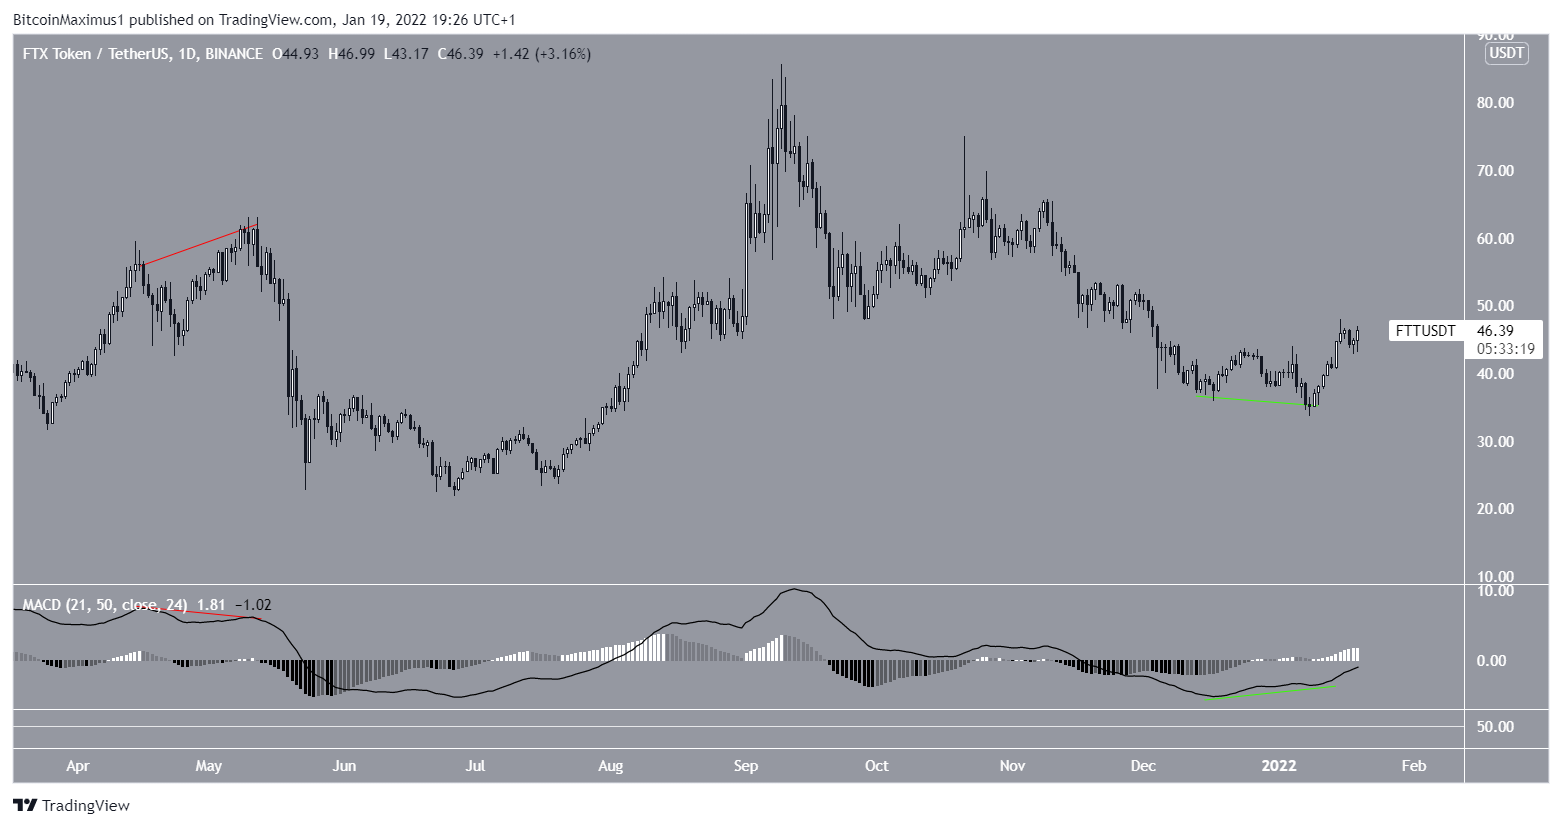
Bullish divergences
Technical indicators currently support the continuation of the upward movement. This is especially evident in the daily MACD.
The signal line of the MACD generated a bullish divergence (green line) in the period between December 2021 and January 2022. The last time the signal line generated any type of divergence was between April and May 2020, when a significant bearish divergence (red line) preceded a sharp drop in price.
Therefore, since the current divergence is bullish, it’s possible that a similar upward move will transpire this time around.
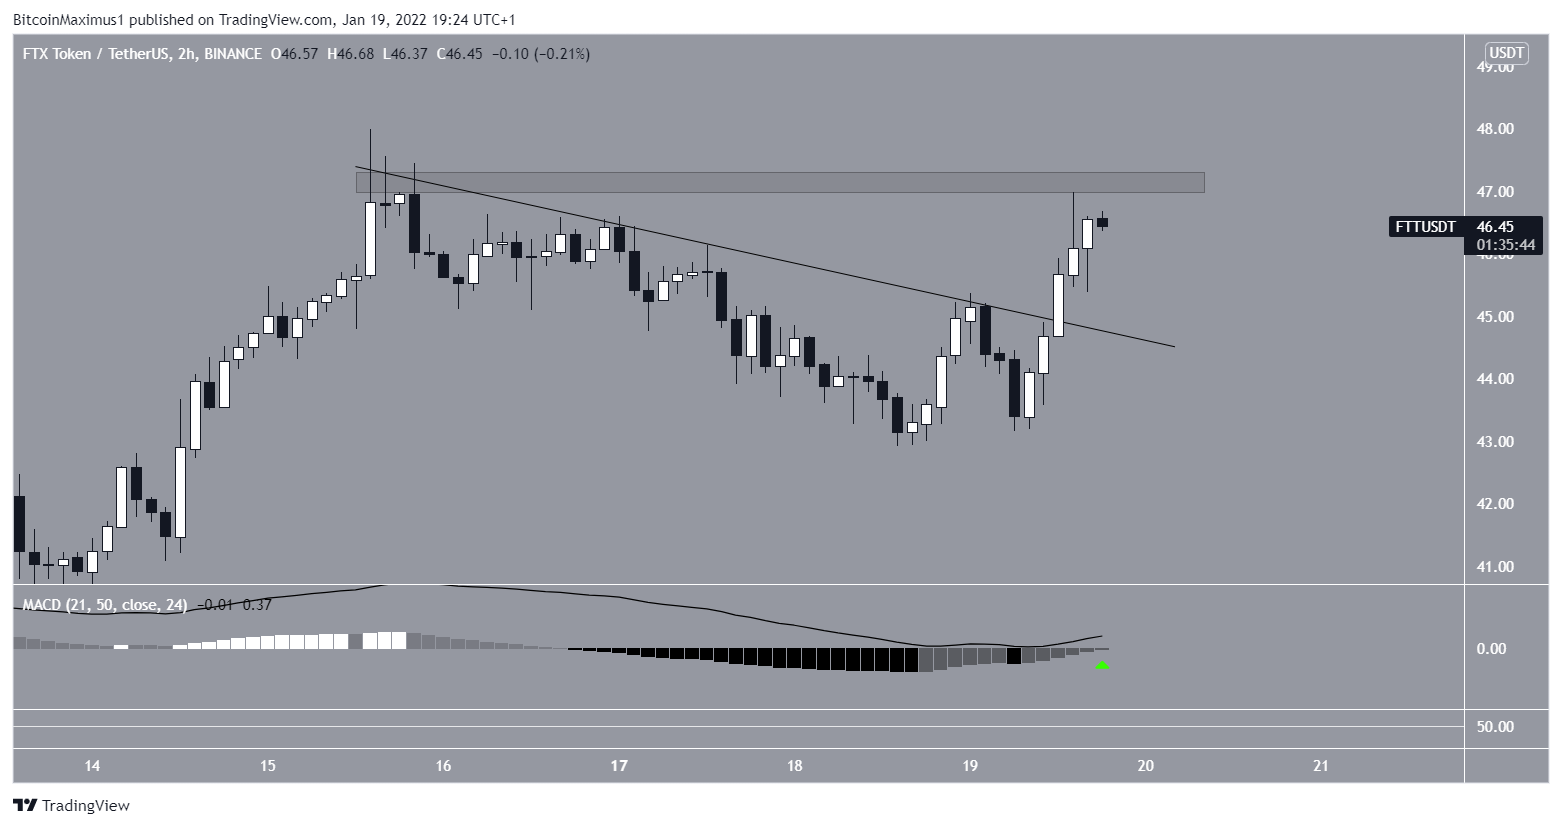
The two-hour chart also shows that FTT has broken out from a descending resistance line. It’s now trading at the final short-term resistance area slightly above $47.
Similar to the daily time frame, the upward move is supported by the MACD, which has nearly crossed into positive territory.
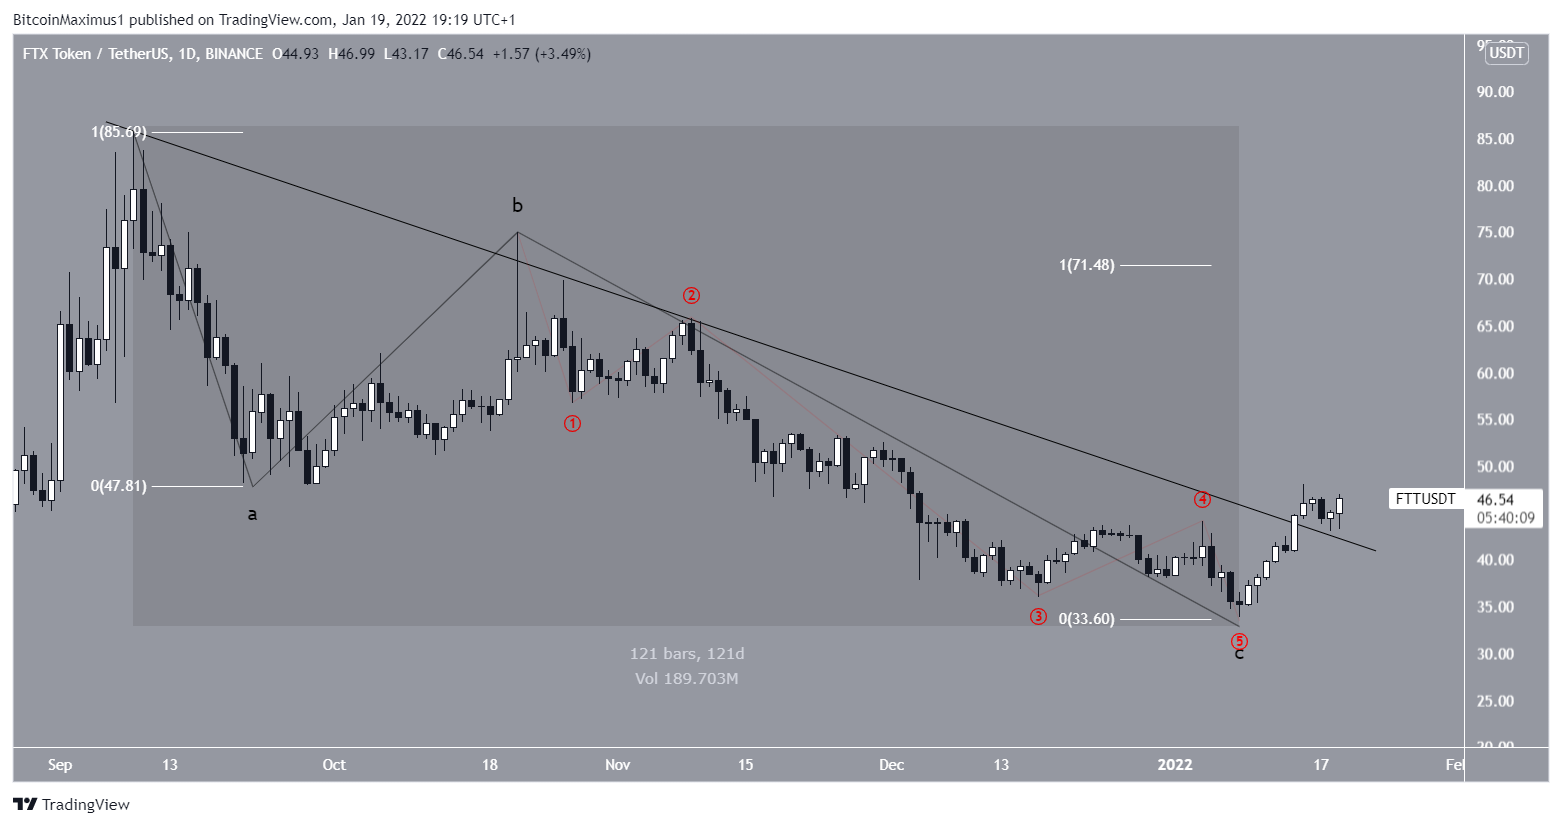
FTT wave count analysis
Cryptocurrency trader @Altstreetbet tweeted an FTT chart, stating it appears FTT has completed its corrective phase and could increase toward the next resistance around $60.
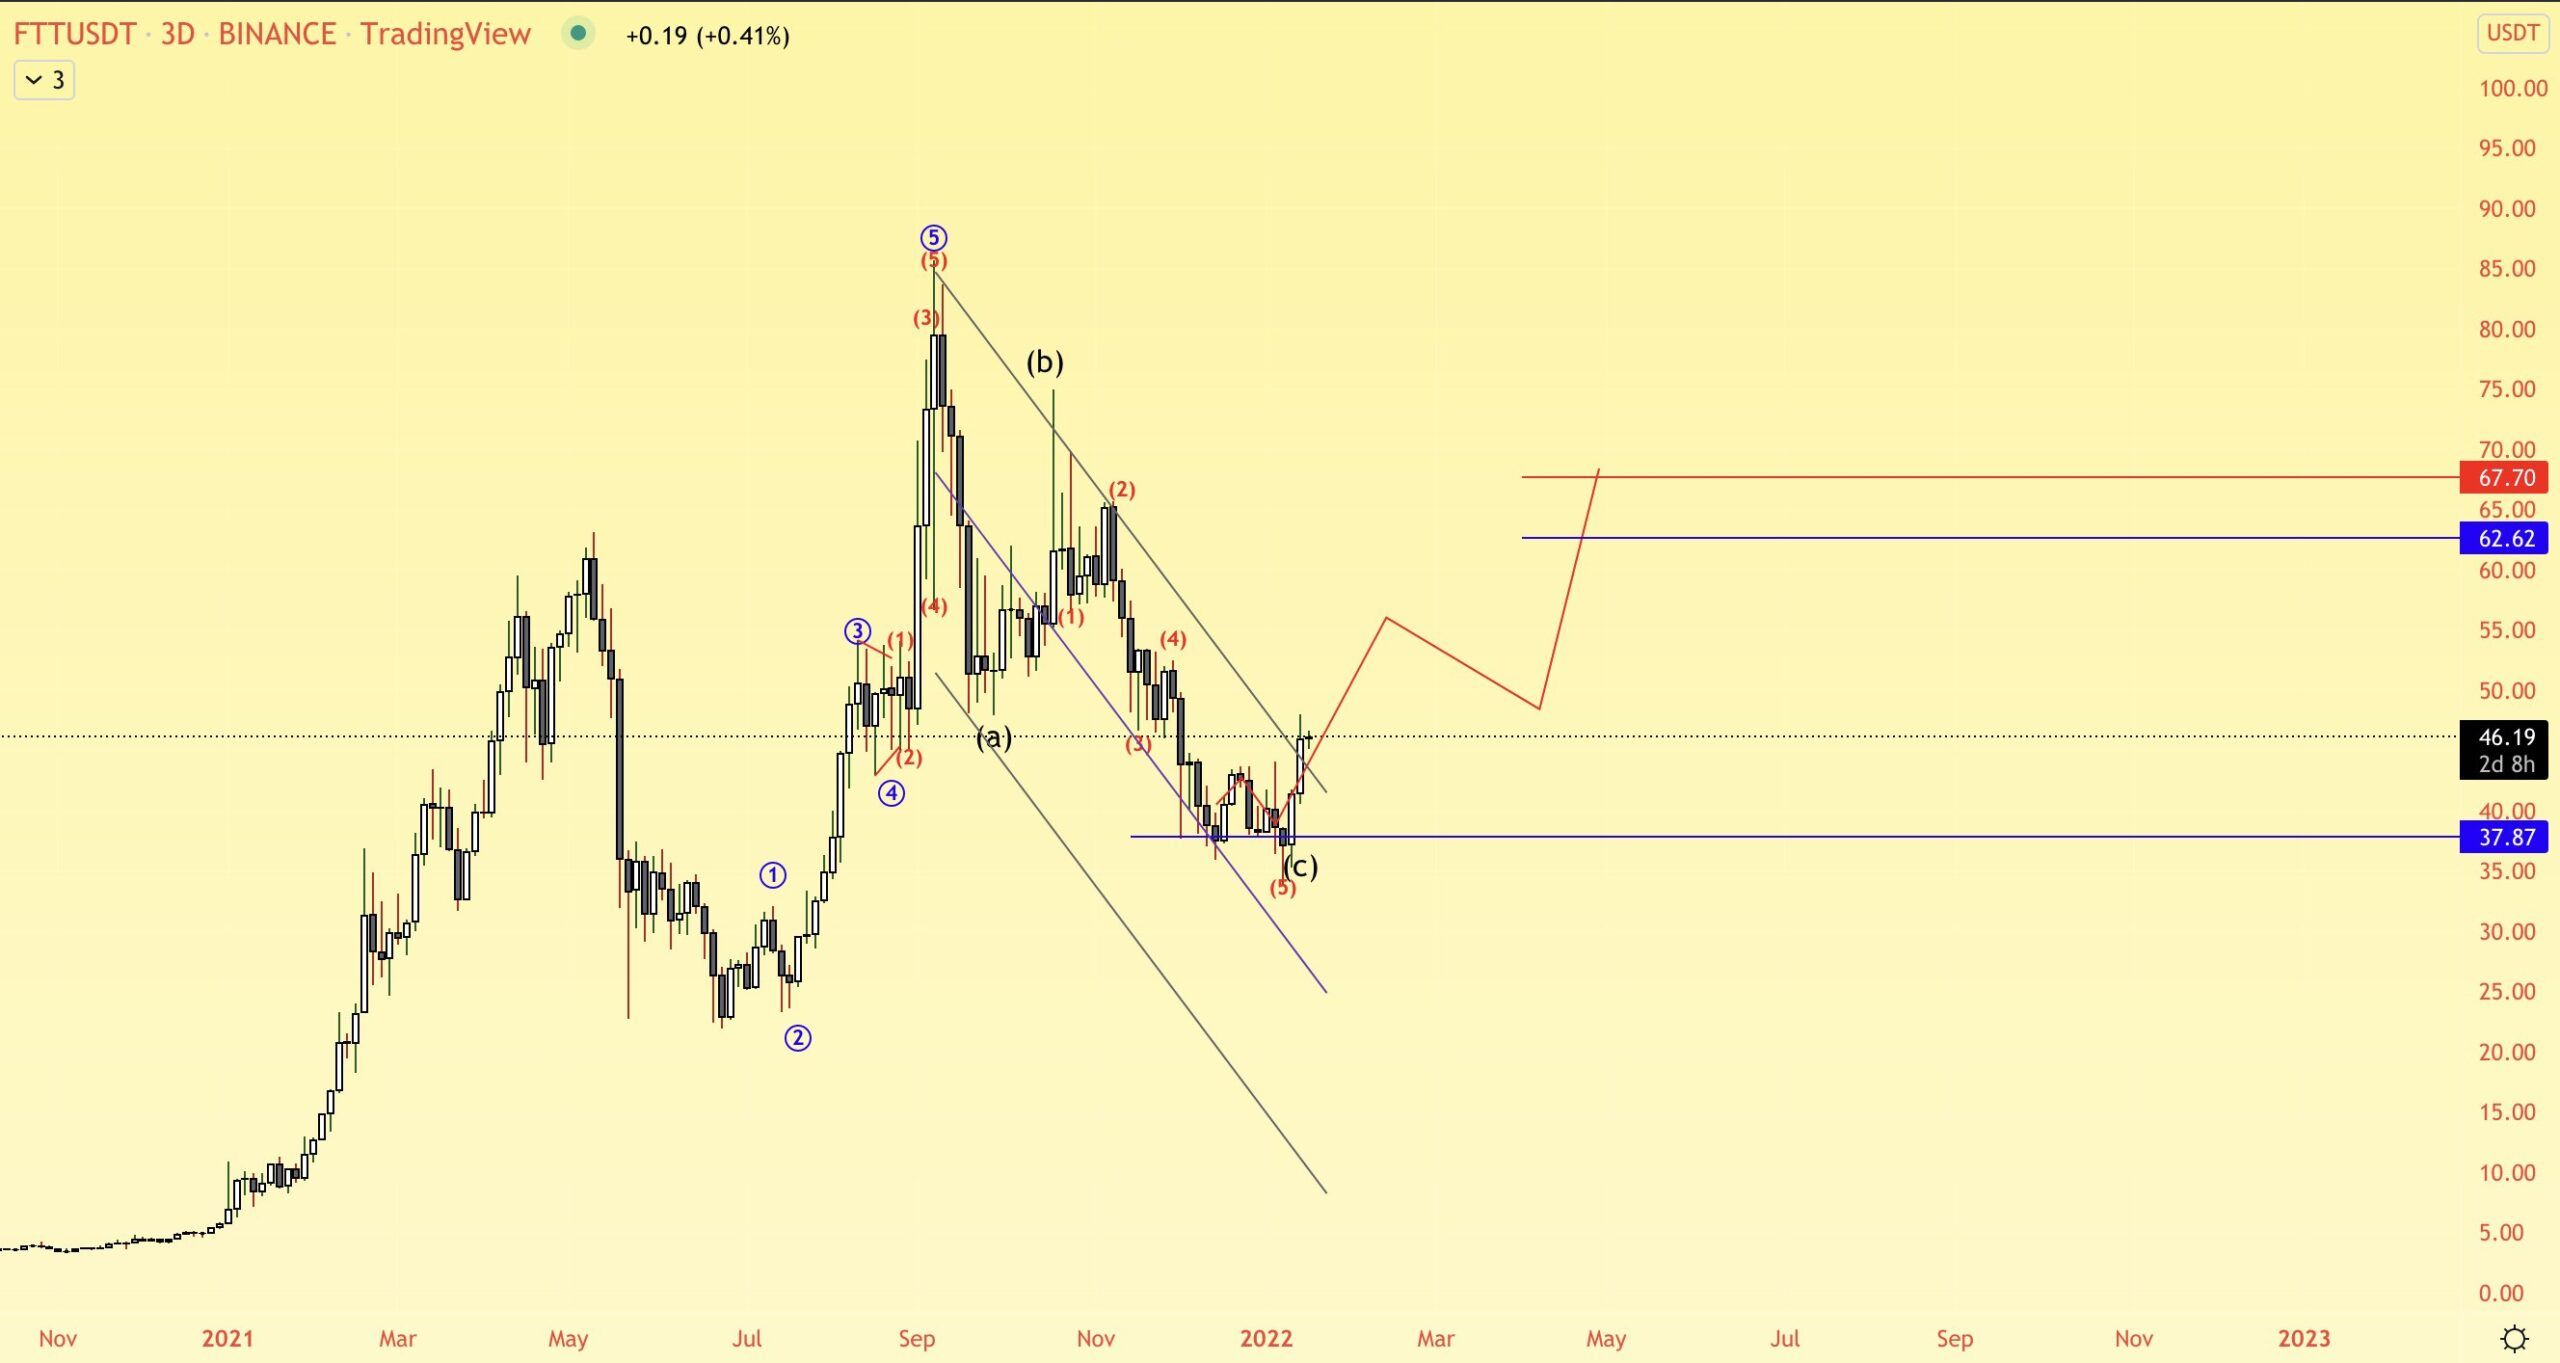
Measuring from the Sept 9 all-time high, the most likely wave count suggests that the movement to the Jan 8 low (highlighted) was a corrective structure. In it, waves A:C have had an exact 1:1 ratio, which is very common in such structures.
In addition to this, wave C is clearly a five-wave downward move (red), which is a requirement in order for the correction to be complete.
While an increase towards the $53-$59 region seems very likely, the shape of the ongoing upward move will help in determining the direction of the future trend.