


Artificial Superintelligence Alliance (FET) has displayed a recovering price pattern on its chart, posting a 25% gain this week. While the uptick might seem encouraging, underlying bearish cues suggest the cryptocurrency could be preparing for a significant drawdown.
To further concern the investors is the formation of a key bearish pattern that could determine losses for FET holders.
FET Investors Face Selling
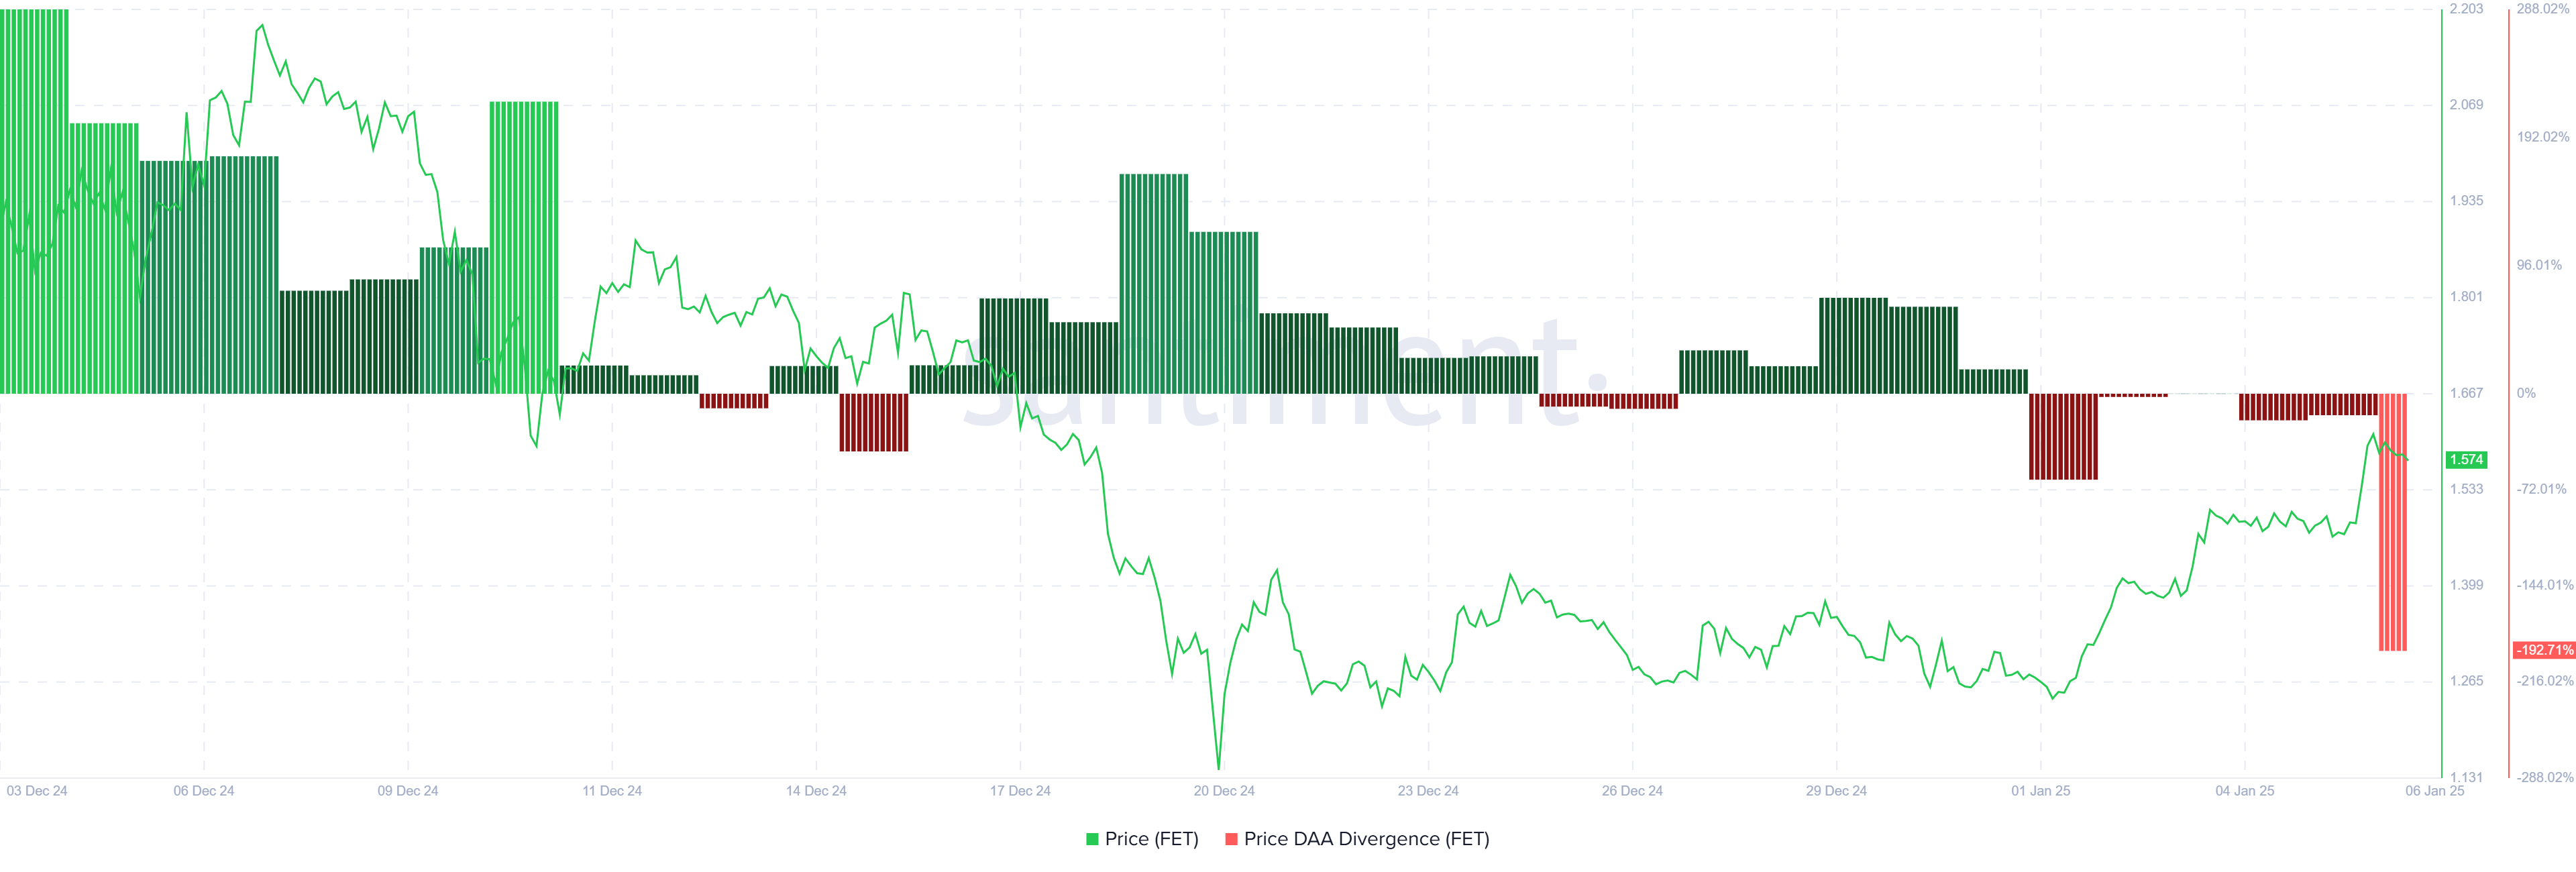
The Price DAA Divergence is currently flashing a sell signal for FET, raising concerns about sustainability. Rising prices are diverging from the network’s declining activity, creating a dissonance that often leads to corrections. Historically, similar scenarios have prompted price drops, potentially redirecting investor optimism.
The divergence suggests that despite the recent gains, FET’s bullish sentiment may be short-lived. To align the price with on-chain activity, a correction seems imminent. This pattern reflects a broader trend of markets recalibrating when prices outpace organic network growth.
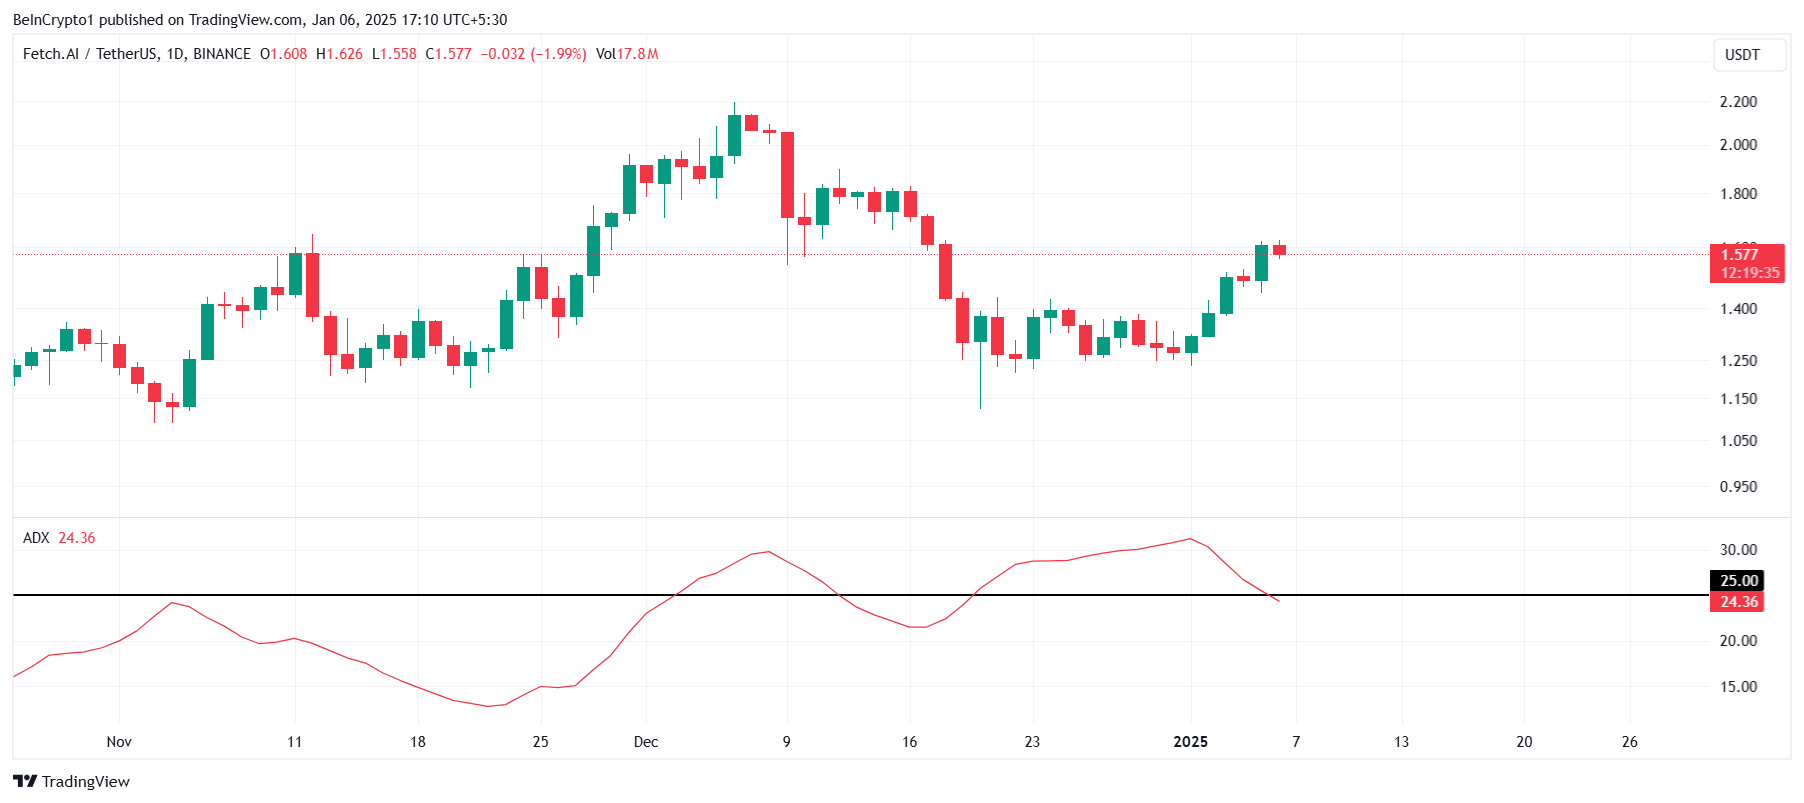
FET’s macro momentum, analyzed through the Average Directional Index (ADX), offers a nuanced picture. The ADX currently lies below the neutral threshold, signaling the prior downtrend has weakened, possibly ending. This development suggests FET may transition into a more stable phase.
Interestingly, if the ADX begins to rise again, it would indicate a strengthening uptrend. This dynamic highlights the importance of sustained momentum in pushing FET toward its next resistance levels, offering hope to investors anticipating further growth.
FET Price Prediction: Escaping The Pattern
FET’s price is teetering on the edge of forming a bearish head-and-shoulders pattern, a warning sign for potential losses. A drop below the $1.19 support level would confirm the pattern, potentially triggering a significant decline.
Despite these bearish signals, mixed factors suggest FET might still hold above $1.40, even if it struggles to breach $1.71. This support level could act as a buffer against further losses, providing some relief to investors.
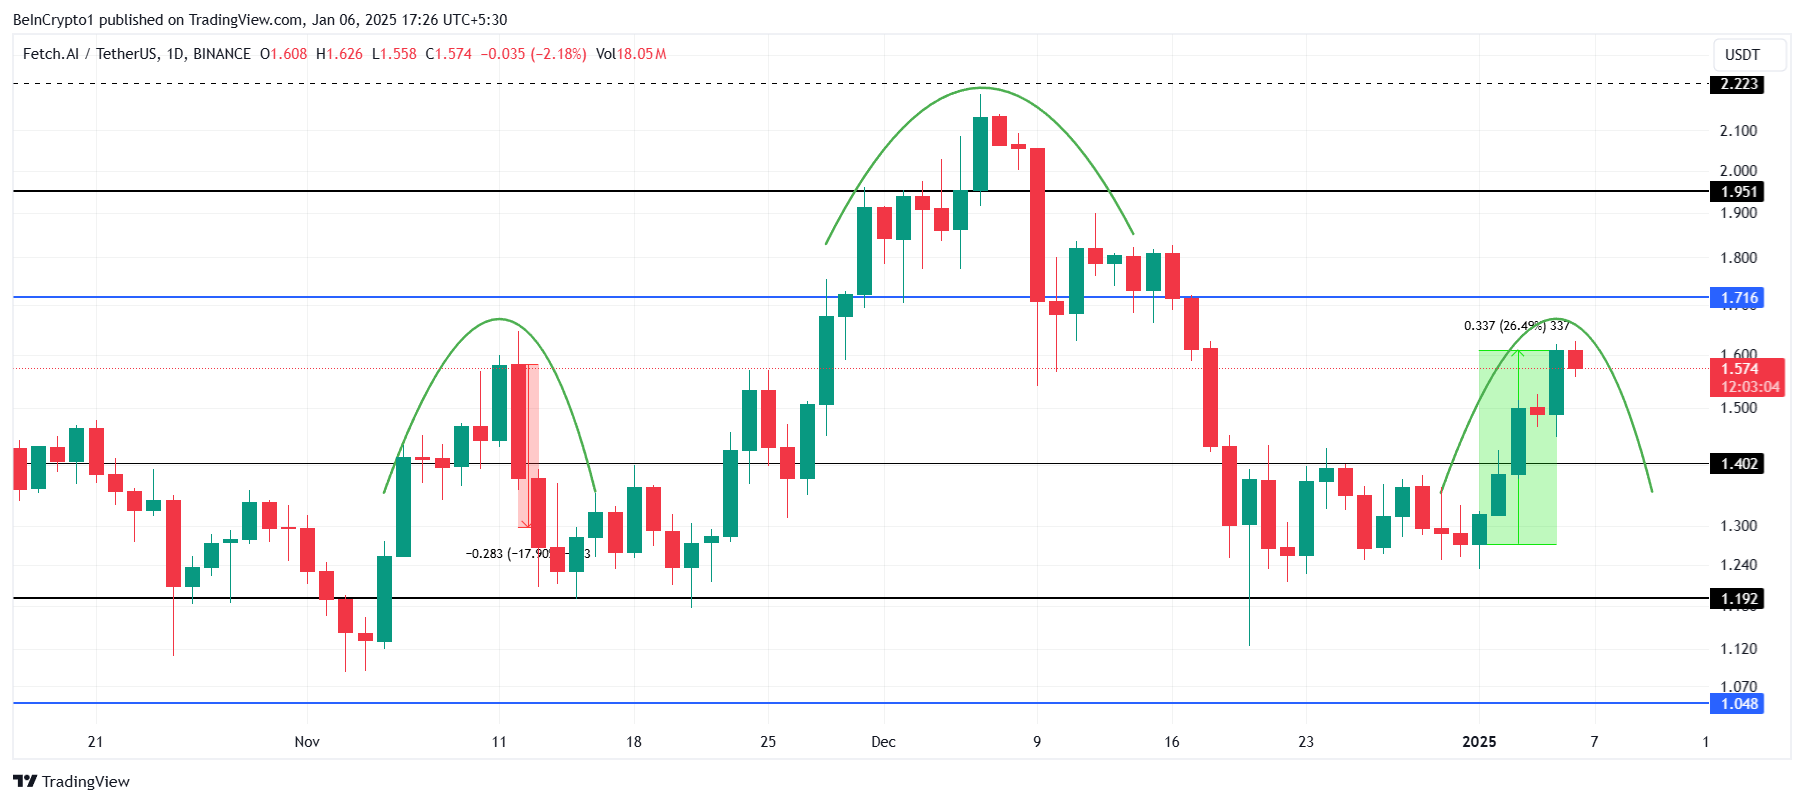
Should FET flip the $1.71 resistance into a support level, it could rally to $1.95 and even $2.00. This move would invalidate the bearish outlook and strengthen the uptrend, offering an optimistic scenario for the altcoin’s future.



