


The Fear and Greed Index, a popular indicator of the health of the cryptocurrency market, just broke out of the area of fear where it stayed since the end of November 2021. Today it gave a neutral reading of 48 for the first time in nearly 3 months.
The reason for the easing of extreme fear on the Fear and Greed Index is due to the surge in the cryptocurrency market initiated on February 4. As a result of the breakout above the descending trendline, the total cryptocurrency market capitalization (TOTALCAP) temporarily returned to the $2 trillion level today.
Neutral Fear and Greed Index
Today’s reading of the popular Fear and Greed Index is 48. This is the first neutral value of the index since November 22, 2021, when it showed equal 50 (green circle).
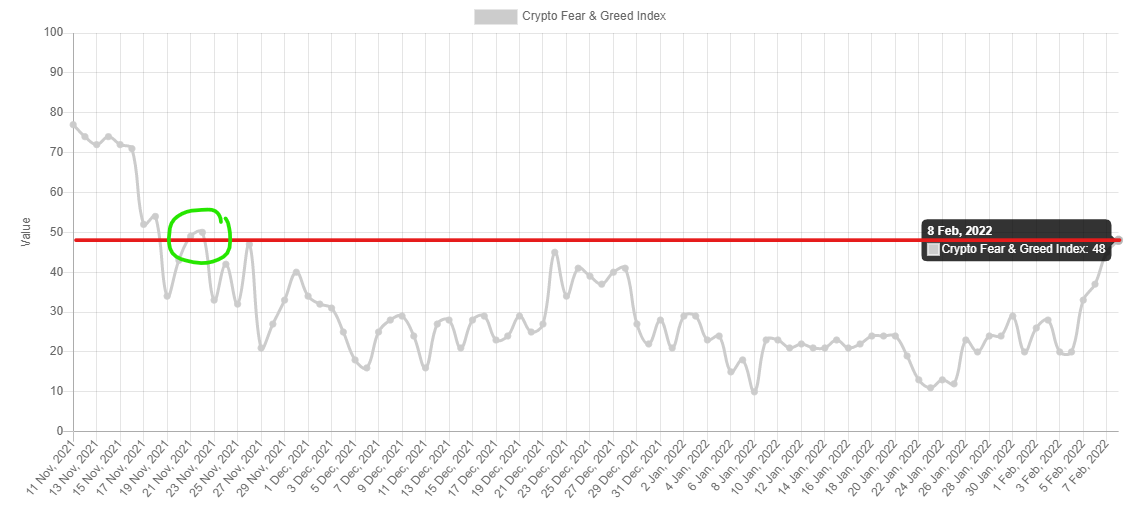
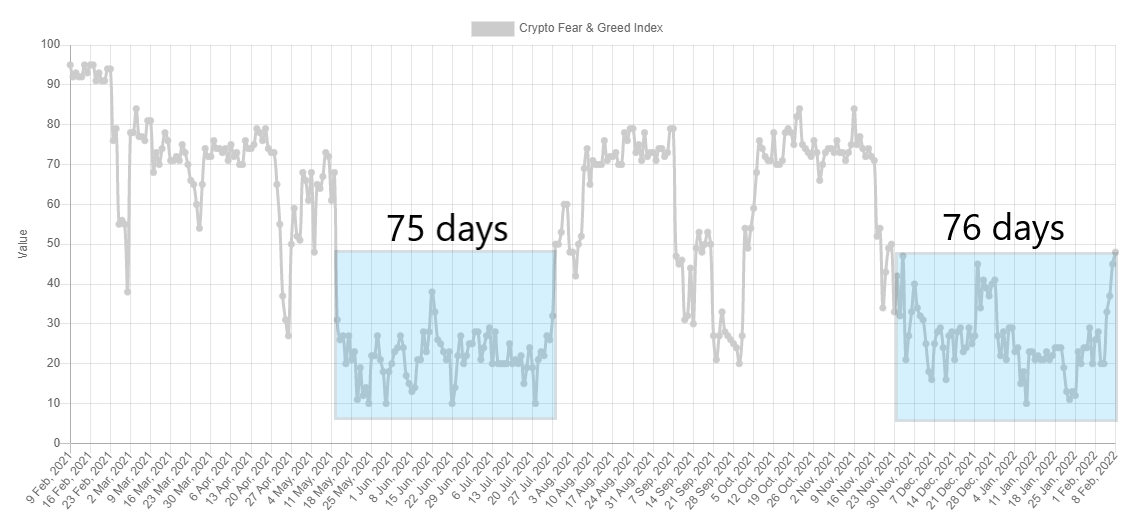
Thus, between November 23, 2021, and February 7, 2022, cryptocurrency market investors experienced fear or extreme fear. This negative sentiment thus persisted for 76 days. Today, for the first time in nearly 3 months, market sentiment has returned to the neutral area.
It is worth noting that the last period of such a long domination of fear on the Fear and Greed Index readings took place during the correction in the summer of 2021. Back then, the negative sentiment was in place from May 13 to July 27, 2021, a period of 75 days. So this is an almost identical correction period in the cryptocurrency market.
TOTALCAP touches $2 trillion again
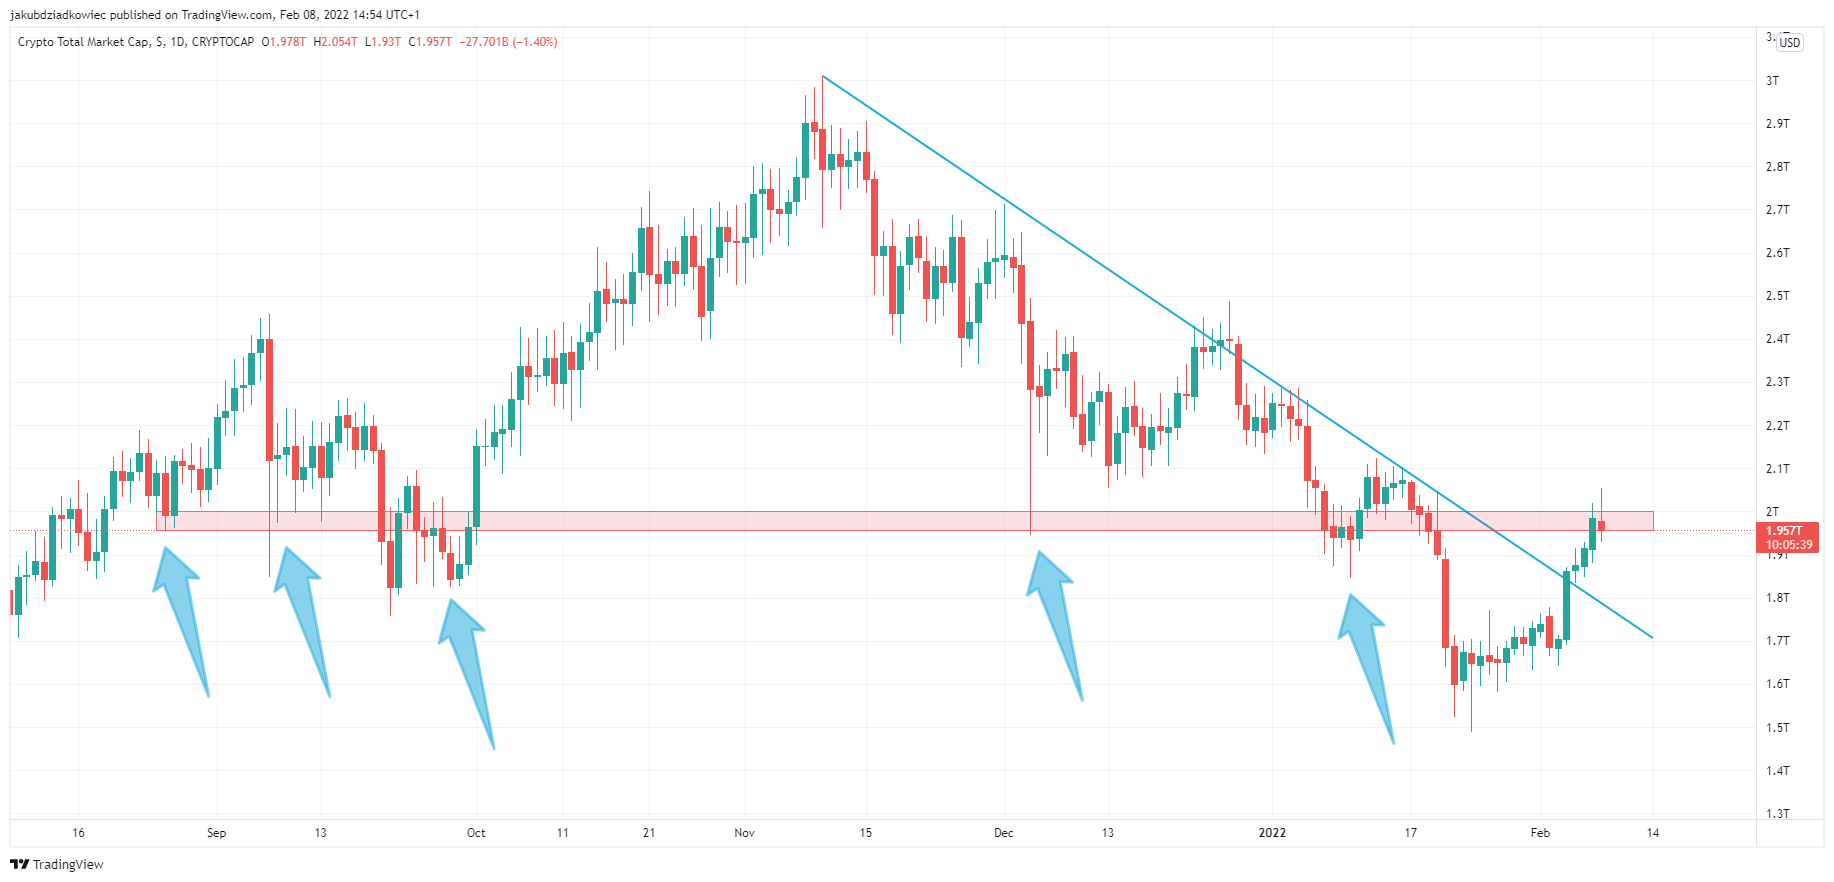
The crypto total market capitalization (TOTALCAP) has been declining since reaching the all-time high of $3 trillion on November 10, 2021. Similar to the Bitcoin (BTC) price, the decline has respected the descending resistance line (blue).
TOTALCAP bottomed at $1.49 trillion on January 24, 2022, and began an upward movement. The breakout initiated on February 4 managed to break through the descending resistance line and attempt to regain the $2 trillion area.
The $1.85-2 trillion area has served several times as an important support level (blue arrows). If TOTALCAP fails to regain it, it could turn into resistance. Therefore, reclaiming this area and confirming it as support is significant for the continuation of the uptrend in the cryptocurrency market.
For BeInCrypto’s latest Bitcoin (BTC) analysis, click here.


