


Fantom’s recent price trends and on-chain data show that many FTM holders find themselves ‘in the money.’ With current patterns suggesting a test of the support levels at $0.76, investors and traders cast a critical eye on FTM charts for the next decisive move.
Can Fantom’s technological prowess keep breaking past resistance levels, or will it succumb to bearish pressures?
Fantom Transaction Volume
On March 3, 2024, the transaction volume for Fantom (FTM) in USD achieved a significant milestone, hitting $235 million. This was the largest daily volume recorded since February 11, 2023, highlighting a substantial peak in trading activity.
Analyzing the growth in transaction volume over the month, we observe a remarkable ascent from $8.3 million on February 6, 2024, to $73 million by March 3, 2024. This translates into a staggering increase of approximately 780%. During this same period, there was a strong positive correlation with Fantom’s price, which climbed from $0.36 to $0.64.
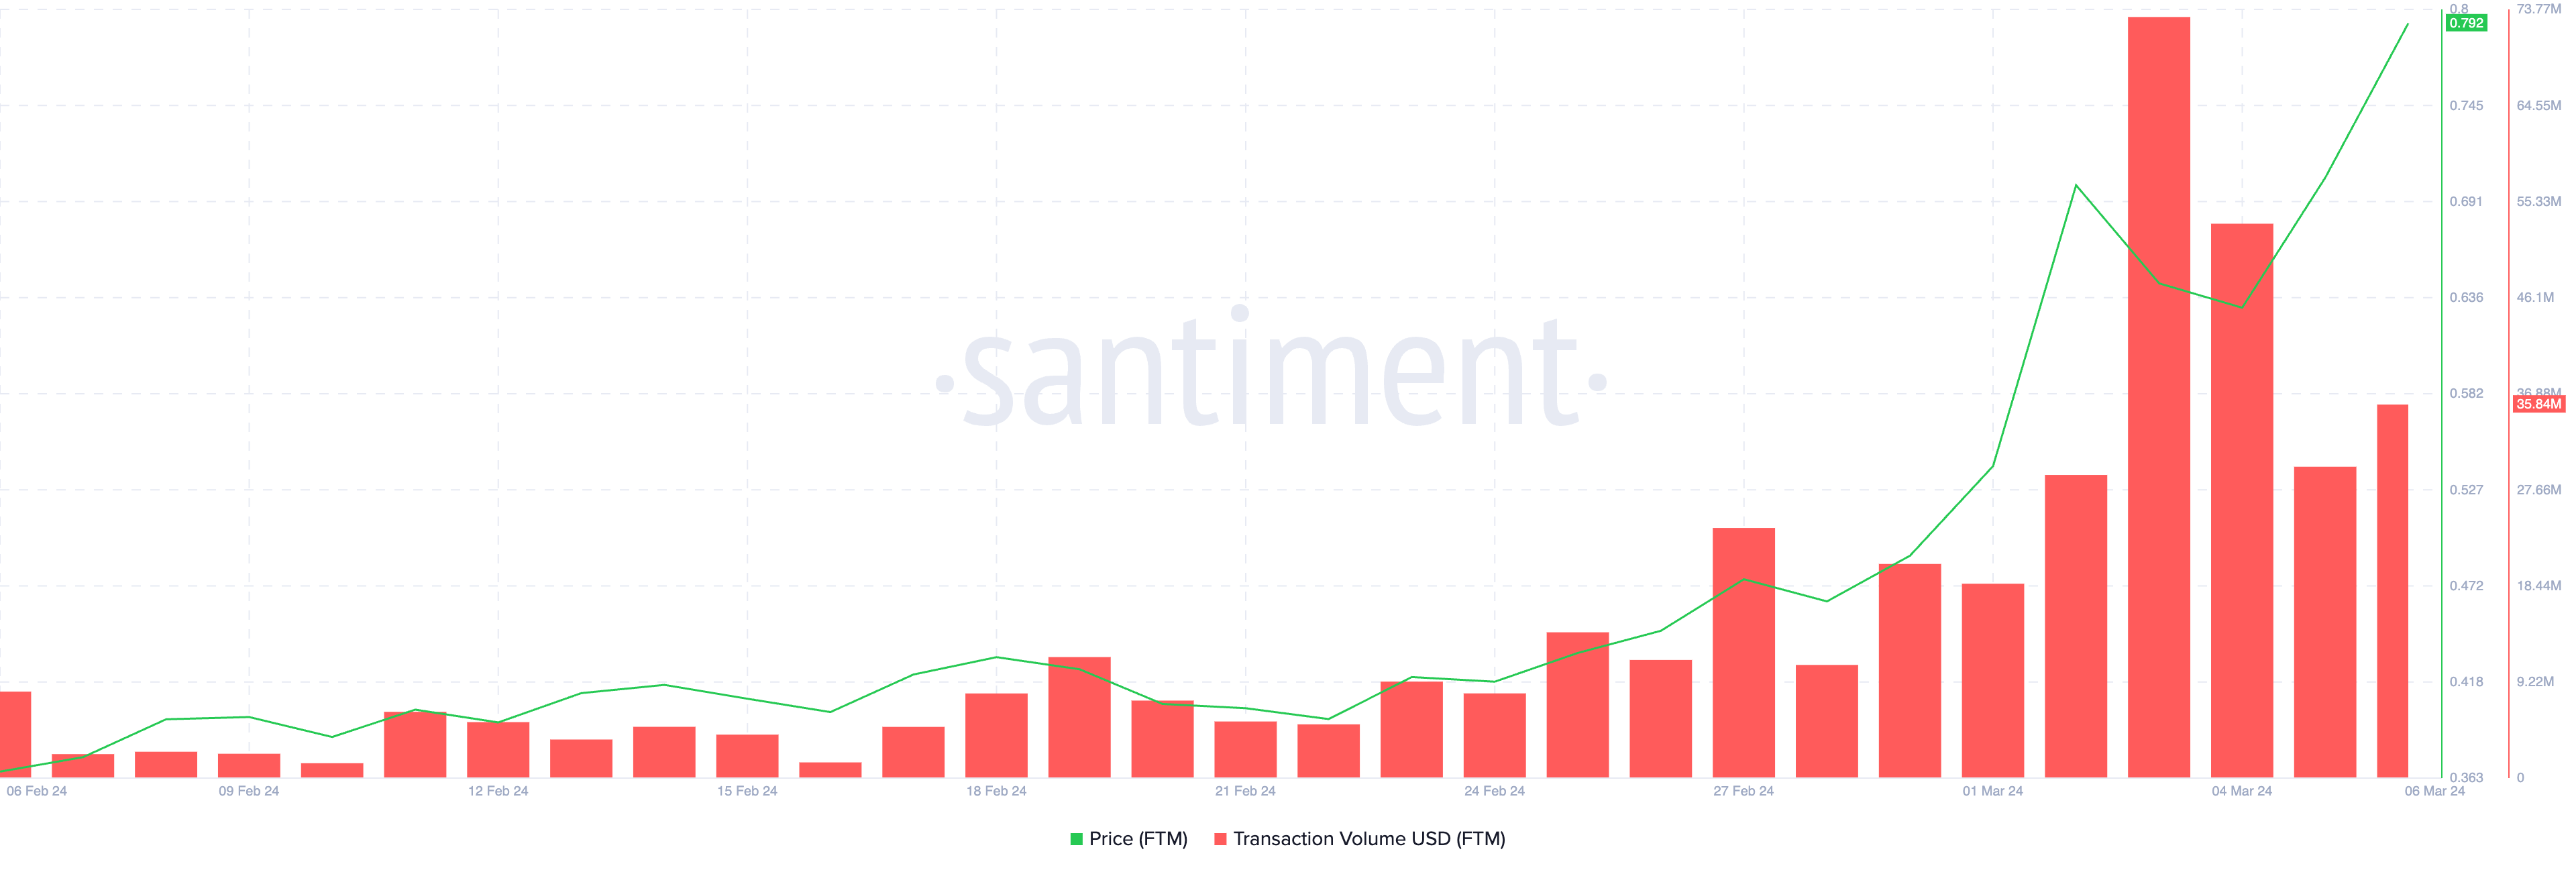
However, the transaction volume witnessed a downturn from the peak of $73 million on March 3 to $35 million by March 6. A decline of over 50% in transaction volume within such a short span could point to a cooling off of activity.
This drop in volume could potentially affect the price negatively. This happens because the decreased volume may imply a reduction in trading interest or network utilization.
However, even with transaction volume declining in the last few days, it’s still way above its previous metrics from the beginning of last month, which can be interpreted as a bullish signal.
Almost 50% of FTM Holders Still Holding Losses
This week, a notable 52.25% of FTM token holders are seeing profits from their investments, potentially leading to an increased inclination towards selling to secure these gains. Conversely, a significant portion, consisting of 48,800 addresses, which accounts for 46.12%, are currently facing losses.
Should the price of FTM edge closer to its respective break-even points, it’s conceivable that these holders might be prompted to sell their holdings to reclaim their initial investment.
Such actions could feasibly result in heightened selling pressure, serving as a formidable barrier against any potential upward price trends. Consequently, this scenario could usher in a phase of price stabilization or potentially trigger a market correction, dampening the upward momentum.
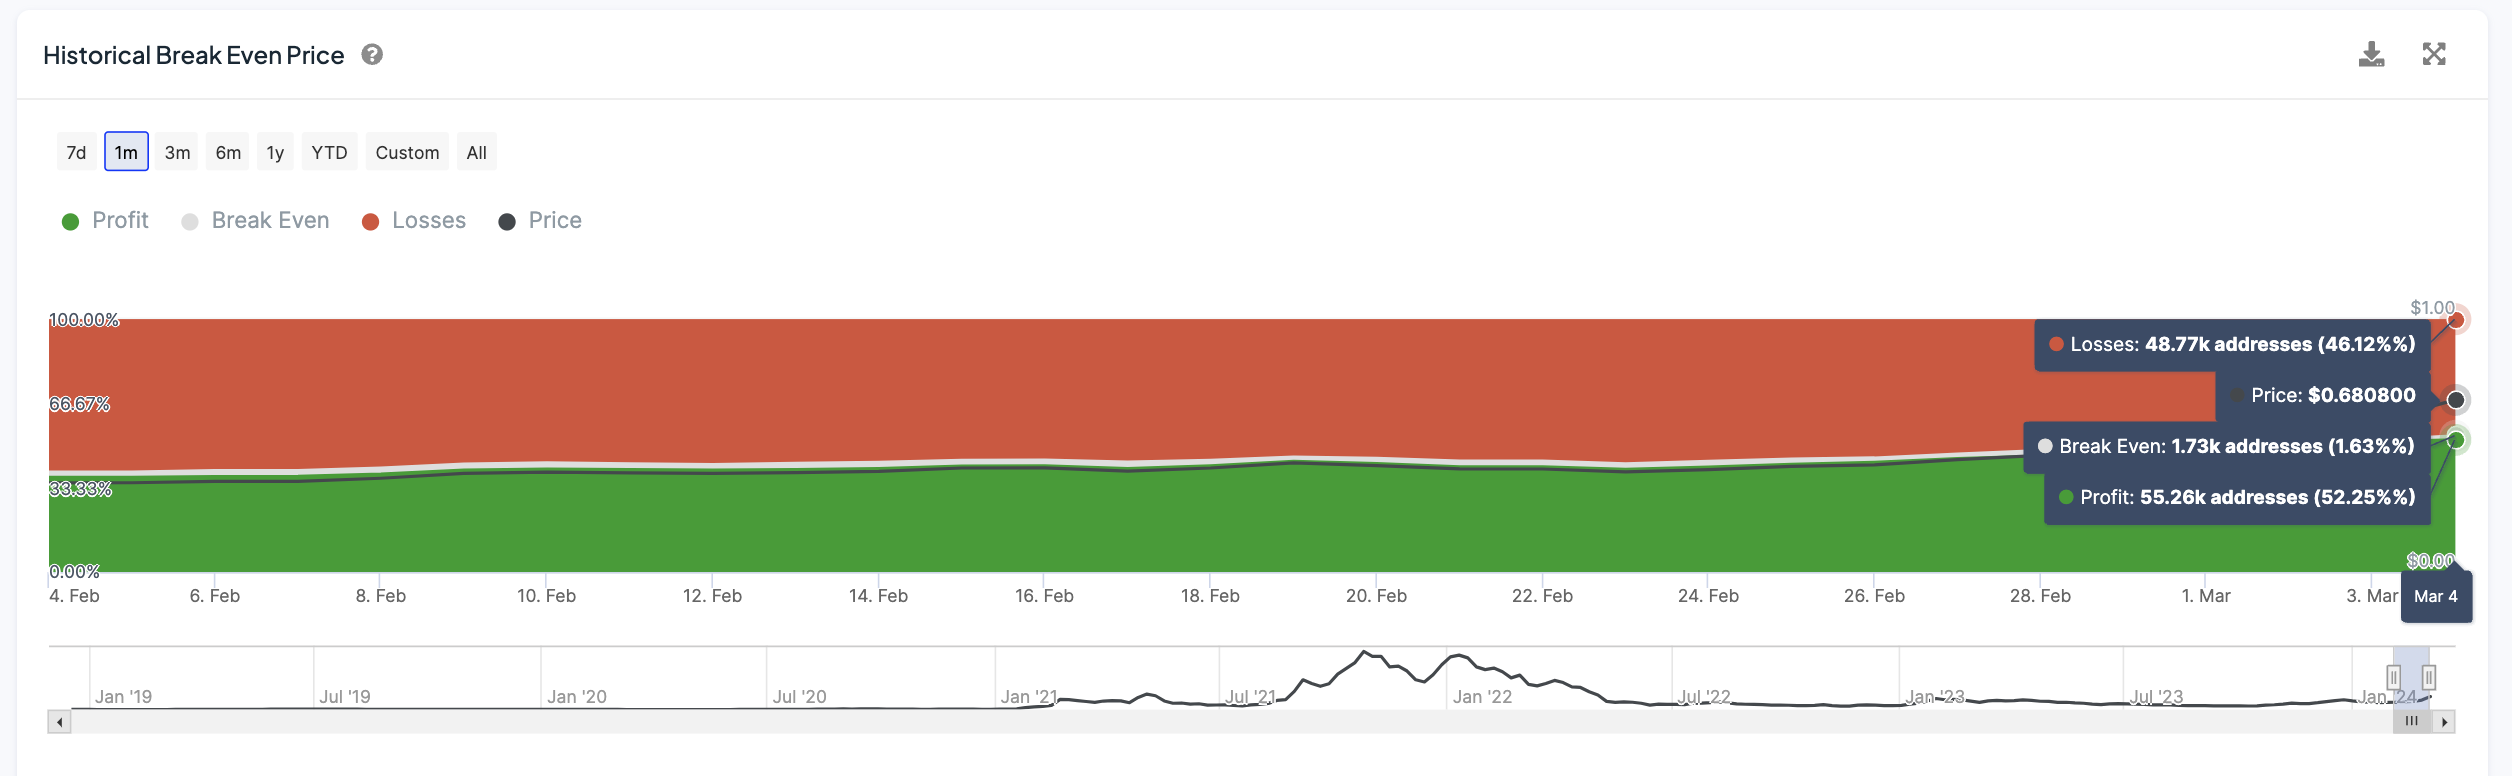
Additionally, around 1,730 addresses, representing 1.63%, find themselves at the break-even point. While seemingly insignificant, this group could nonetheless exert a noticeable impact on market dynamics, particularly if the price experiences notable fluctuations.
The presence of nearly half of the token holders still enduring losses, despite FTM’s impressive surge of 70% in a single week, underscores a compelling argument that substantial potential exists for further price appreciation. This situation mirrors the underlying sentiment that Fantom’s valuation has not fully realized its growth trajectory, suggesting a promising outlook for future price developments.
Fantom Price Prediction: Is FTM headed to $0.96 This Month?
Most addresses, approximately 83.04% or 2,930, are “In the Money,” indicating they purchased FTM at prices below the current price of $0.83. This creates a strong foundational support zone around $0.73 to $0.75, where a significant number of purchases occurred.
Read More: 9 Best Fantom (FTM) Wallets in 2024
The bullish sentiment will likely continue as long as the price stays above this level. The next resistance zone seems to be just above the current price, around $0.85 to $0.88. A break above this zone could validate a continued uptrend, and if the momentum is strong enough, the price may test the next resistance level near $0.93 to $0.96.
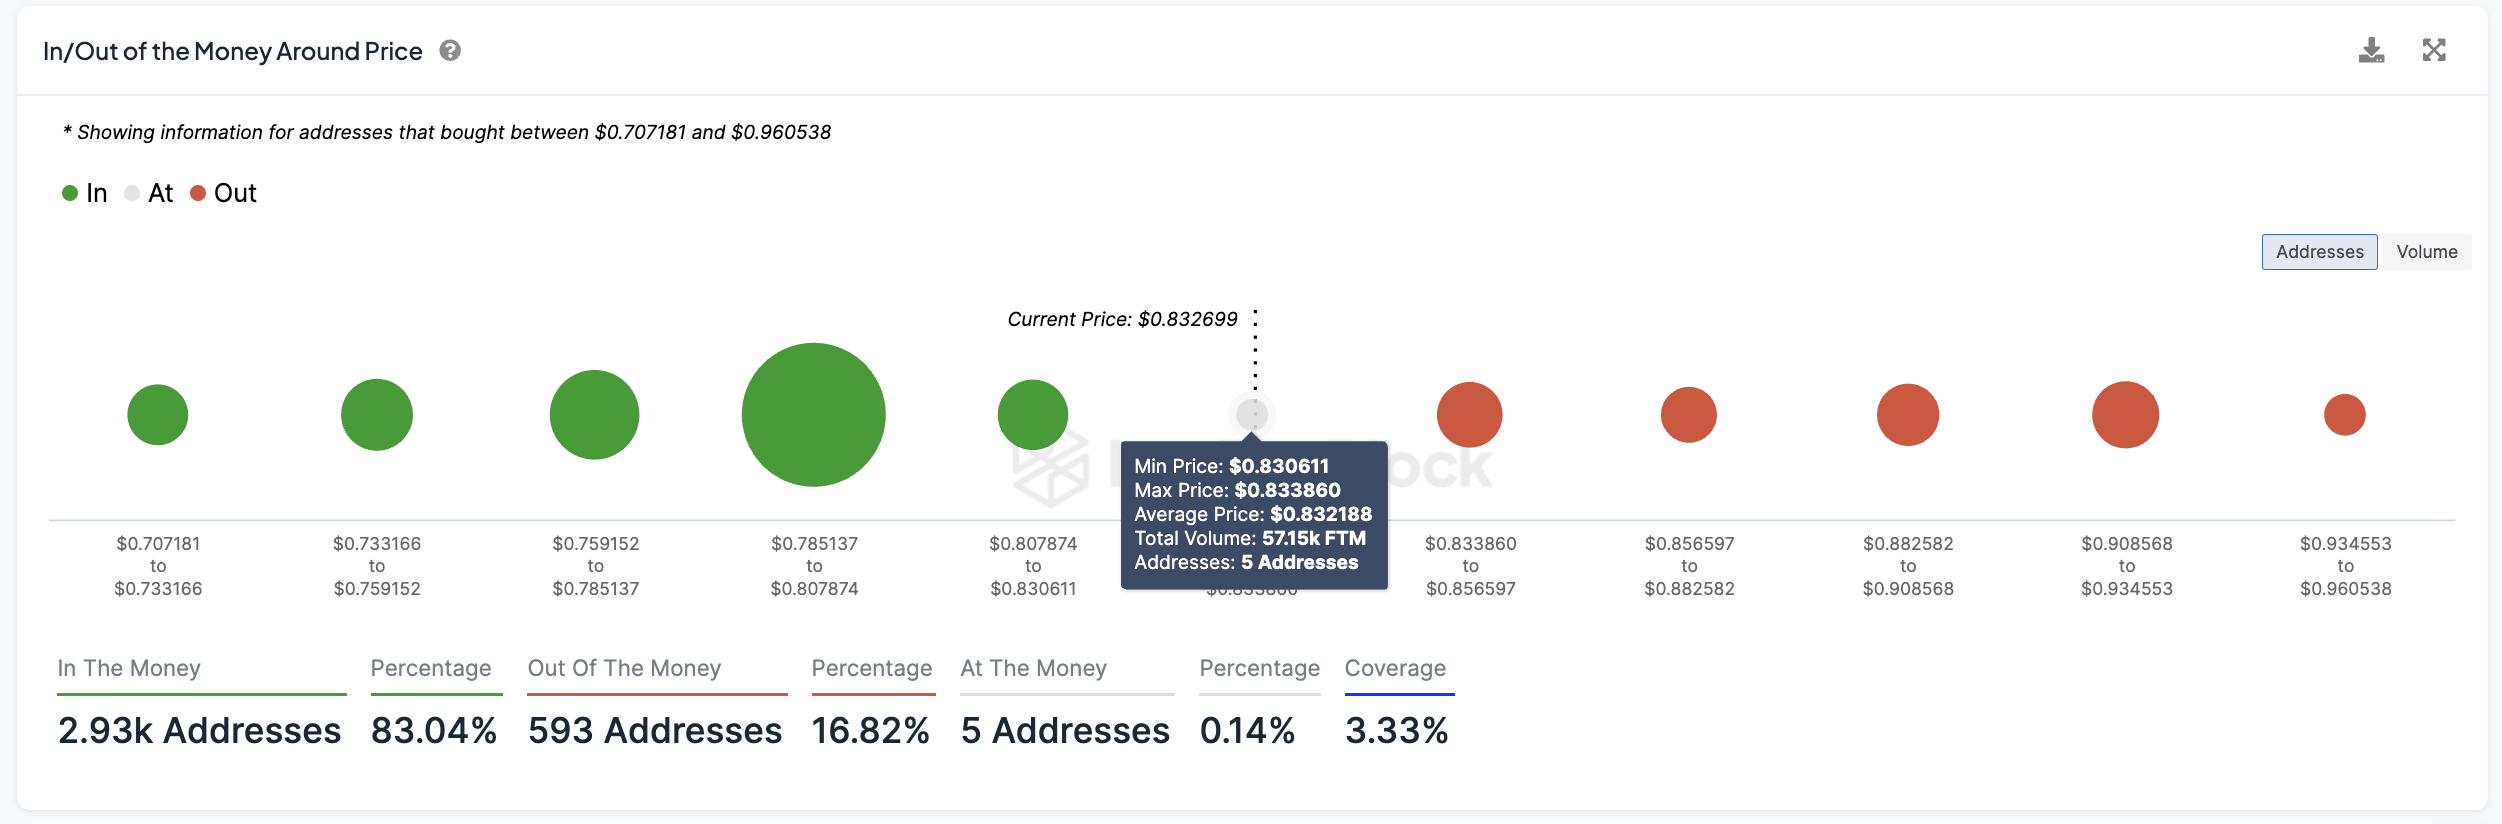
Conversely, 16.82% of holders are “Out of the Money,” potentially creating a selling pressure zone near the current price. This group selling to mitigate further losses could push the price down towards the major support zone. A fall below the support zone would reinforce the bearish scenario, possibly retesting lower supports at $0.70 or less.
A breakthrough of the immediate resistance by bullish momentum could establish a new target price in the $0.93 to $0.96 range. However, a downturn below the strong support at $0.73 might lead to further declines, targeting lower supports. The behavior of holders at these key levels will be instrumental in determining the direction of the price movement.


