


In this article, BeInCrypto looks at the price movements for seven different altcoins, one of them being Fantom (FTM), which has just reached a new all-time high.
BTC
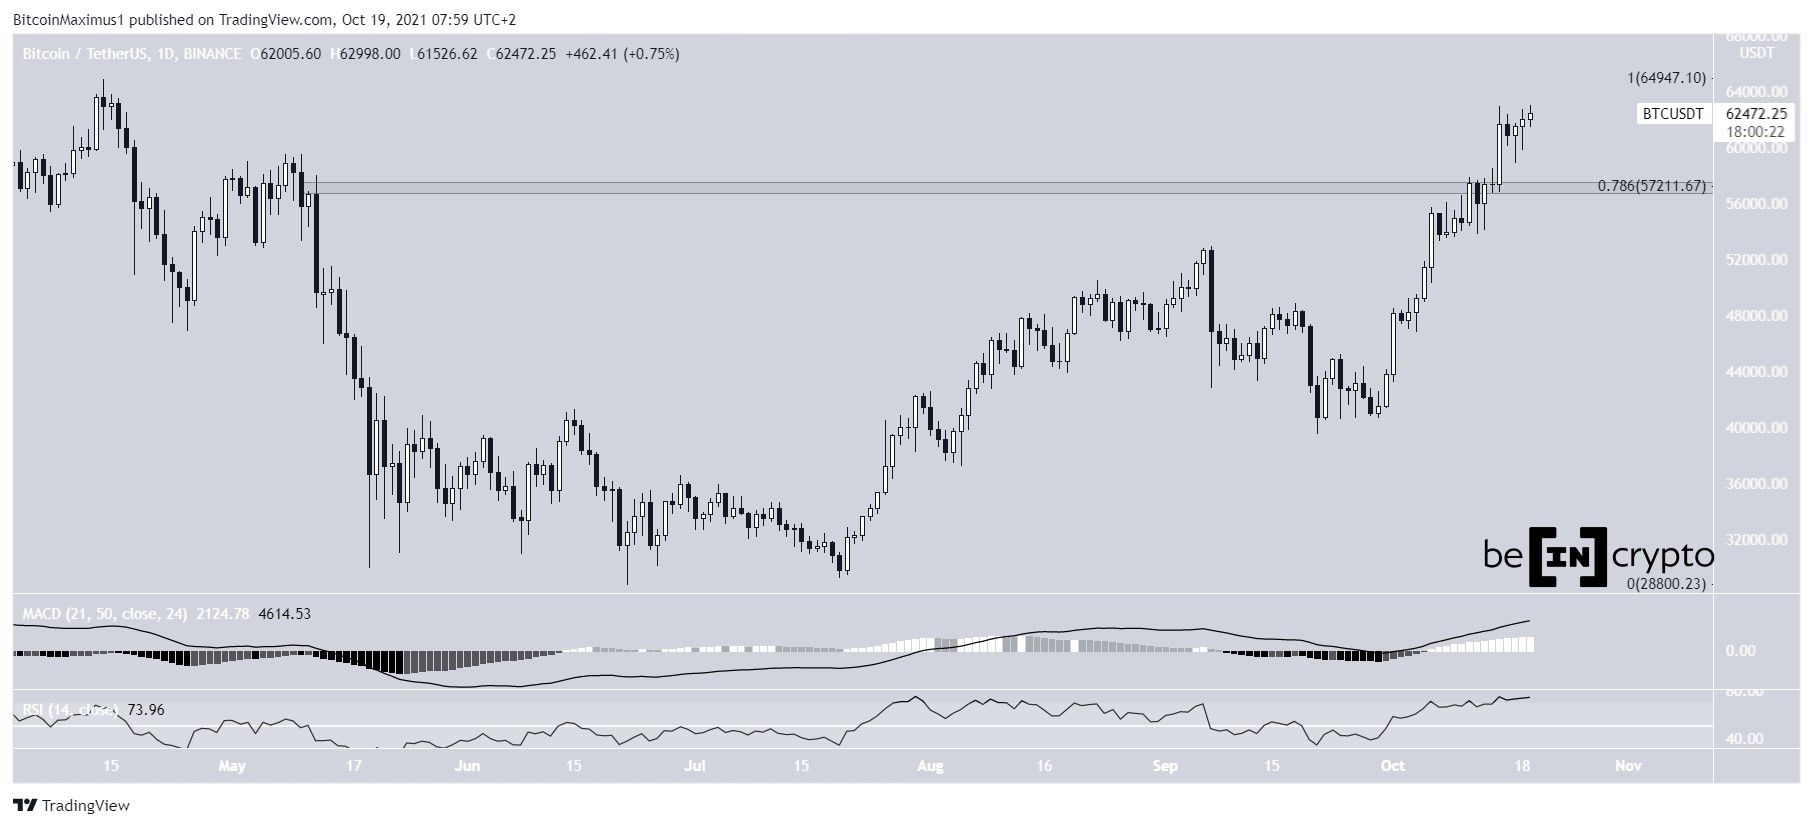
The daily chart for BTC has been showing a bullish outlook since the breakout from the $57,200 resistance area on Oct 15. This was both a horizontal resistance area and the 0.786 Fib retracement resistance level. Furthermore, it’s the final resistance area prior to passing the $64,854 all-time high price.
In addition to this, technical indicators are bullish.
The MACD is increasing and is positive. This means that the short-term trend is increasing at a faster rate than the long-term one.
The RSI movement above 70 is another bullish sign, showing that momentum is still strong, even if the trend is overbought.
ETH
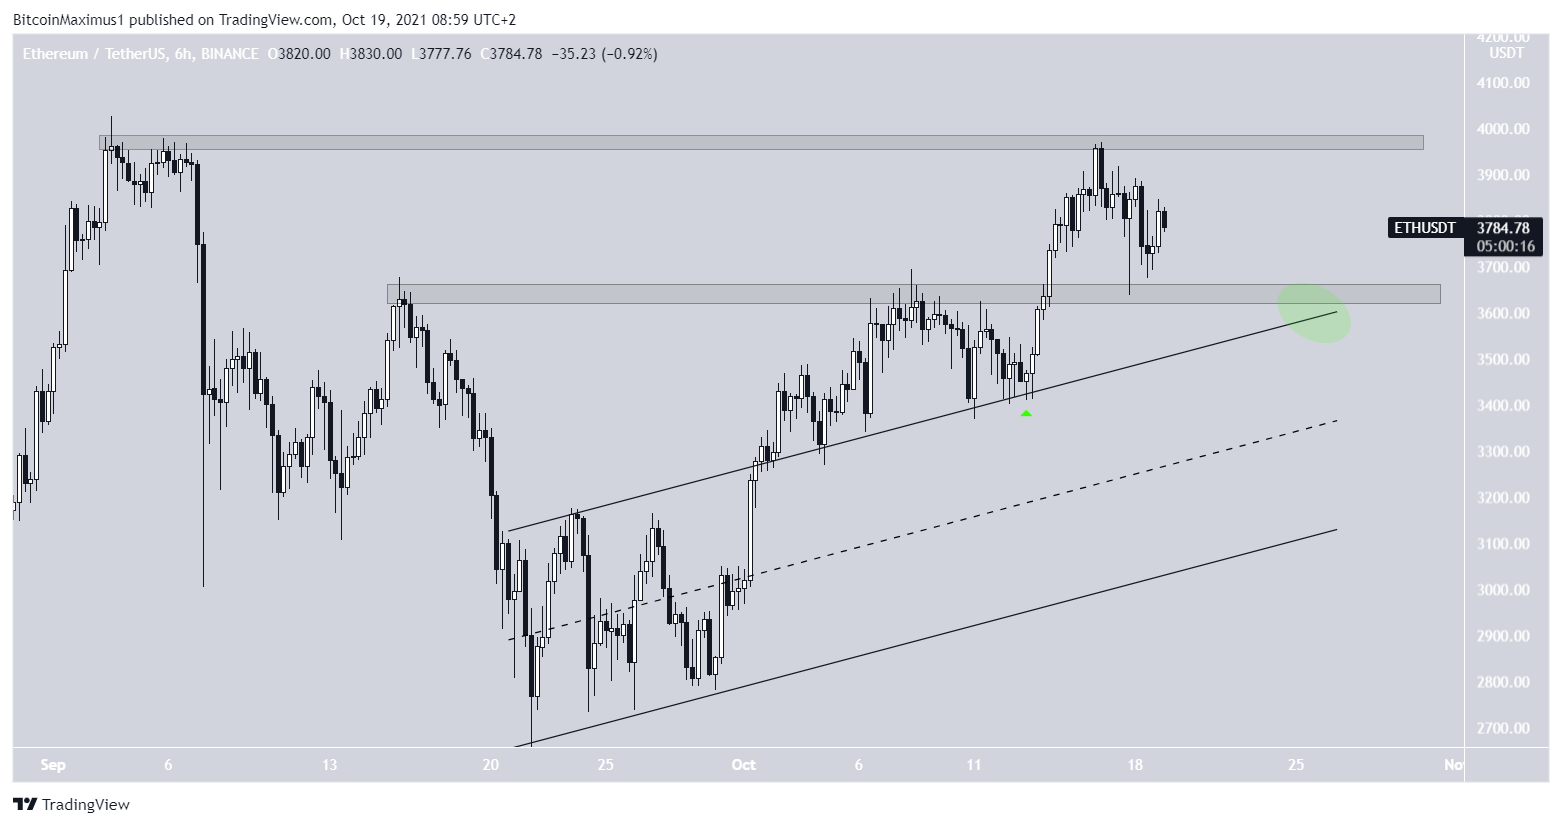
ETH has been moving upwards at an accelerated rate since breaking out from an ascending parallel channel and rebounding from its resistance line on Oct 13 (green icon). Now, the previous resistance line is expected to act as support.
The line also coincides with the $3,650 horizontal area, which is also expected to act as support.
The primary resistance area is found at $3,970, created by the September highs. A breakout above this level would likely trigger an acceleration of the upward move.
XRP
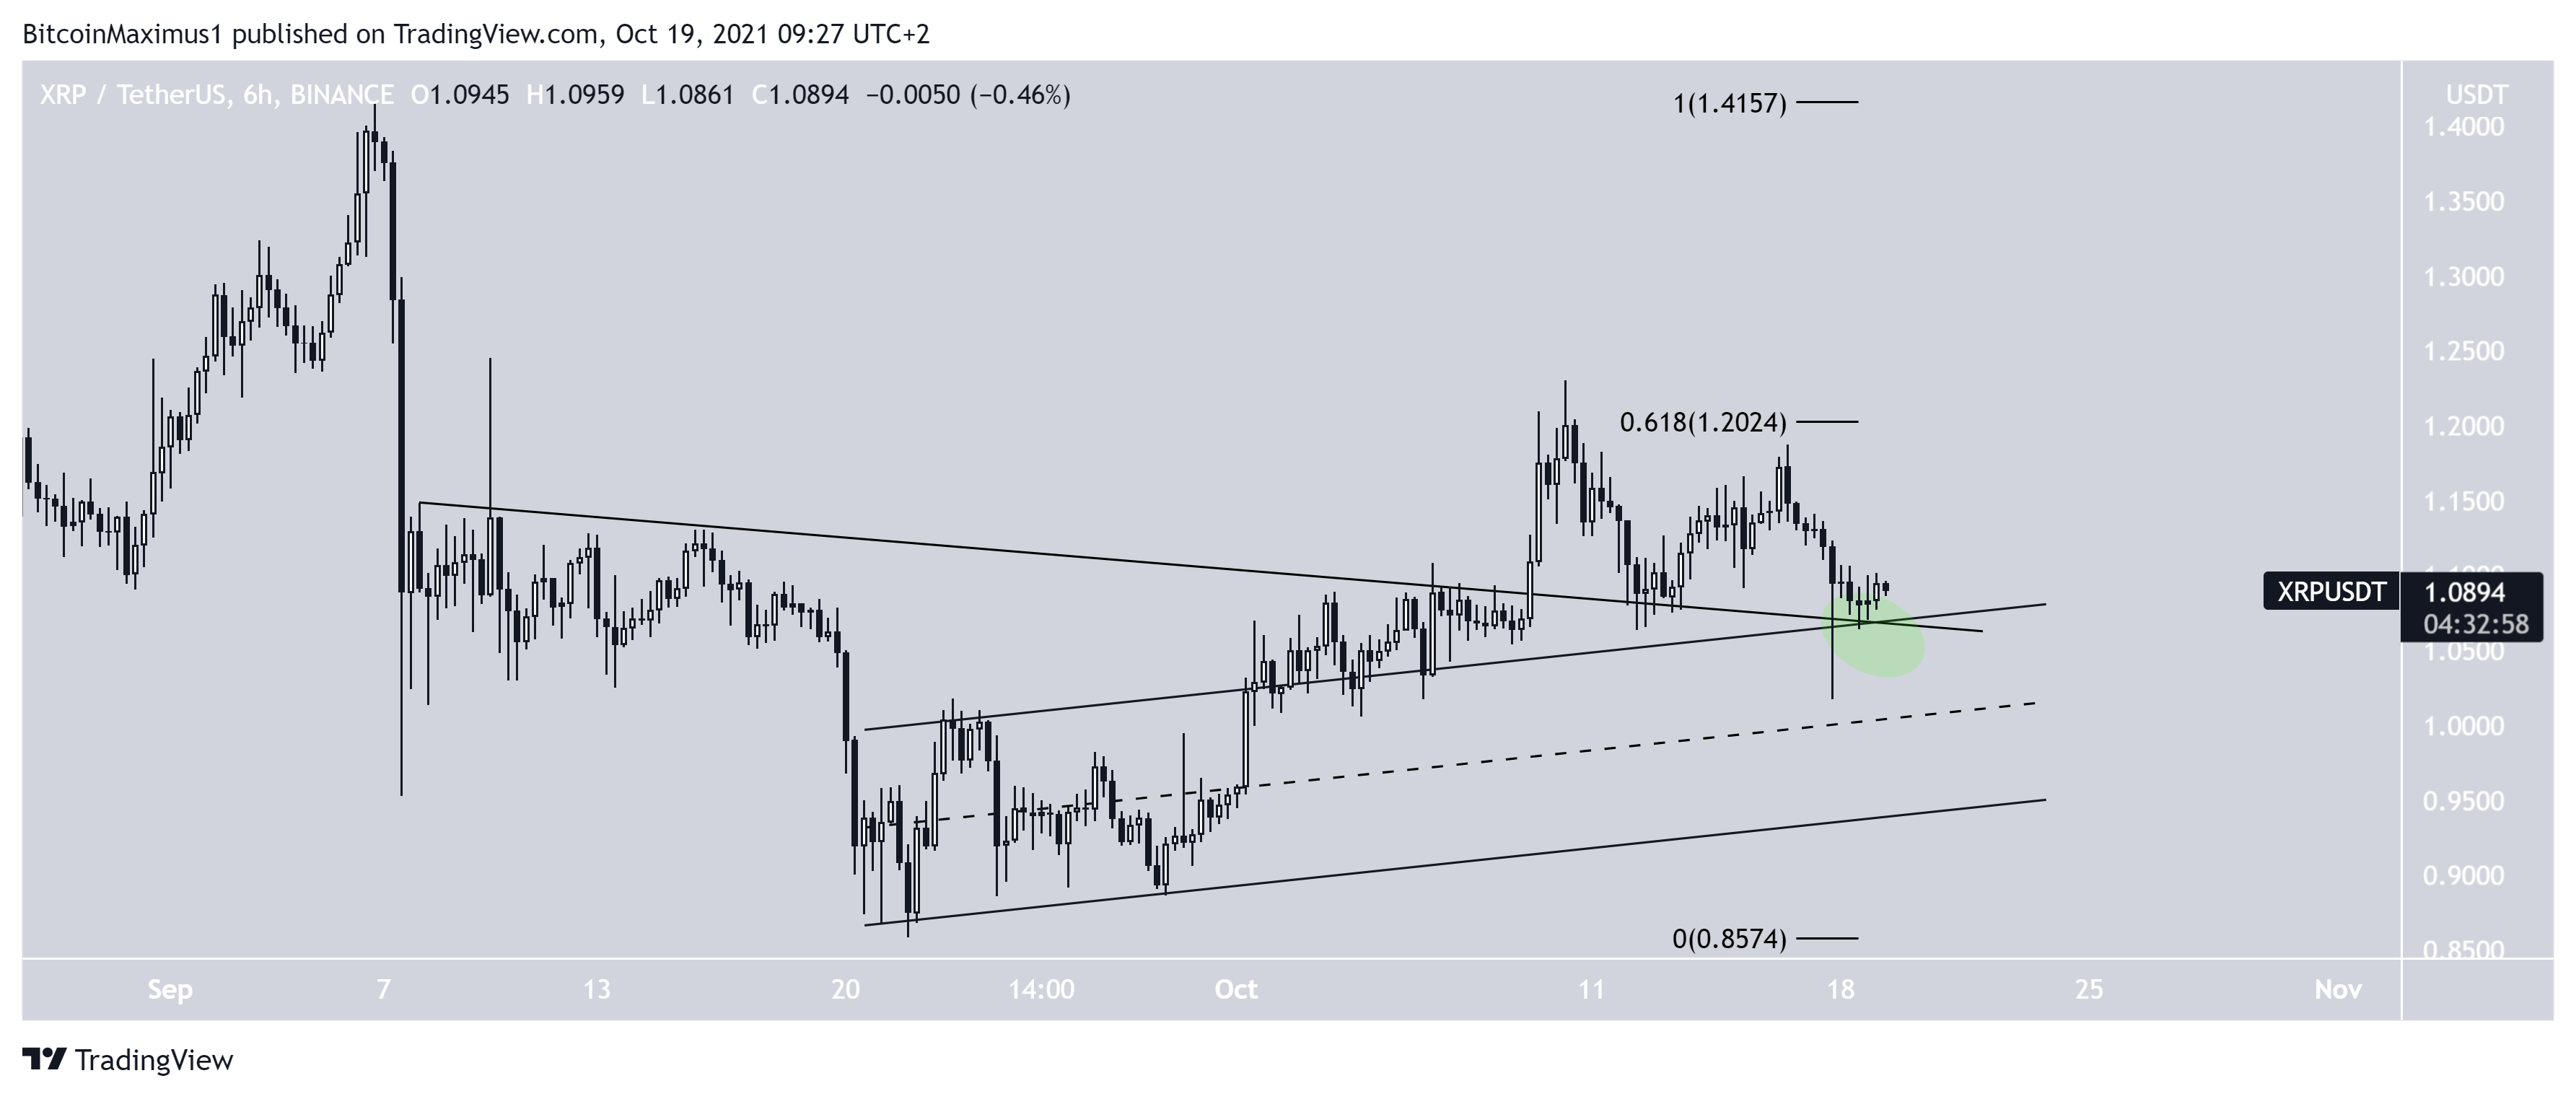
Similar to ETH, XRP broke out from an ascending parallel channel at the beginning of October. Following this, it was rejected by the $1.20 resistance area. This is the 0.618 Fib retracement resistance level, which is most common to act as resistance after bounces.
While XRP has been moving downwards since then, it has now reached a confluence of support levels (green circle). The support is created by the resistance line of the channel and another descending resistance line.
Therefore, despite there not being any clear bullish reversal signs, XRP is at a level very likely to push the price back up.
XMR
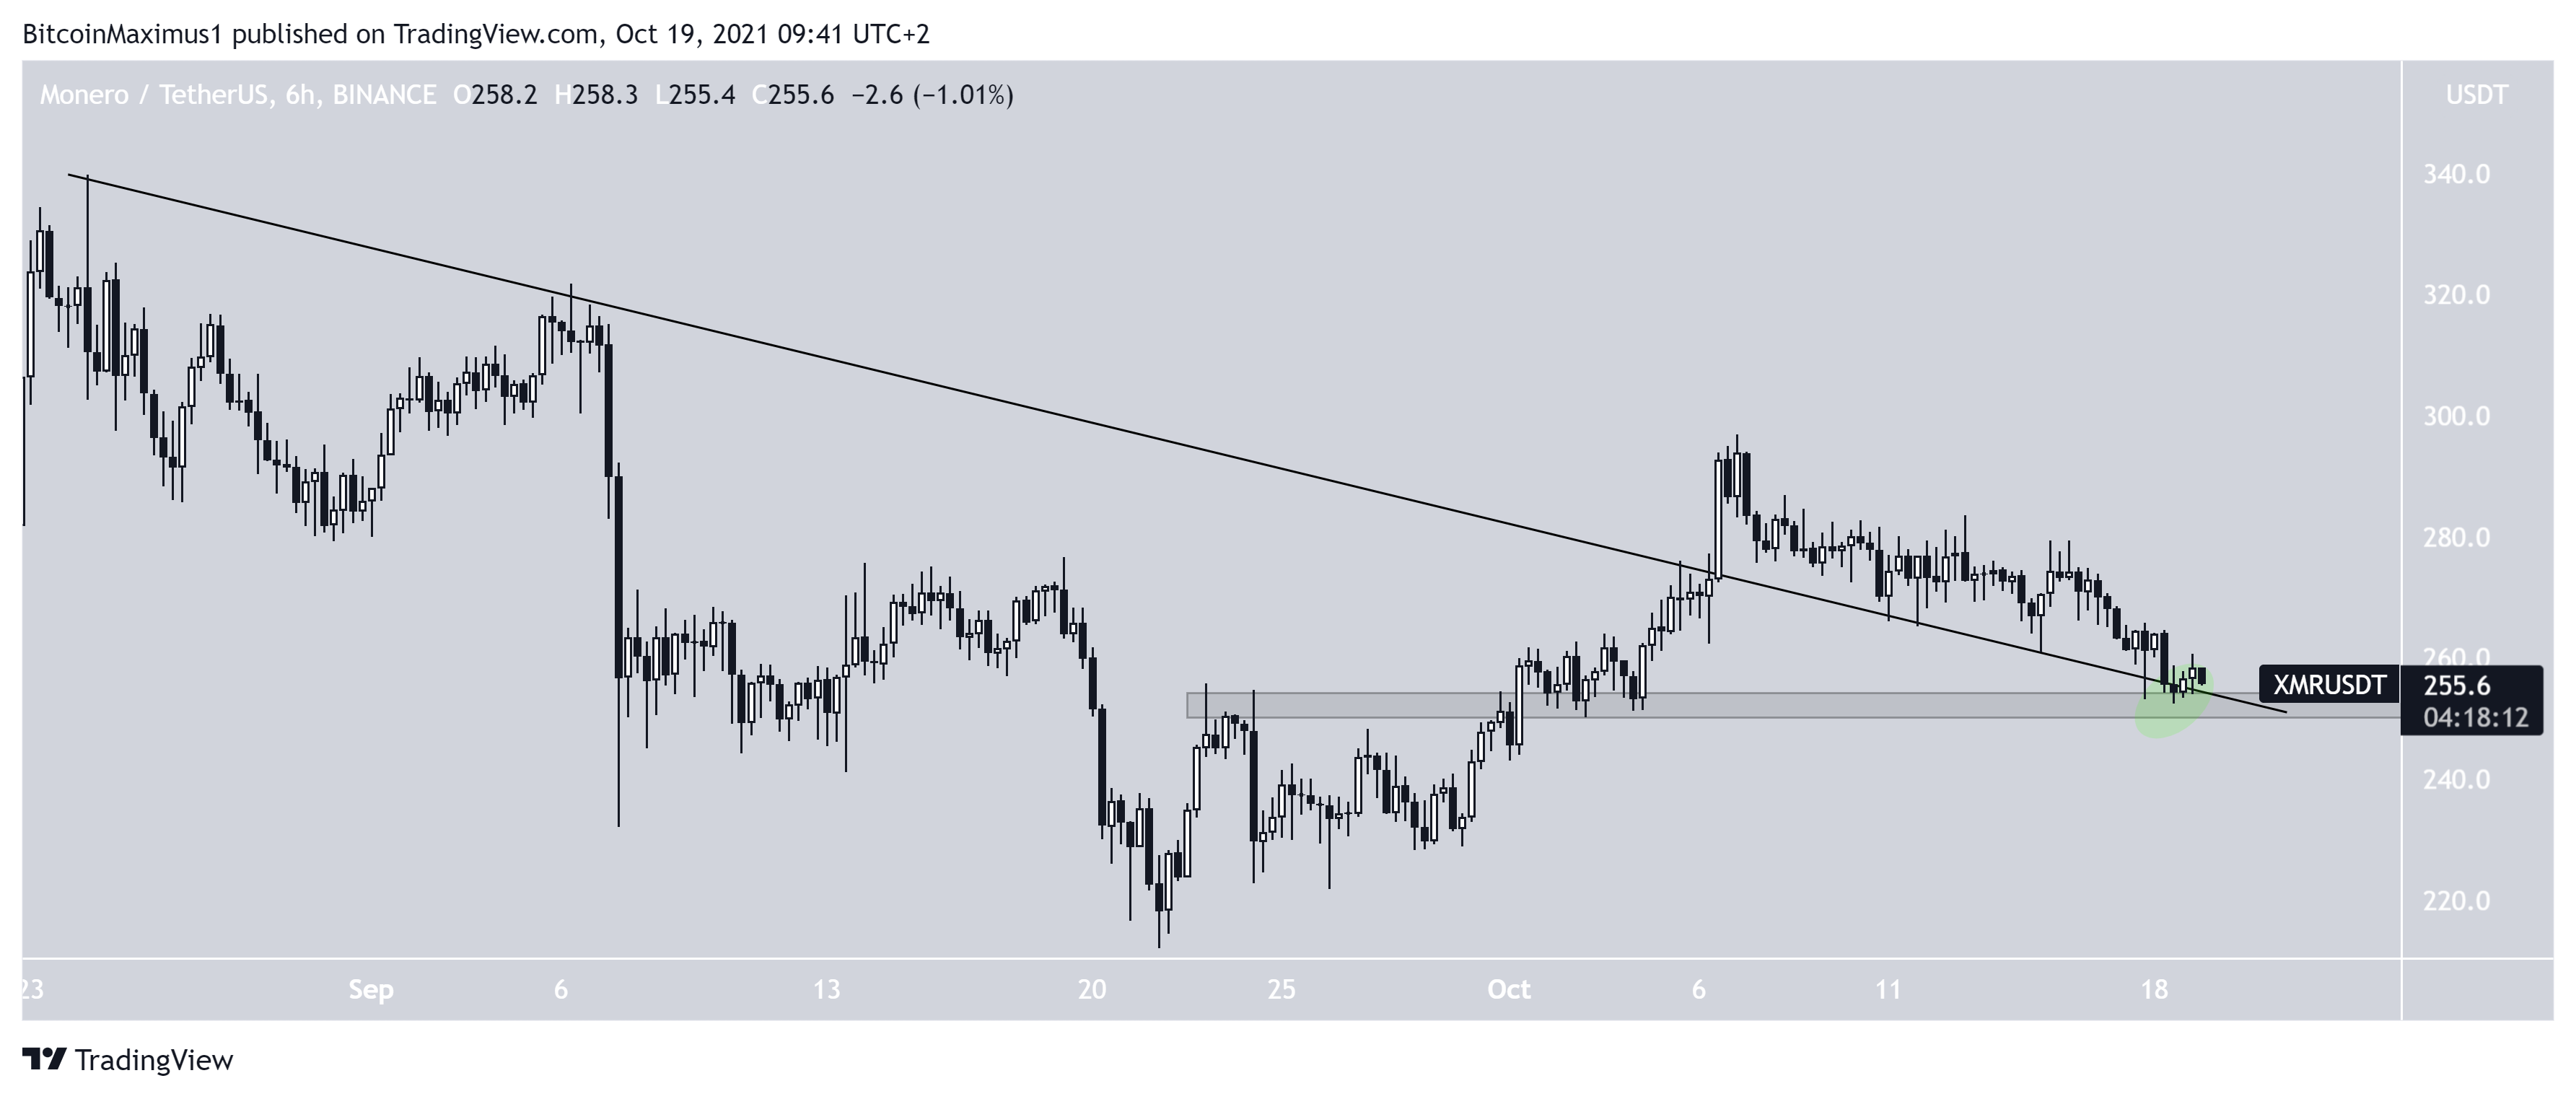
XMR had been decreasing under a descending resistance line since Aug 24. This was a sign that it was in a corrective period.
The XMR trend reversed and broke out above the line on Oct 7. However, it failed to sustain the upward movement and has been decreasing since.
Similar to XRP, there are no bullish reversal signs showing yet. However, XMR is trading above a confluence of support levels (green circle), created by the previous descending resistance line and the $250 horizontal support area.
REEF
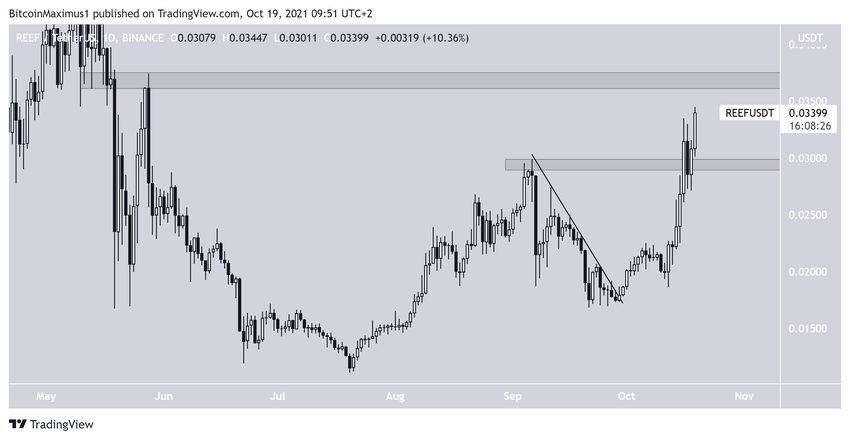
REEF has been moving upwards since breaking out from a descending resistance line on Sept 30. This signaled that the previous downward move had come to an end. After creating a higher low on Oct 12, it began to accelerate quicker.
On Oct 16, REEF broke out from the September highs at $0.029. Currently, it’s facing resistance at $0.037. If REEF manages to clear this resistance, the next would be found at the all-time highs near $0.055.
FTM
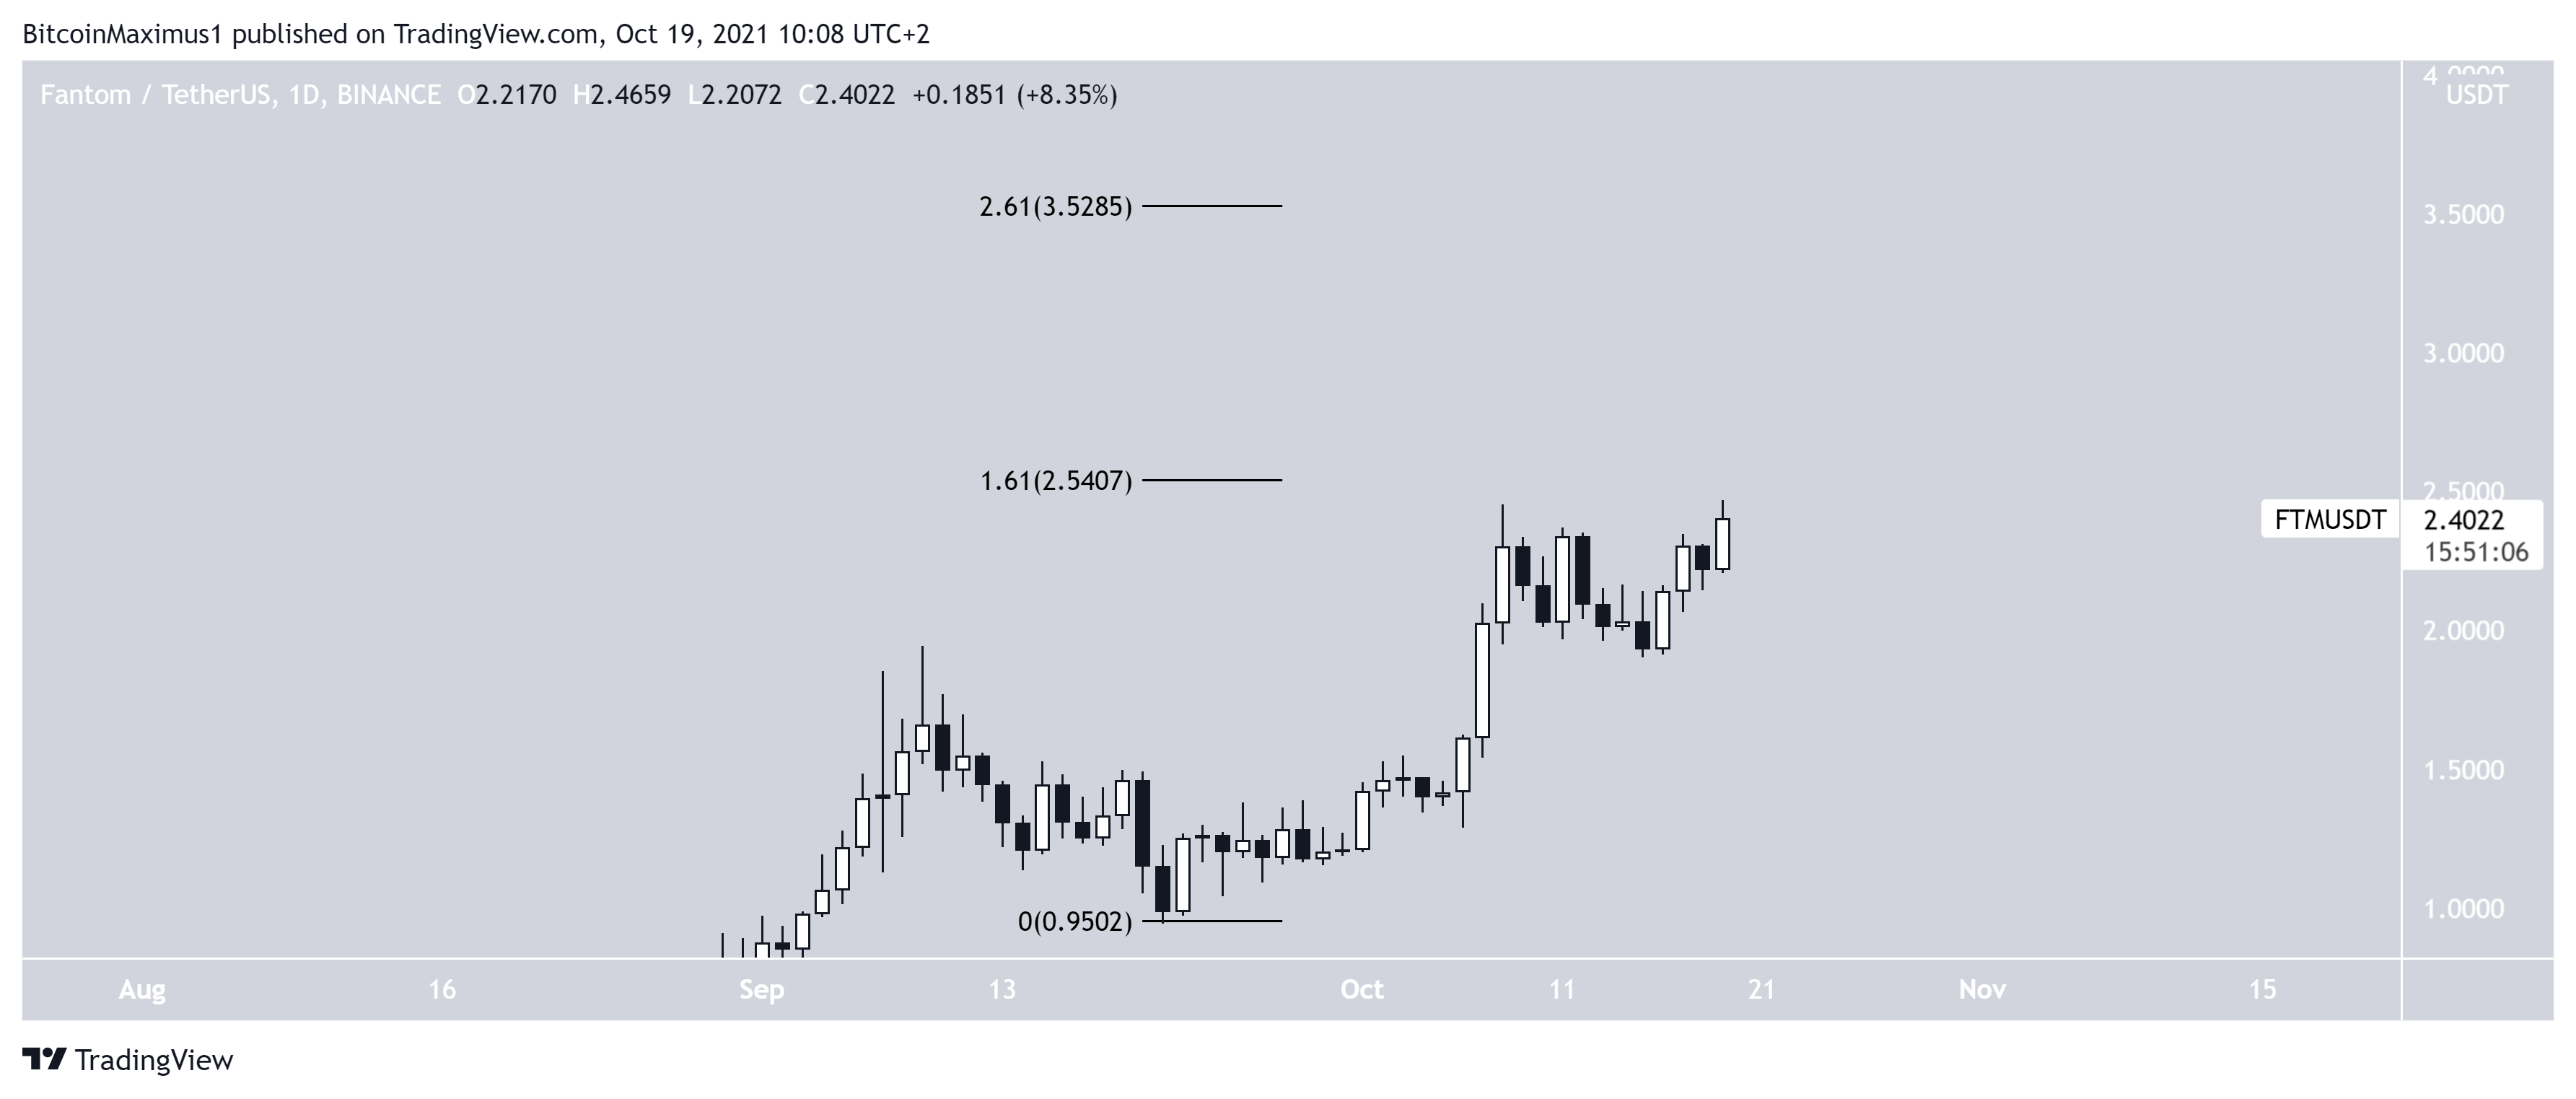
FTM has been moving upwards at an accelerated rate since Sept 22. On Oct 8, it reached a then all-time high price of $2.45.
After a short corrective period, it began another upward move and reached yet another all-time high on Oct 19.
The next closest resistance area is found at $3.52. This is the 2.61 external Fib retracement resistance level when measuring the most recent drop. Whenever a token reaches a new all-time high, such levels are often used to find resistances due to the lack of established overhead horizontal resistances.
CAKE
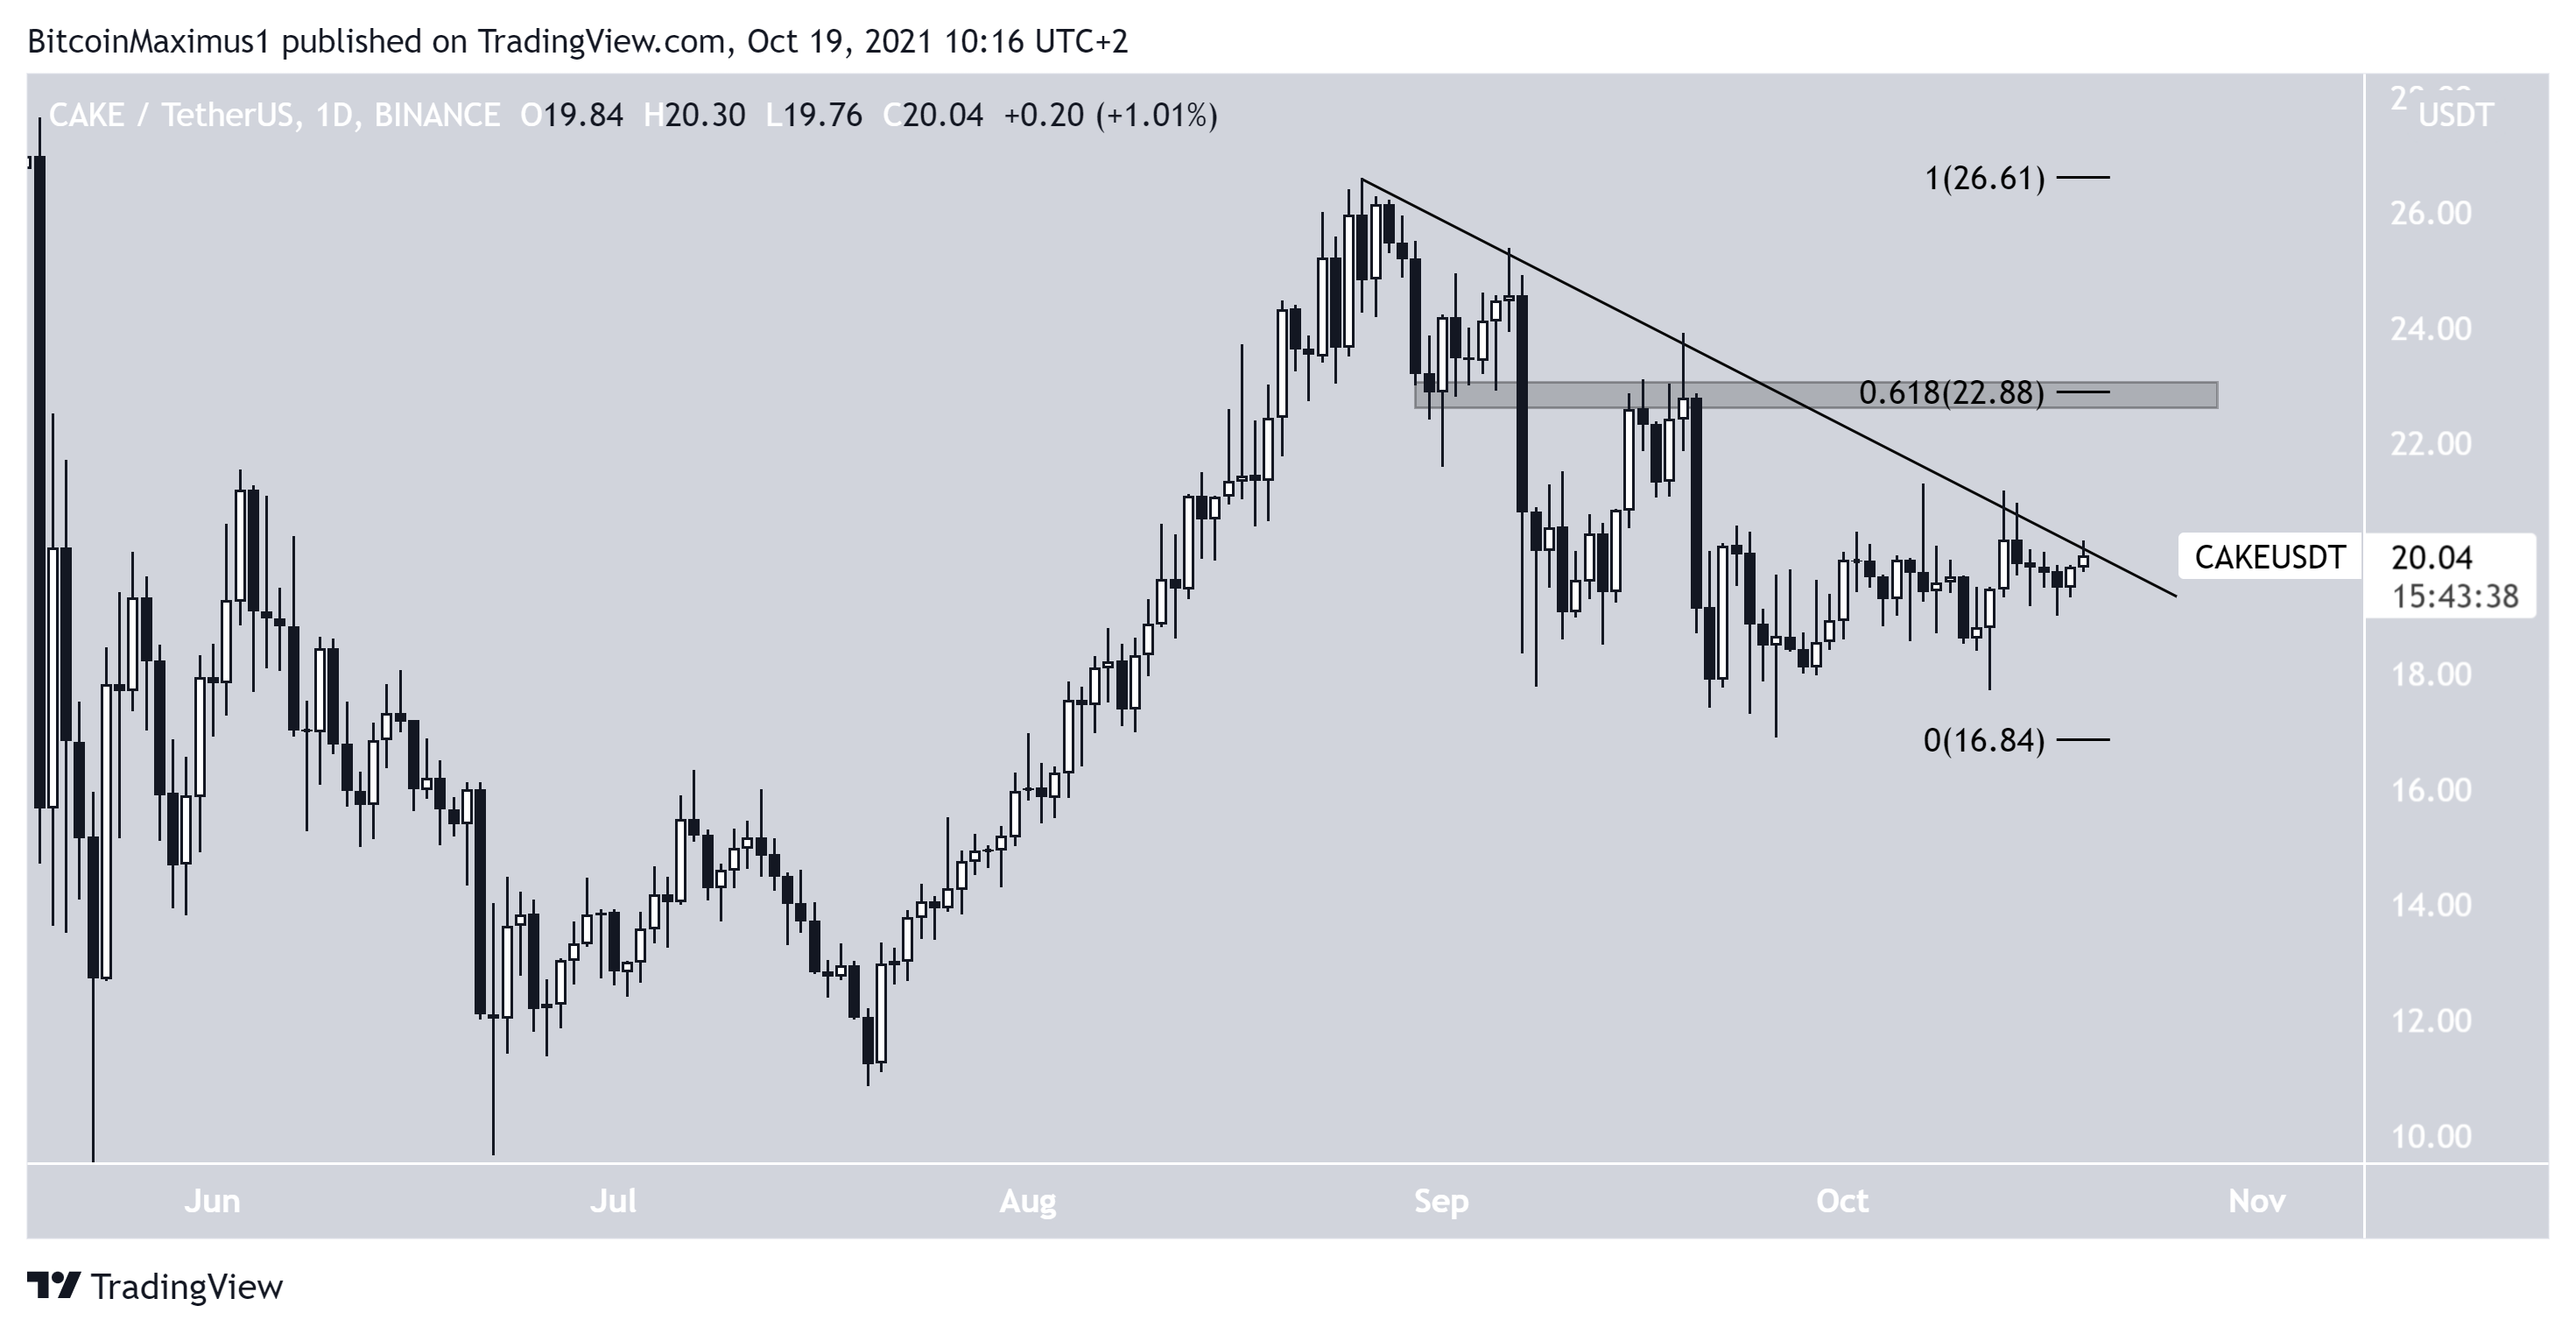
CAKE has been following a descending resistance line since Aug 16. This is a sign that it’s correcting.
While CAKE has made several attempts at breaking out, most recently on Oct 13, it hasn’t been unsuccessful so far.
If a breakout occurs, the closest resistance area would be found at $22.88. This is the 0.618 Fib retracement resistance level and a horizontal resistance area.
For BeInCrypto’s previous Bitcoin (BTC) analysis, click here.


