Fantom (FTM) has been decreasing inside a corrective pattern since Jan 22 and is approaching a long-term horizontal support area.
FTM has been decreasing since reaching a high of $3.37 on Jan 17. So far, it has reached a low of $1.07 on March 14. This amounted to a new yearly low and even took the price below the Dec 2021 lows at $1.14.
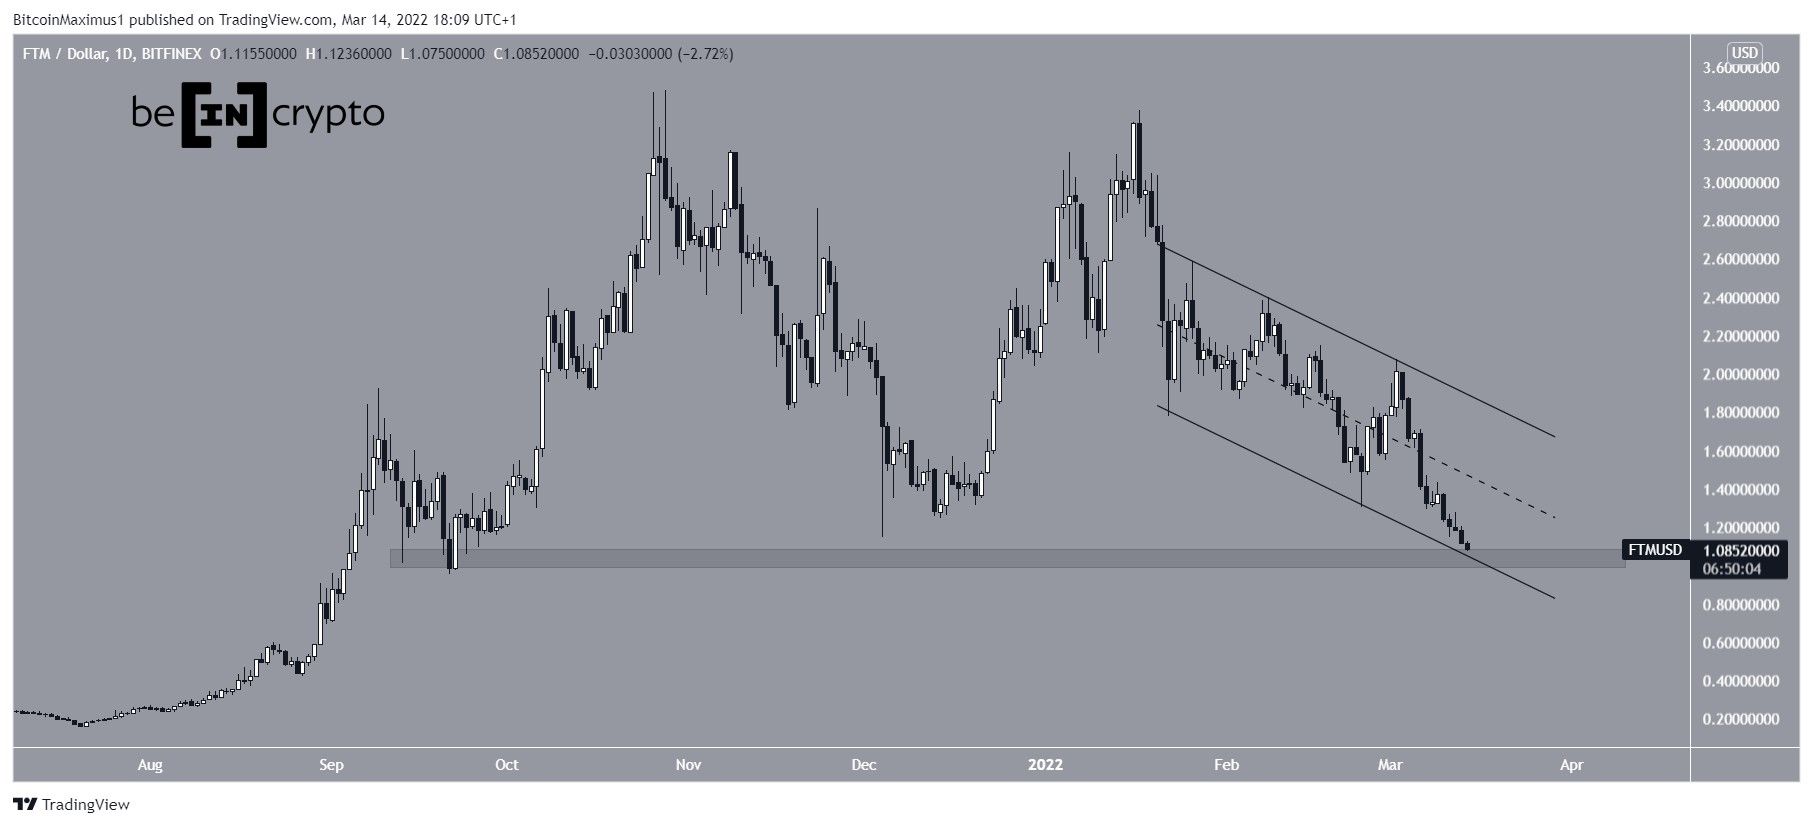
Since Jan 20, FTM has been trading inside a descending parallel channels. Such channels usually contain corrective structures, meaning that an eventual breakout from it would be likely.
FTM is currently approaching the $1.03 horizontal support area. The area was previously reached on Dec 2021. Since it coincides with the support line of the channel, it is possible that it will initiate a bounce.
Future movement
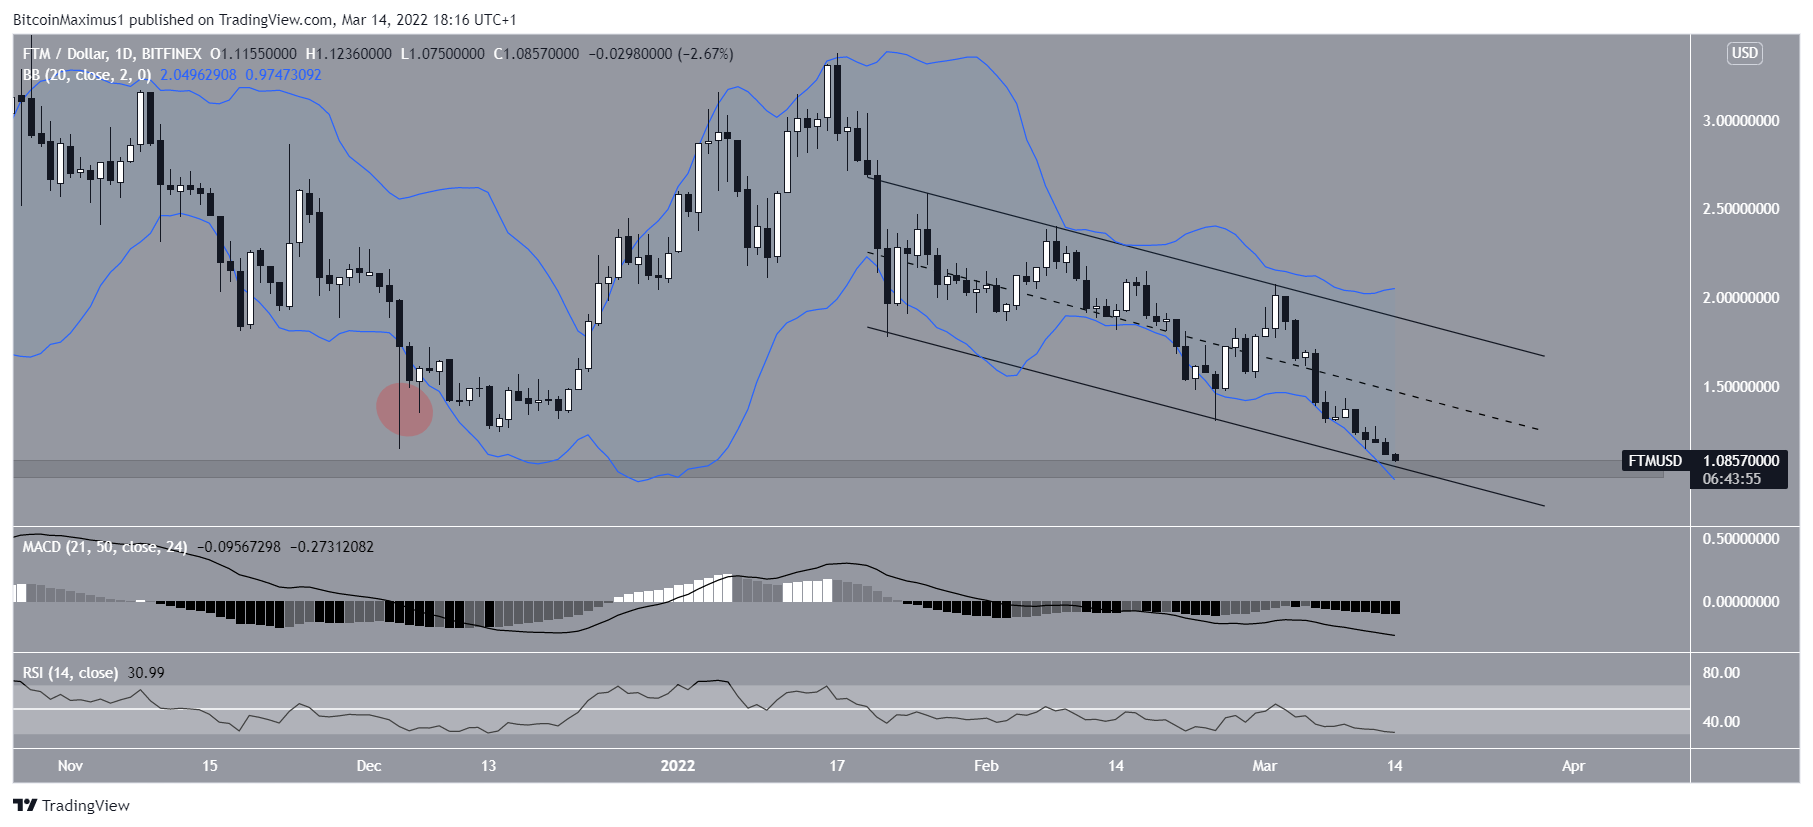
Despite the fact that FTM is approaching a confluence of support level, technical indicators have yet to show any signs of a potential bullish reversal.
This is visible in both the RSI and MACD, which are both falling. Furthermore, the former is below 50 while the latter is negative, both signs of a bearish trend.
Finally, FTM has not yet even fallen below its lower Bollinger Band. The Bollinger band is an indicator that measures the range of the movement, and deviations below/above it (red circle) usually lead to a reversal.
Wave count analysis
Cryptocurrency trader @CryptoCapo_ tweeted a chart of FTM, stating that the correction is just beginning and FTM will eventually drop below $0.60.
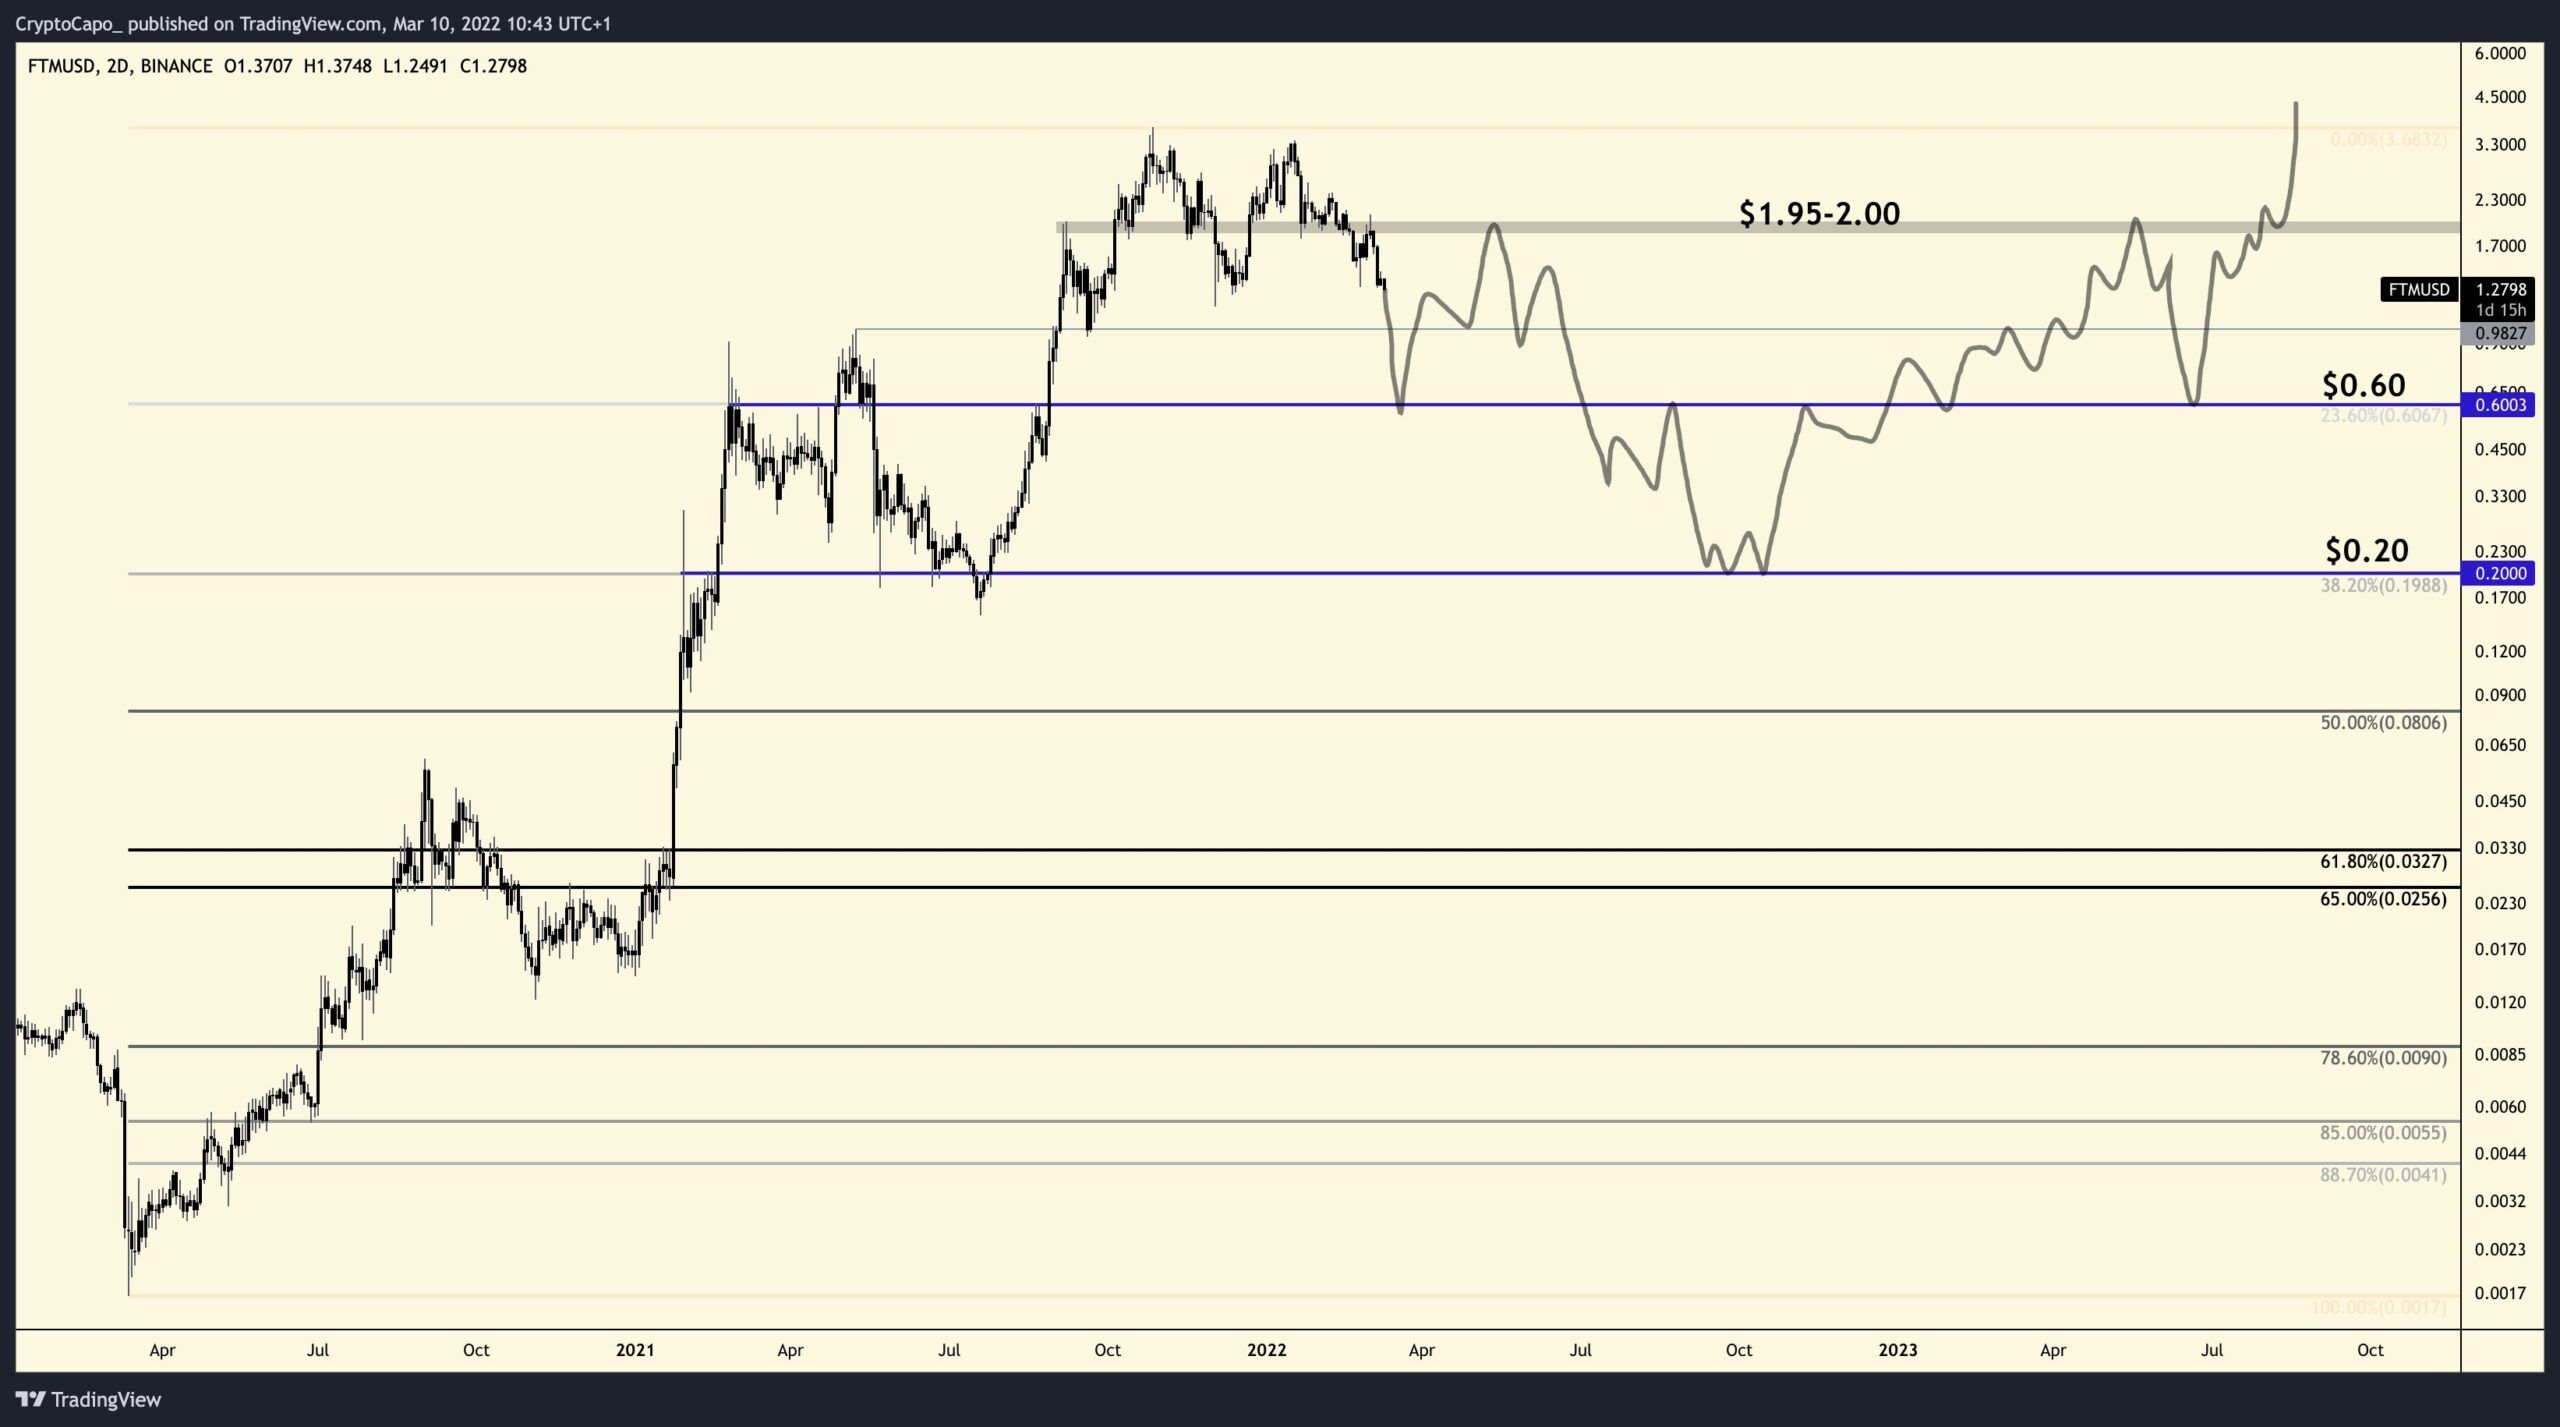
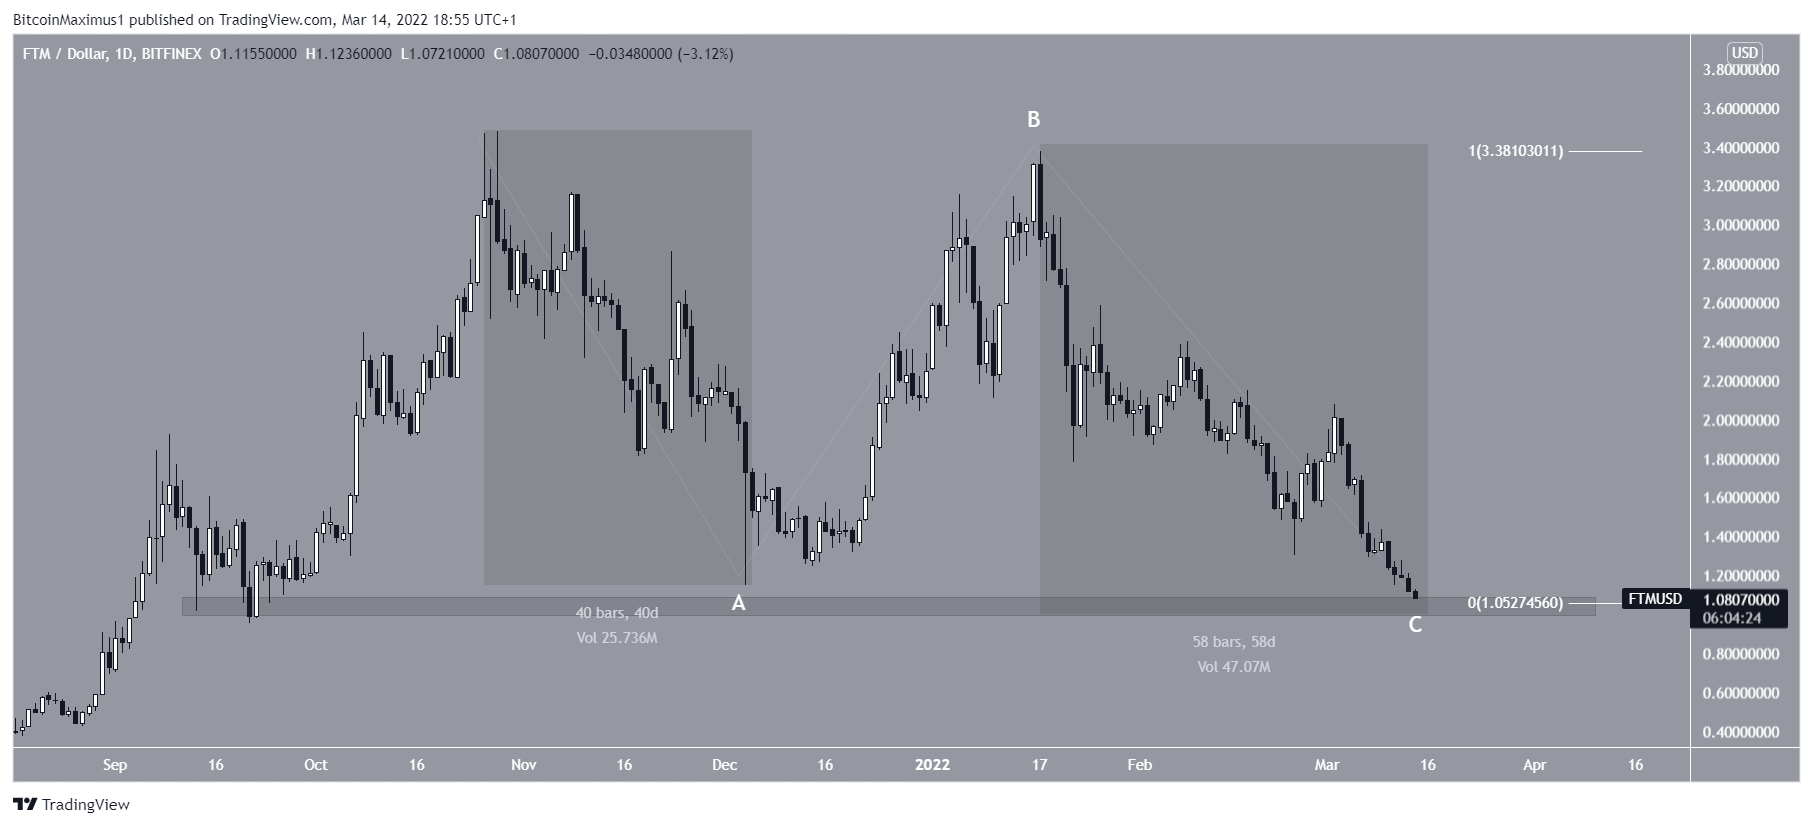
While this is indeed possible in the long-term, it is worth mentioning that both parts of the decrease have had an exactly 1:1 ratio. This is common in A-B-C corrective structures.
Therefore, if this is a corrective structure, it would make sense to end near the current level, since FTM is also approaching a strong support level.
However, as outlined above, there are no bullish reversal signs in place yet.