


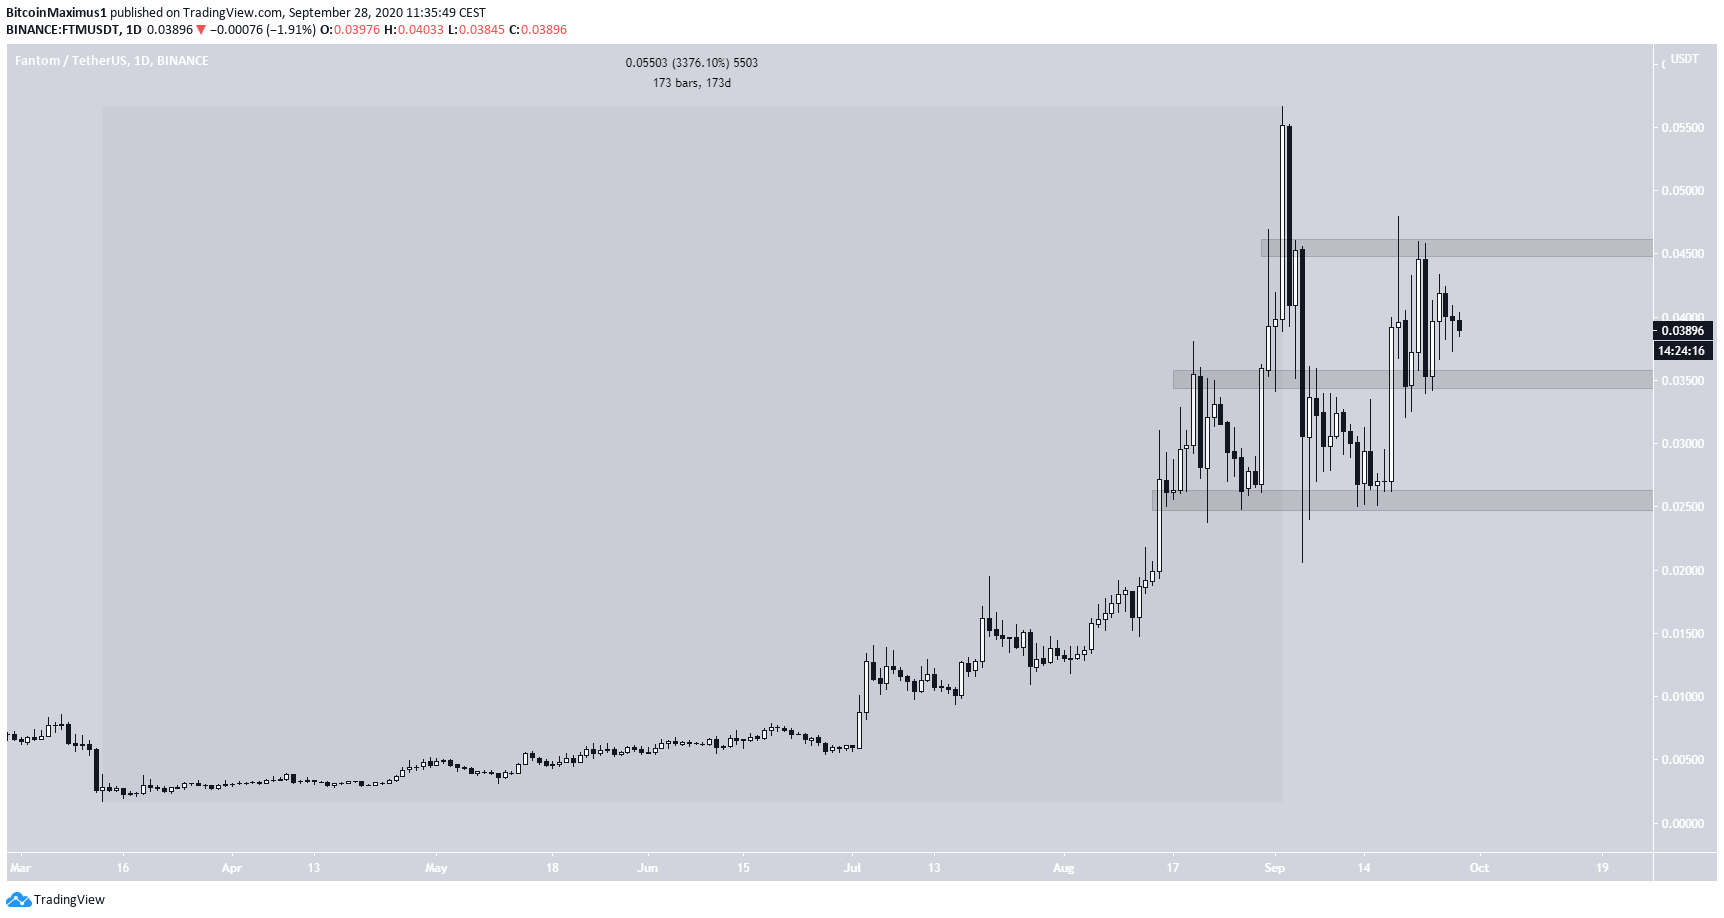
The Fantom (FTM) price is trading inside a short-term symmetrical triangle, from which a breakout is expected.
In a 173-day period measuring from March 13 to Sept 12, the FTM price increased by 3,376%, culminating with a high of $0.056. However, the price has been decreasing rapidly since and is currently trading near $0.039.
Fantom (FTM) Trading Range
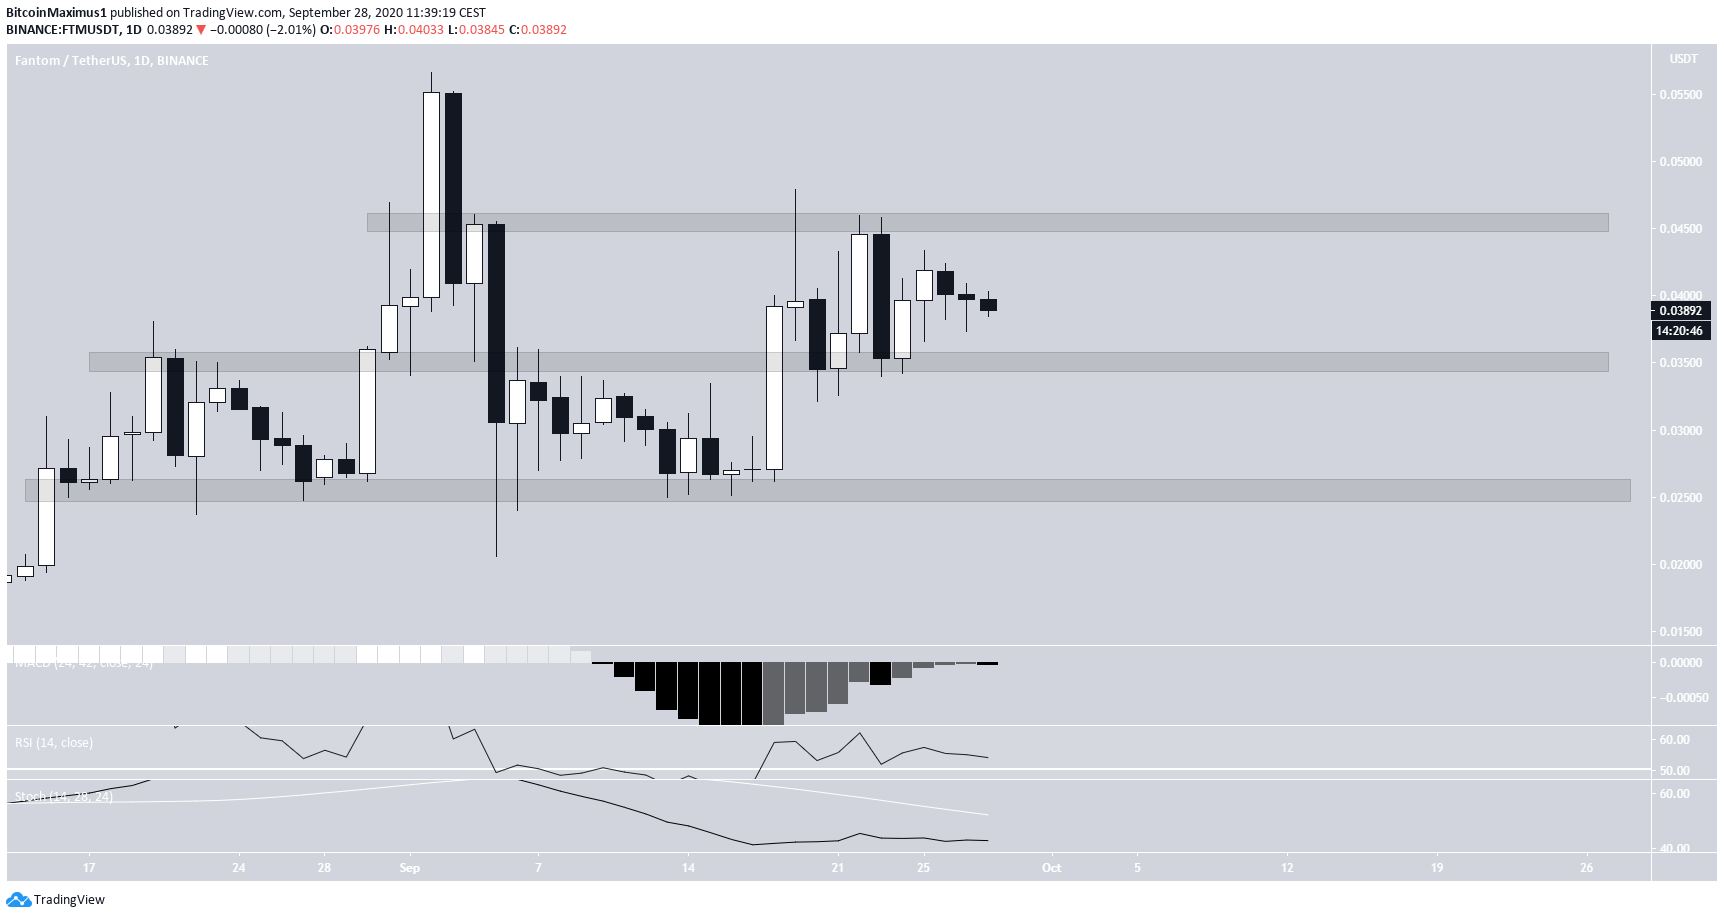
There are three main levels which have created a trading range for FTM:
- $0.255
- $0.35
- $0.455
FTM has been trading above the first two zones for the past week or so. These levels are expected to act as support if the price drops back. FTM has not been able to crack the $0.455 resistance since briefly breaking above on Sept 2.
A breakout or breakdown from these levels would likely initiate rapid movement in that direction. However, as long as the price is trading above $0.35, another attempt at breaking out above $0.455 remains the most likely possibility.
Technical indicators in the daily time-frame are undecided. While the MACD is nearing positive territory, it has just begun to decrease. The RSI is above 50 but the stochastic oscillator has not yet made a bullish cross.
Therefore, a look at shorter time-frames is required in order to better determine the direction of the future movement.
Short-Term Movement
Cryptocurrency trader @cryptotoni_ outlined an FTM chart, in which the price is trading inside a symmetrical triangle and outlined a possible breakout in the short-term:
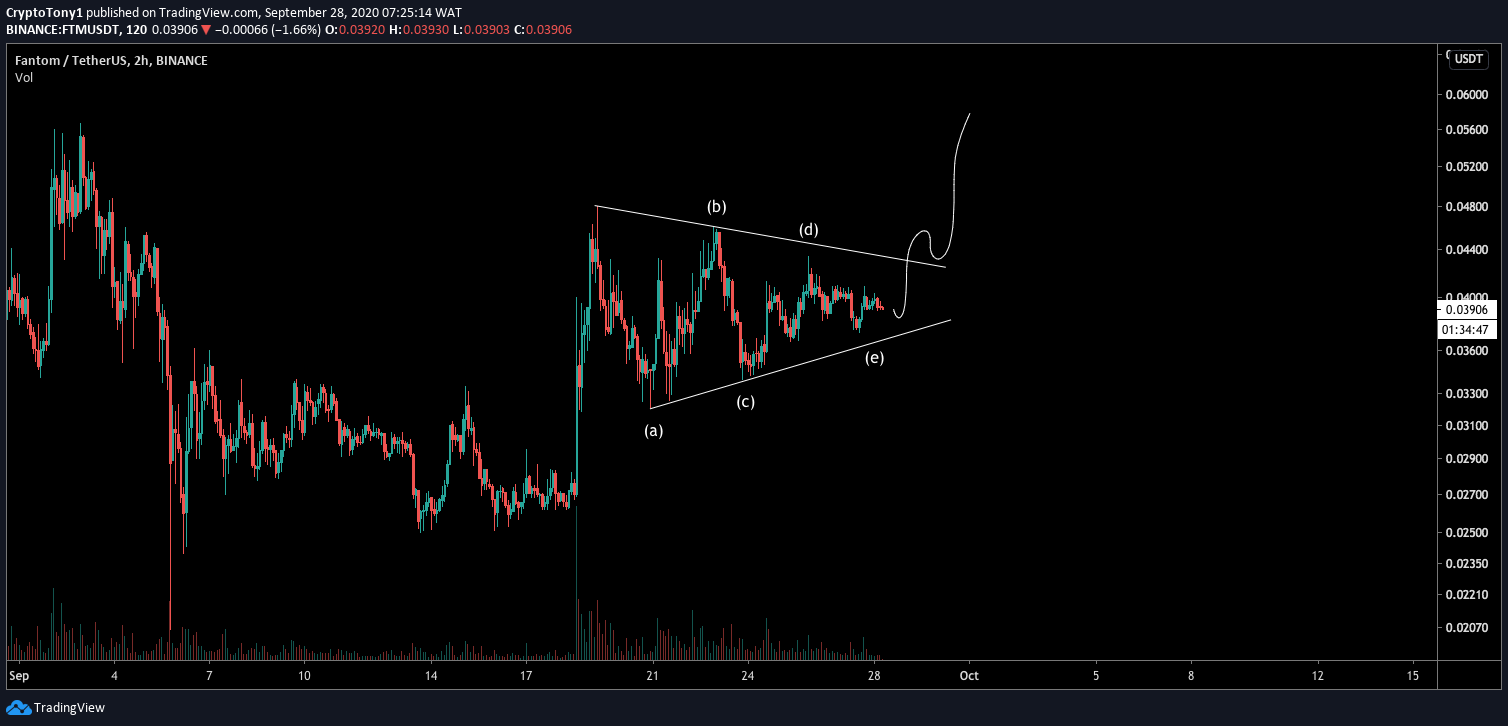
The triangle is mostly made up of the B wave (shown in blue below) of an A-B-C formation. Depending on the length of the C wave, the breakout from the triangle could take the price towards the range of $0.052 – $0.064.
Inside the triangle, it seems that the price has already completed an A-B-C-D-E sub-wave count (red), meaning that a breakout is likely to happen sooner rather than later. A decrease below the sub-wave C low at $0.034 would invalidate this formation.
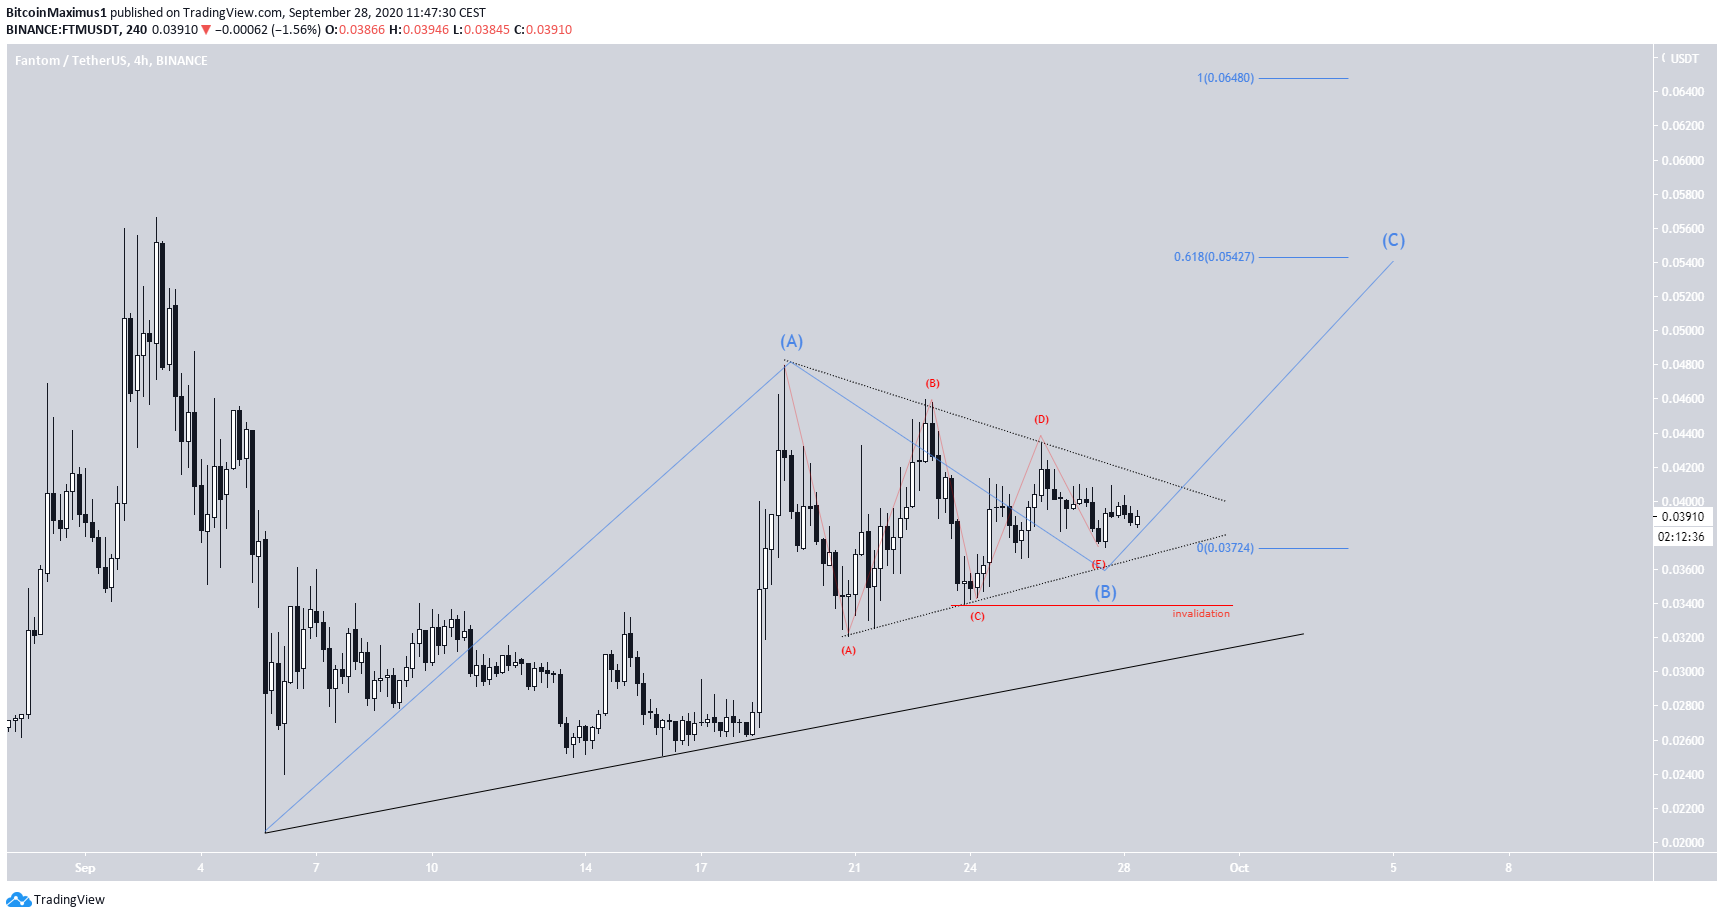
To conclude, the FTM price is expected to break out from its symmetrical triangle and head towards its September highs.
For BeInCrypto’s latest Bitcoin (BTC) analysis, click here!


